www.ann-geophys.net/33/1097/2015/ doi:10.5194/angeo-33-1097-2015
© Author(s) 2015. CC Attribution 3.0 License.
Simulation of the Indian summer monsoon onset-phase rainfall
using a regional model
C. V. Srinivas1, D. Hari Prasad2, D. V. Bhaskar Rao3, R. Baskaran1, and B. Venkatraman1 1Radiological Safety Division, Radiological Safety & Envrionment Group, Indira Gandhi Centre for Atomic Research, Kalpakkam 603102, India
2Physical Sciences and Engineering Division, King Abdullah University of Science and Technology, Thuwal, Saudi Arabia 3Centre for Atmospheric Science, KL University, Vaddeswaram 522502, AP, India
Correspondence to:C. V. Srinivas ([email protected])
Received: 21 November 2014 – Revised: 28 August 2015 – Accepted: 31 August 2015 – Published: 11 September 2015
Abstract. This study examines the ability of the Advanced Research WRF (ARW) regional model to simulate Indian summer monsoon (ISM) rainfall climatology in different cli-mate zones during the monsoon onset phase in the decade 2000–2009. The initial and boundary conditions for ARW are provided from the NCEP/NCAR Reanalysis Project (NNRP) global reanalysis. Seasonal onset-phase rainfall is compared with corresponding values from 0.25◦ IMD (In-dia Meteorological Department) rainfall and NNRP precip-itation data over seven climate zones (perhumid, humid, dry/moist, subhumid, dry/moist, semiarid and arid) of In-dia to see whether dynamical downscaling using a regional model yields advantages over just using large-scale model predictions. Results show that the model could simulate the onset phase in terms of progression and distribution of rain-fall in most zones (except over the northeast) with good cor-relations and low error metrics. The observed mean onset dates and their variability over different zones are well re-produced by the regional model over most climate zones. It has been found that the ARW performed similarly to the re-analysis in most zones and improves the onset time by 1 to 3 days in zones 4 and 7, in which the NNRP shows a delayed onset compared to the actual IMD onset times. The vari-ations in the onset-phase rainfall during the below-normal onset (June negative) and above-normal onset (June posi-tive) phases are well simulated. The slight underestimation of onset-phase rainfall in the northeast zone could be due to failure in resolving the wide extent of topographic varia-tions and the associated multiscale interacvaria-tions in that zone. Spatial comparisons showed improvement of pentad rainfall in both space and quantity in ARW simulations over NNRP
data, as evident from a wider eastward distribution of pen-tad rainfall over the Western Ghats, central and eastern India, as in IMD observations. While NNRP under-represented the high pentad rainfall over northeast, east and west coast areas, the ARW captured these regional features showing improve-ment upon NNRP reanalysis, which may be due to the high resolution (30 km) employed. The onset-phase rainfall char-acteristics during the contrasting ISM of 2003 and 2009 are well simulated in terms of the variations in the strength of low-level jet (LLJ) and outgoing long-wave radiation (OLR). Keywords. Meteorology and atmospheric dynamics (clima-tology; general circulation; tropical meteorology)
1 Introduction
Predic-tion of the rainfall during the onset phase of ISM is impor-tant as it impacts not only agricultural farming, but also wa-ter resources and power sectors. Circulation features, like the movement of the intertropical convergence zone, the Arabian Sea and Bay of Bengal streams of monsoon current and their spread to the Indian subcontinent, need to be assessed pre-cisely (Hastenrath, 1994; Rao, 1976; Webster et al., 1998). The onset of ISM occurs suddenly and is an indication of the commencement of the rainy season over the Indian subconti-nent. During the onset of the monsoon circulation over India, dramatic changes occur in the large-scale atmospheric struc-ture over the monsoon region (Joseph, 2012). A few of these changes include a rapid increase in daily rain rate, an increase in the columnar moisture and an increase in the strength of the low-level atmospheric flow. As for rainfall, the onset phase is marked with a sharp and sustained increase in rain-fall at a cluster of stations along the coast of Kerala in south-ern India (Ananthakrishnan and Soman, 1989; Ananthakrish-nan et al., 1967; Bhaskar Rao et al., 2008; Chakraborty et al., 2006; Goswami, 2012; Rao 1976; Soman and Kumar, 1993). Remarkable changes in regional atmospheric circulation fea-tures occur around the onset time (Ananthakrishnan and So-man, 1988; Joseph et al., 1994; Krishnamurti, 1985; Pearce and Mohanty, 1984). An important phenomenon during the onset phase is a sudden increase of kinetic energy (KE) over the low-level jet (LLJ) region (55–65◦E, 5–15◦N) which is associated with a subsequent enhancement in precipitation over the monsoon region (70–110◦E, 10–30◦N) (Goswami, 2012). The interannual variability of the onset phase is re-lated to, among others, sea surface temperatures (SSTs) over the south tropical Indian Ocean and western equatorial Pa-cific (Flatau et al., 2003; Joseph et al., 1994). The onset of ISM occurs through the progression of its two currents i.e., the Arabian Sea stream which strikes the west coast in Ker-ala (southern tip of India), and the Bay of Bengal stream that strikes Assam and other northeastern states by 1 June. As per long-term rainfall climatology, the Arabian Sea stream ar-rives at the southmost peninsula by 30 May, advances north-ward and extends over Gujarat by 30 June. On the other hand, the Bay of Bengal stream arrives over northeast In-dia around 2 June and advances westward, covering west-ern Uttar Pradesh by 30 June, with the monsoon establishing over northwest India around 15 July (Hastenrath, 1994; Rao, 1976; Soman and Kumar, 1993; Tyagi et al., 2011; Webster et al., 1998). As the ISM exhibits considerable interannual variability, the actual onset dates also vary about the mean dates.
A number of statistical and synoptic methods are sug-gested for the prior estimation of the onset of ISM (Anan-thakrishnan and Soman, 1988; Fasullo and Webster 2003; Joseph et al., 2006; Xavier et al., 2007; Wang et al., 2009) in addition to dynamic model application. In the dynamical method, atmospheric general circulation models (GCM) are used to simulate the summer monsoonal atmospheric circu-lation and associated rainfall. However, GCMs are limited in
Figure 1. (a)Map showing the climatic zones used for rainfall analysis and(b)simulation domain used in the ARW model along with terrain elevation (in m).
2 Methodology
2.1 Numerical experiments
The ARW model version 3.5, developed by NCAR, USA, with a Eulerian mass dynamical core, is adapted as a re-gional atmospheric model and used in the present study for monsoon simulations. ARW comprises primitive equations, non-hydrostatic dynamics and terrain following mass verti-cal coordinates. The model is flexible to be adopted over different geographical regions of interest with nest domains and multiple physics parameterization schemes (Skamarock et al., 2008). The seasonal-scale monsoon simulations in this study are performed following the methodology given by Bhaskaran et al. (1996) for regional model integration. In this downscaling approach, the large-scale dynamics are de-pendent on the synoptic-scale boundary conditions provided from either analysis or global model forecasts, while the re-gional monsoon features, such as low pressure trough and convective systems, are simulated by the regional model at high resolution. For this study the ARW model is configured with a single domain of horizontal resolution of 30 km and 28 vertical levels and with model top at 10 hPa. The simula-tion domain covers the Indian monsoon region from 45◦E–
109◦E in a west–east direction and 8◦S–40◦N in a north–
south direction (Fig. 1b). The selected physics options are WRF single moment 3-class (WSM3) explicit microphysics (Hong et al., 2004), Dudhia scheme (Dudhia, 1989) for short-wave radiation processes, RRTM (rapid radiation transfer model) scheme for long-wave radiation processes (Mlawer et al., 1997), the Yonsei University scheme for the bound-ary layer turbulence (Noh et al., 2003; Hong et al., 2006) and Noah (Chen and Dudhia, 2001) scheme for land surface processes. The Betts–Miller–Janjic (BMJ) scheme (Betts and
Miller, 1986; Janjic, 2000) is used for cumulus convection following the recent sensitivity studies with ARW for ISM rainfall (Hari Prasad et al., 2011; Mukhopadhyay et al., 2010; Srinivas et al., 2012).
The initial atmospheric fields and time-varying bound-ary conditions are derived from the NCEP/NCAR Reanal-ysis Project (NNRP) global reanalReanal-ysis fields (Kalnay et al., 1996) available at 2.5◦ latitude/longitude resolution and at
dy-namics (surface evaporation and large-scale dynamical con-vergence in the monsoon trough region). The first 11-day pe-riod (1–11 May) of each simulation is considered as spin-up time of the model to adjust to the model topography and other surface processes. In seasonal-scale forecasting using regional models where the boundary conditions are updated from global model forecasts, the predictions would be depen-dent to some extent on the driving GCM bias. As the objec-tive of the present study is confined to the extent of assessing the performance of the regional model in simulating the char-acteristics of the onset-phase rainfall, in terms of magnitude and temporal and spatial variations, the use of real boundary conditions will eliminate the bias from driving global model forcing. Simulated rainfall from 12 May onwards is consid-ered as necessary and sufficient to identify the onset dates. The gridded rainfall data available at 0.25◦ resolution over
the Indian region from the India Meteorological Department (IMD) (Pai et al., 2013) are used for validation of the model-derived rainfall for different climate zones.
2.2 Analysis
At first the onset times simulated by the ARW are compared with those obtained from NNRP precipitation to examine whether the model reproduces the onset timing or degrades or improves upon onset time derived from NNRP data which were used to drive the limited-area model. The actual on-set dates for each zone are derived from the IMD gridded rainfall data. Analysis of model-derived rainfall and corre-sponding NNRP precipitation and IMD gridded daily rain-fall data has been performed to derive 24 h daily rainrain-fall (12 May to 15 July for daily rainfall) and pentad rainfall (pen-tads centered from 16 May to 15 July) at each of the grid points over the Indian subcontinent for the 10 years (2000– 2009) under study. These 10-year composites are analyzed to assess the prediction of the onset phase of ISM in terms of mean and variability of the dates of onset and error met-rics for the spatial distribution. As complementary to this assessment, the rainfall during contrasting onset phases has been analyzed. The 3 years of June with above-normal rain-fall (June positive; hereafter+ve) i.e., 2000, 2003 and 2007, and the 3 years with below-normal rainfall (June negative; hereafter −ve) i.e., 2004, 2006 and 2009, have been ana-lyzed to assess the model performance during contrasting onset phases (http://www.imd.gov.in/section/nhac/dynamic/ Monsoon_frame.htm). The rainfall composites are analyzed to examine whether the simulations could capture the inter-annual variations in the onset phase of ISM. Further, the results for 2003 and 2009 are analyzed separately as rep-resentative of normal and deficit monsoon seasons, respec-tively. The seasonal rainfall of the ISM in 2003 was 102 % of normal rainfall and was well distributed both in space and timing (IMD, 2004). In the year 2009, the Indian sub-continent experienced a severe monsoon drought, with the country receiving just 77 % of its normal rainfall (Preethi
et al., 2011). To assess the monsoon onset rainfall in time and space, a set of seven zones of relatively homogeneous monsoon rainfall with different climatic types (Das, 1968; Rao, 1976; Mandal et al., 1999; Thornthwaite and Mather, 1955) falling in different geographic regions are considered (Fig. 1a). A description of these zones is given in our ear-lier work (Srinivas et al., 2012). Zone 1 is located in dry-semiarid northern India, zone 2 in the arid northwest, zone 3 in dry-subhumid central India, zone 4 in moist-subhumid central northeast, zone 5 in the perhumid northeast, zone 6 along the perhumid west coast and zone 7 in the semi-arid southeast peninsular of India, respectively. The climatologi-cal mean monsoonal rainfall is 700 mm in zone 1 (Thornth-waite moisture indexImbetween−33.4 to−83.3), 850 mm in zone 2 (Im<−66.7), 1025 mm in zone 3 (Imin the range −33.3 to 0), 1000 mm in zone 4 (0 <Im< 20), 1450 mm in zone 5 (20 <Im< 100), 3000 mm in zone 6 (Im> 100) and 850 mm in zone 7 (−49.9 <Im<−33.4) respectively (Srini-vas et al., 2012). As the onset phase is characterized by a sudden increase in rainfall (Rao, 1976), pentad (5-day run-ning total) rainfall is used to examine the advancement of the onset phase and to analyze the onset time in different zones. In this study, the IMD criteria adopted after Joseph et al. (2006) is used to derive the onset dates for each zone, with the slight modification of using pentad rainfall in place of daily rainfall. As per IMD criteria, if pentad rainfall in a zone continuously increases after 12 May and exceeds an amount of 1.5 cm or more, the onset is identified as the sec-ond day of that pentad. A close examination of the daily and pentad rainfall time series clearly revealed that pentad rain-fall is more appropriate to assess the onset time of ISM as it smoothes out fluctuations over small periods, as these vari-ations usually make the assessment difficult from the daily time series. The time series of pentad rainfall are obtained from area average rainfall computed at each time point for each zone. The model validation includes comparisons of model fields of winds, temperature and rainfall, with anal-ysis of fields for the 10-year (2000–2009), June+ve years (2000, 2003, and 2007) and June−ve years (2004, 2006 and 2009) separate composites, and time series of daily, running pentads for the onset phase from 16 May to 15 July for dif-ferent zones and for the entire monsoon region. In addition to the above composites, two contrasting monsoon seasons i.e., 2003 (normal monsoon) and 2009 (deficit monsoon) are con-sidered separately to statistically assess the simulation of the onset-phase rainfall characteristics in the normal and deficit monsoons.
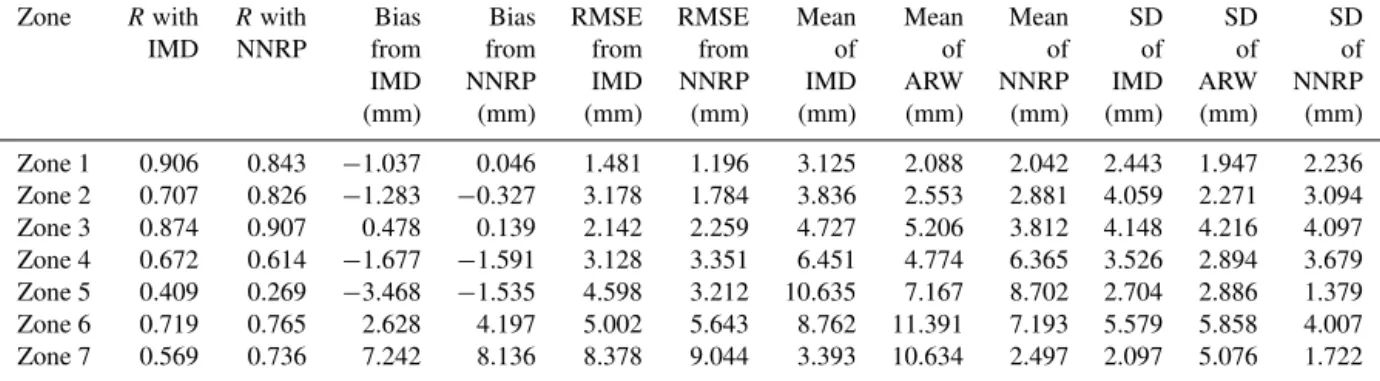
Table 1.Error metrics (correlation –R, standard deviation (SD), bias and root mean square error (RMSE)) between simulated, NNRP precipitation and IMD observed daily rainfall time series from 16 May to 15 July for different zones for the composite 2000–2009.
Zone Rwith Rwith Bias Bias RMSE RMSE Mean Mean Mean SD SD SD
IMD NNRP from from from from of of of of of of
IMD NNRP IMD NNRP IMD ARW NNRP IMD ARW NNRP
(mm) (mm) (mm) (mm) (mm) (mm) (mm) (mm) (mm) (mm)
Zone 1 0.906 0.843 −1.037 0.046 1.481 1.196 3.125 2.088 2.042 2.443 1.947 2.236
Zone 2 0.707 0.826 −1.283 −0.327 3.178 1.784 3.836 2.553 2.881 4.059 2.271 3.094
Zone 3 0.874 0.907 0.478 0.139 2.142 2.259 4.727 5.206 3.812 4.148 4.216 4.097
Zone 4 0.672 0.614 −1.677 −1.591 3.128 3.351 6.451 4.774 6.365 3.526 2.894 3.679
Zone 5 0.409 0.269 −3.468 −1.535 4.598 3.212 10.635 7.167 8.702 2.704 2.886 1.379
Zone 6 0.719 0.765 2.628 4.197 5.002 5.643 8.762 11.391 7.193 5.579 5.858 4.007
Zone 7 0.569 0.736 7.242 8.136 8.378 9.044 3.393 10.634 2.497 2.097 5.076 1.722
given below:
COR=
n P
i=1
(fi−f )(oi=o)
s n P
i=1
(fi−f )2 s
n P
i=1
(oi=o)2
(1)
BIAS=1
n n X
i=1
(fi−oi)=f−o (2)
MAE=1
n n X
i=1
|fi−oi| (3)
RMSE= v u u t 1 n n X
i=1
(fi−oi)2, (4)
whereoi is observed pentad rainfall,fi is simulated pentad rainfall, the overbar represents spatial and temporal average over all the data andnis the sample size. The above statistics are computed for each zone considered in the analysis for each of the 10-year (2000–2009) composite, June+ve years (2000, 2003, and 2007) and June−ve years (2004, 2006 and 2009) composites, the normal monsoon year (2003) and the deficit monsoon year (2009).
3 Results and discussion
The ARW simulations are compared with the NCEP reanal-ysis precipitation data to test whether downscaling provides any advantages over the reanalysis with regard to the timing of the onset. Though precipitation is not used as ARW in-put, it is a part of the NNRP data set that is used to drive the regional model. The model relative performance for on-set timing with respect to NNRP reanalysis is assessed using the actual onset dates over different climatic zones derived using the IMD gridded rainfall as reference.
3.1 Time series in zone-wise pentad rainfall 3.1.1 Analysis of the 10-year composite
The onset of the southwest monsoon normally occurs on 1 June in Kerala and gradually progresses from southern to northern India and covers the entire country by 15 July (Fig. 1a). Hence, to assess the characteristics of the onset phase, observed and model-simulated rainfall for each year of the 10-year period from 2000–2009 are analyzed for the period 16 May to 15 July. The fluctuation of the monsoon onset date about the mean and extremes in onset timing are analyzed. All the error metrics are computed considering the time series starting from one pentad earlier than the onset pentad and ending with the last pentad i.e., the pentad for the period 11–15 July.
The time series of the simulated 10-year (2000–2009) mean daily rainfall over the specified seven zones, along with corresponding NNRP and IMD observed mean daily rainfall, are considered for analysis and validation (Table 1). A sud-den increase of rainfall associated with the onset is simulated in most of the zones similar to the NNRP and IMD rain-fall. During the onset phase, rainfall is slightly overestimated in zones 3 and 6, considerably overestimated in zone 7, in close agreement in zone 1 and slightly underestimated in zones 2, 4 and 5, as compared to both NNRP precipitation and IMD observations. Compared with IMD data for the en-tire sample of 10 years between 2000 and 2009, the simu-lated daily rainfall during the onset phase has a smaller wet bias (0.48 to 2.63 mm day−1) in zones 3 and 6, a smaller dry bias (−1.04 to −1.68 mm day−1), except zone 5, lo-cated in northeast India and which has a relatively large dry bias (−3.47 mm day−1), and zone 7 in southeast India which has a larger wet bias (7.2 mm day−1) (Table 1). While most zones have moderate rainfall errors (RMSE < 3.0 mm day−1), zones 5, 6 and 7 have relatively large rainfall errors (RMSE
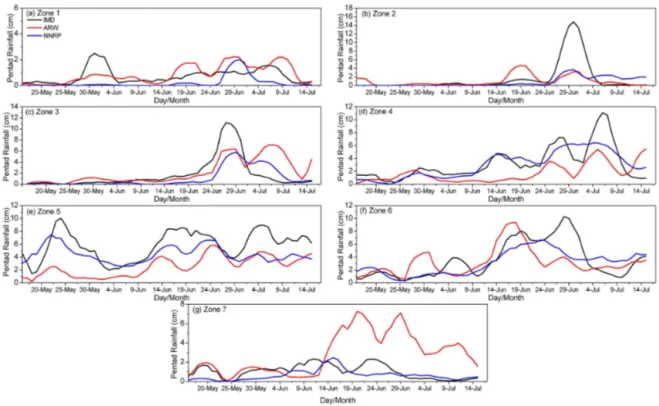
Figure 2.Time series of running pentad rainfall (cm) averaged over different rainfall zones in the period 12 May–30 June for the 10-year (2000–2009) composite, along with corresponding pentad rainfall derived from NNRP reanalysis and IMD 50 km gridded rainfall data. The first pentad is 12–16 May, the second pentad is 13–17 May . . . and the last pentad is 26–30 June. Panels (a) to (g) correspond to zone 1 to zone 7.
from IMD data, which indicates good simulation of rainfall distribution. Compared with NNRP precipitation, it is seen that the dry bias is reduced by 5 % in zone 4, by∼60 % for zones 1, 2 and 5, and wet bias is reduced by 70 % in zone 3, increased by 50 % in zones 6 and 12 % in zone 7, relative to IMD precipitation. The model RMSE errors for rainfall pre-diction with reference to NNRP data in zones 1 to 4 are rela-tively fewer than those obtained with the IMD data. Further, the mean and SD of simulated rainfall in zones 1 to 5 are closer to those of NNRP precipitation than the correspond-ing values from IMD observations. The reduction in the bias and RMSE, and improvement in correlation with reference to NNRP rainfall, indicates that the model rainfall follows the NNRP precipitation in zones 1 to 5 more closely, indicat-ing the reproducibility of onset-phase precipitation by the re-gional model as in the driving data set. Zone 7 falls in the rain shadow area of the southwest monsoon and receives much less rainfall during monsoon. In this zone model, simulated onset-phase rainfall is rather high, as seen from the large pos-itive bias with reference to both NNRP and IMD data.
It is important to assess the onset dates over different zones to understand the progress of the monsoon over different ho-mogeneous rainfall regions. The time series of the running pentad rainfall i.e., cumulative rainfall in the preceding 5 days (Ananthakrishnan and Soman, 1988; Fasullo and Web-ster, 2003; Joseph et al., 2006; Xavier et al., 2007; Wang et
Table 2.Statistics of long-term normal onset dates, and mean, ear-liest and latest onset dates from observations and the simulation for the period 2000–2009.
zone Long-term Mean onset dates Variation in onset time normal (2000–2009) (SD) (days) onset dates
IMD ARW NNRP IMD ARW NNRP
1 20 June 19 June 18 June 19 June 6.6 8.4 7.1 2 18 June 17 June 20 June 20 June 6.4 8.5 6.8 3 14 June 16 June 18 June 15 June 7.1 8.1 7.7 4 12 June 11 June 10 June 8 June 8.7 8.2 6.6 5 4 June 2 June 4 June 3 June 5.6 6.1 6.2 6 8 June 1 June 1 June 1 June 5.3 4.9 6.7 7 3 June 9 June 9 June 10 June 5.1 4.5 5.7
10-year period (2000–2009) from the simulation, NNRP precip-itation and IMD observations in different climate zones are presented in Table 2. The mean onset dates from the simula-tion are noted to agree with those obtained from IMD rain-fall as well as NNRP precipitation with a difference of 1 to 3 days. It is seen that the variability of the long-term mean on-set date from the 10-year mean from all three of the data on-sets (IMD, NNRP, ARW simulation) is less than 6 days over dif-ferent zones. The variation in simulated onset dates followed that obtained from the NNRP precipitation field over differ-ent zones closely. The mean pdiffer-entad rainfall for the 10-year period (2000 to 2009) is shown in Fig. 2 over different zones along with the corresponding pentad rainfall computed from IMD gridded rainfall data as well as NNRP reanalysis. The simulation gives the same onset dates in zones 2 and 6, a 1 to 3-day early onset in zones 1 and 7 and a 1 to 3-day delay of onset in zones 3–5, relative to the onset dates obtained from NNRP data. Similar variation in onset dates is also noticed relative to the IMD based onset dates, however the simulated onset dates are closer to those based on NNRP precipitation. The above results of the comparison of model performance with IMD and NNRP rainfall data sets clearly show that the ARW simulation improves the onset times in zones 4 and 7, while giving similar onset timing over the rest of India as in NNRP. The 1 to 2-day early onset over south, north and central India, and 1 to 3-day delay of onset over northeast In-dia, indicate rapid progress of the Arabian Sea stream and the gradual progress of the Bay of Bengal stream of ISM in the simulation. For zone 4, model pentad rainfall is above 1.5 cm over a few days from 16 May (Fig. 2); it then decreased till 4 June as in NNRP and IMD data, indicating pre-onset rain-fall. Subsequently, pentad rainfall in this zone increased from 6 June and it exceeded 1.5 cm around 11 June, indicating the actual onset to be around 11 June, lagging by 2 days, relative to both IMD and NNRP. In zone 5, situated in a perhumid cli-mate, the pentad rainfall is underestimated (∼3 cm) from 16 May till 3 June and it increased continuously after 4 June, in-dicating the onset around 5 June and a delay of 1 and 2 days, relative to NNRP and IMD data, respectively. In zone 6, the pentad rainfall from all three data sources i.e., IMD, NNRP and model results, indicates the end of the pre-onset phase by 30 May and onset around 1 June. The onset in zone 7 is around 7 June, indicating early onset of 2 to 3 days in this zone. Overall, the mean onset dates simulated by ARW in most zones are in good agreement with the onset time found from NNRP analysis and IMD rainfall data, except zones 3, 5 and 7, where a difference of∼2 days is found. The pentad rainfall is underestimated in zone 5. Further, the variability (SD) of simulated onset dates ranges from 5.7 to 7.7 days for NNRP and 5.1 to 8.7 days for IMD rainfall, whereas the SD of onset dates varies from 4.5 to 8.5 for the simulation. The model-simulated variability is slightly larger for zones 1 and 2. The maximum variability found in onset timing is within 8 days in most zones and closely matches that obtained from
NNRP. The mean onset dates and their variability indicate a reasonable simulation of the onset phase of the monsoon.
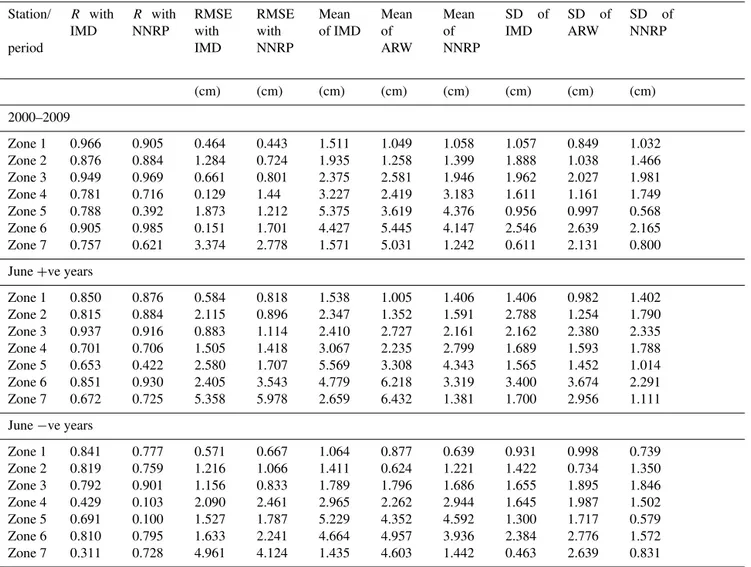
The correlation and root mean square error (RMSE) com-puted between the time series of pentad rainfall from sim-ulation and those based on NNRP, IMD rainfall data sets (for lead times of about 61 days or a season) are presented in Table 3 for different climate zones for the 10-year period (2000–2009). The correlations are obtained at a 95 % signifi-cance level. Good correlations (> 0.78 with IMD; > 0.62 with NNRP) are found for pentad rain over all zones except for zone 5, which has a poor correlation of 0.38 with NNRP data. Zone 5 has wide extent of low orographic heights (∼1400 m) as compared to zone 6, with the Western Ghats having larger north–south (∼1600 km) and shorter east–west (∼100 km) extents and higher peaks (∼2700 m). Zone 5 has a highly undulating topography, with Brahmaputra Valley surrounded by relatively tall mountain ranges. The convection associ-ated with extreme rainfall events over northeast India have been shown to be associated with multiscale (large-scale and mesoscale) circulation interaction with local topogra-phy (Goswami et al., 2010). Correlations are improved with NNRP data over most zones except zone 5. The significantly low correlation for onset-phase rainfall over the undulating terrain of zone 5 with NNRP data is attributed to the model deficiency to capture the mesoscale convective organization at 30 km resolution. Although zone 6 also has complex to-pography, the model could simulate the topographic effects on monsoon rainfall, leading to good correlations for rainfall. Next to zone 5, zone 7 has the lowest correlation (6.2 with NNRP; 0.75 with IMD). Zone 7 falls in the rain shadow area of the Western Ghats and records low rainfall during the sum-mer monsoon (Rao, 1971). However, model pentad rainfall has a large wet bias in this zone. The RMSE in pentad rainfall is below 1.7 cm in most zones except zones 5 and 7, which have RMSE of more than 1.5 cm with respect to IMD pentad rainfall. The RMSE of simulated pentad rainfall is reduced by∼40 % with respect to NNRP data. Similar results are found in the mean and SD of pentad rainfall derived from the three sources of data. The mean and SD of simulated pentad rainfall in most zones for the 10-year period as well as June
Table 3. Error metrics (correlation coefficient –R, root mean square error (RMSE)) between pentad rainfall time series based on ARW simulation, NNRP precipitation and IMD observed rainfall in different zones from 16 May to 15 July for the 2000–2009, June−ve and June
+ve composites.
Station/ period
R with IMD
R with NNRP
RMSE with IMD
RMSE with NNRP
Mean of IMD
Mean of ARW
Mean of NNRP
SD of IMD
SD of ARW
SD of NNRP
(cm) (cm) (cm) (cm) (cm) (cm) (cm) (cm) 2000–2009
Zone 1 0.966 0.905 0.464 0.443 1.511 1.049 1.058 1.057 0.849 1.032 Zone 2 0.876 0.884 1.284 0.724 1.935 1.258 1.399 1.888 1.038 1.466 Zone 3 0.949 0.969 0.661 0.801 2.375 2.581 1.946 1.962 2.027 1.981 Zone 4 0.781 0.716 0.129 1.44 3.227 2.419 3.183 1.611 1.161 1.749 Zone 5 0.788 0.392 1.873 1.212 5.375 3.619 4.376 0.956 0.997 0.568 Zone 6 0.905 0.985 0.151 1.701 4.427 5.445 4.147 2.546 2.639 2.165 Zone 7 0.757 0.621 3.374 2.778 1.571 5.031 1.242 0.611 2.131 0.800 June+ve years
Zone 1 0.850 0.876 0.584 0.818 1.538 1.005 1.406 1.406 0.982 1.402 Zone 2 0.815 0.884 2.115 0.896 2.347 1.352 1.591 2.788 1.254 1.790 Zone 3 0.937 0.916 0.883 1.114 2.410 2.727 2.161 2.162 2.380 2.335 Zone 4 0.701 0.706 1.505 1.418 3.067 2.235 2.799 1.689 1.593 1.788 Zone 5 0.653 0.422 2.580 1.707 5.569 3.308 4.343 1.565 1.452 1.014 Zone 6 0.851 0.930 2.405 3.543 4.779 6.218 3.319 3.400 3.674 2.291 Zone 7 0.672 0.725 5.358 5.978 2.659 6.432 1.381 1.700 2.956 1.111 June−ve years
Zone 1 0.841 0.777 0.571 0.667 1.064 0.877 0.639 0.931 0.998 0.739 Zone 2 0.819 0.759 1.216 1.066 1.411 0.624 1.221 1.422 0.734 1.350 Zone 3 0.792 0.901 1.156 0.833 1.789 1.796 1.686 1.655 1.895 1.846 Zone 4 0.429 0.103 2.090 2.461 2.965 2.262 2.944 1.645 1.987 1.502 Zone 5 0.691 0.100 1.527 1.787 5.229 4.352 4.592 1.300 1.717 0.579 Zone 6 0.810 0.795 1.633 2.241 4.664 4.957 3.936 2.384 2.776 1.572 Zone 7 0.311 0.728 4.961 4.124 1.435 4.603 1.442 0.463 2.639 0.831
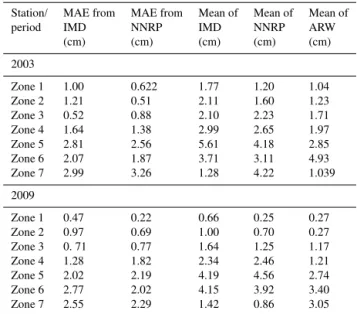
indicating reasonably good simulation of onset-phase rain-fall in both the years. Zone 5 is characterized by significant orography and heavy rainfall during the onset phase of the monsoon. It has been noted that in both 2003 and 2009, ex-cept for zone 7, the ARW mean pentad rain is closer to that of NNRP data and the mean errors (MAE) in pentad rainfall are reduced when compared with NNRP, relative to IMD obser-vations. Error statistics of zone-wise pentad rainfall indicate that the model simulates the onset rainfall better in zones 1, 2, 3, 4 and 6 as compared to the high rainfall hilly region (zone 5) and the semi-arid rain shadow in zone 7. The rea-son for the slight underestimation of rainfall in zone 5 seems to be the inability of the model to resolve the topographic ef-fects and associated short-time mesoscale dynamics properly at the considered 30 km resolution. The above results show that in a forecast using ARW in the present setup, the onset time is maintained in most zones as of NNRP and improved in zones 4 and 7 over NNRP. The onset-phase rainfall
analy-sis presented above clearly shows that the limited-area ARW model improves on the reanalysis in zones 1, 2, 3, 4 and 6; however, it slightly underestimated rainfall in the complex hilly region (zone 5) and overestimated the rainfall over the semi-arid zone 7. Compared with IMD data, though the onset times are not degraded in any of the zones, the errors intro-duced in onset-phase rainfall amount in zones 5 and 7 over NNRP precipitation data suggest the need for improvements in the model setup such as an increase in resolution to resolve the topographic effects.
Figure 3.Time series of running pentad rainfall (cm) averaged over different rainfall zones in the period 12 May–30 June 2002 along with corresponding pentad rainfall derived from NNRP reanalysis and IMD 50 km gridded rainfall data. The first pentad is 12–16 May, the second pentad is 13–17 May . . . and the last pentad is 26 June–30 June. Panels (a) to (g) correspond to zone 1 to zone 7.
Table 4.Mean absolute error (MAE) between pentad rainfall time series based on ARW simulation, NNRP precipitation and IMD ob-served rainfall from 16 May to 15 July for the years 2003 and 2009 for different zones.
Station/ MAE from MAE from Mean of Mean of Mean of
period IMD NNRP IMD NNRP ARW
(cm) (cm) (cm) (cm) (cm)
2003
Zone 1 1.00 0.622 1.77 1.20 1.04
Zone 2 1.21 0.51 2.11 1.60 1.23
Zone 3 0.52 0.88 2.10 2.23 1.71
Zone 4 1.64 1.38 2.99 2.65 1.97
Zone 5 2.81 2.56 5.61 4.18 2.85
Zone 6 2.07 1.87 3.71 3.11 4.93
Zone 7 2.99 3.26 1.28 4.22 1.039
2009
Zone 1 0.47 0.22 0.66 0.25 0.27
Zone 2 0.97 0.69 1.00 0.70 0.27
Zone 3 0. 71 0.77 1.64 1.25 1.17
Zone 4 1.28 1.82 2.34 2.46 1.21
Zone 5 2.02 2.19 4.19 4.56 2.74
Zone 6 2.77 2.02 4.15 3.92 3.40
Zone 7 2.55 2.29 1.42 0.86 3.05
2013). Although IMD initially declared the onset around 29 May, subsequent works (Flatau et al., 2003; Joseph et al., 2006) showed that it was a false monsoon onset associated with propagating tropical intra-seasonal distur-bances/cyclones unrelated to the monsoon onset. In contrast, the monsoon in 2009 was weak, characterized by drought across all of India, and its onset occurred earlier by 1 week (onset on 23 May) (Puranik et al., 2013). The onset rain-fall characteristics are presented for these two typical years (Figs. 3 and 4) for all the zones to show model performance in simulating the onset timing and progression. In the year 2002, model pentad rain is slightly overestimated in zones 1, 6 and 7 (Fig. 3). The tendencies of false onset can be noted in zone 4 in northern India and zones 6 and 7 in southern In-dia, where pentad rainfall above 1.5 cm is noted in the first few pentads. This pre-onset rainfall can be attributed to the convection associated with the quadruplet cyclones observed in the Indian Ocean after 9 May 2002 and the subsequent depression over the Bay of Bengal (Flatau et al., 2003). Ig-noring this rainfall, the time series of pentad rainfall in 2002 indicates an abrupt and sustained increase in pentad rainfall from about 1.5 cm at around 18 June in zone 1, 15 June in zone 2, 22 June in zone 3, 12 June in zone 4, 9 June in zone 5, 29 May in zone 6 and 6 June in zone 7, indicating onset of the monsoon in different zones. The pentad rainfall from NNRP analysis during the onset phase is less than the correspond-ing values from IMD rainfall in zones 1–3 and 6. Comparison of onset dates obtained from analyzing the ARW simulation, IMD and NNRP precipitation data sets shows that the simula-tion, while performing similar to the analysis in most zones, improves the onset time by 5 to 14 days in zones 1–3 in which
the NNRP shows a delayed onset compared to the actual IMD onset times. In the year 2009, though the onset occurred on 23 May over southernmost parts (Kerala), its advance-ment was delayed by 1–2 weeks over the central and north-ern parts of the country (IMD, 2010). As per the northnorth-ern limit of the monsoon (NLM) reported by IMD (http://www. imd.gov.in/section/nhac/dynamic/Monsoon_frame.htm), the monsoon covered the entire country slightly early in 2009. Subsequent to the onset over Kerala, the monsoon advanced over the northeastern states including West Bengal and Sikkim earlier than the norm. The monsoon advanced over the west coast and covered up to∼17◦N by 7 June. A pro-longed hiatus in the further advancement occurred during 8– 20 June due to the weak cross-equatorial flow. This had re-sulted in a delay of about 2 weeks over Maharashtra, Mad-hya Pradesh, Uttar Pradesh, Bihar and Orissa, with actual on-set dates between 26 and 29 June. Thereafter onon-set in west, northwest and northern parts of the country took place in a rapid manner by 30 June. In the year 2009, the pentad rainfall during the onset phase (Fig. 4) is underestimated in zones 1, 2, 5 and 7. From the pentad rainfall the onset time is indicated as 3 July in zone 1, 30 June in zone 2, 27 June in zone 3, 2 July in zone 4, 4 June in zone 5, 29 May in zone 6 and 19 June in zone 7. The ARW simulation for 2009 shows im-provement of onset time by 3–6 days in zones 3 and 7 over those indicated by NNRP. Overall, the identified onset dates from ARW simulations are in good agreement with those from IMD rainfall data for all the zones, except that the pen-tad rainfall is slightly overestimated in different zones. Thus the model could predict the delay in the onset and normal advancement of the monsoon in 2002 and an early onset and delayed advancement of the monsoon in 2009 as in observa-tions. In both these cases, a maximum difference of about 5 days in the mean onset date is noted between the simulation and IMD onset timing, which shows good skill.
3.2 Spatial pentad rainfall distribution
tion shows improvement of pentad rainfall in both area and quantity over NNRP data which is evident from a wider east-ward distribution of pentad rainfall over the Western Ghats, central and eastern India in both simulation and IMD ob-servations. The simulation has missed a few isolated peaks of high pentad rainfall (10–20 cm) over the west coast and the northeast zone, which is due to underestimation of oro-graphic rainfall in these zones (Srinivas et al., 2012). The simulated rainfall for the period (11–15 June) shows spread of rainfall (2–5 cm) into Maharashtra and Chhattisgarh states in the central peninsula and Orissa, West Bengal and Bi-har states in eastern India, as in observations. While NNRP under-represented the high pentad rainfall over northeast, east and west coast areas the ARW captured these regional features showing improvement upon NNRP data, which may be due to the high resolution (30 km) employed. However, ARW simulated some spurious rainfall over southeast India which falls in the rain shadow area of the Western Ghats dur-ing the southwest monsoon.
For the period 16–20 June, simulated rainfall in the range (2–5 cm) shows increase of coverage over central, southeast and northern parts of India in agreement with both IMD and NNRP rainfall data, although Gujarat in the northwest zone is not covered (zone 2) at this time. For the period 21–25 June, the model showed further southward and northwestward ex-tension of rainfall in the range (2–5 cm), indicating monsoon progression in these areas as in observations. The simulated rainfall for the period (26–30 June) indicates further progress of monsoon in northern India as in IMD and NNRP data; but the model failed to simulate the onset rainfall in parts of Jammu and Kashmir and Himachal Pradesh states in northern India (zone 1). Further progression of monsoon in the north-west and northern India occurred after 1 June (not shown). The gradual increase in the spatial extent of simulated rain-fall from 1 June onwards as of the observed rainrain-fall distribu-tion clearly shows that the model could reproduce the timing of the onset phase geographically. The representation of pen-tad rainfall is improved in ARW simulation in quantity and area coverage over NNRP. The spatial pentads indicate slight underestimation of onset rainfall in the west coast as well as in northeastern parts of the country, which could be due to inadequate representation of orography at the moderate res-olution of 30 km. Thus results of pentad-rainfall indicate that the model could simulate the progress of the monsoon dur-ing the onset phase on a seasonal time scale durdur-ing 2000– 2009 in most homogeneous rainfall zones. Though the onset timing in zones 5 and 6 could be reasonably well simulated, the amount of rainfall is slightly underestimated due to in-adequate representation of orography at 30 km resolution. In these zones, relatively high resolution would be required to resolve the smaller spatial-scale i.e., mesoscale convective circulations for improvement of rainfall simulations.
3.3 Simulated onset-phase rainfall characteristics in 2003 and 2009
In the 10-year period (2000–2009), 2003 is a typical wet monsoon year (strong monsoon) while 2009 is a dry mon-soon (weak monmon-soon with deficit rainfall and drought). Hence the monsoons 2003 and 2009 are considered to dis-tinguish the onset-phase rainfall characteristics in contrast-ing monsoons from the simulation. The onset of the mon-soon is associated with a sudden advancement in the So-mali Jet/low-level jet (strong low-level winds) over the Ara-bian Sea and a rapid increase in the rainfall over the Indian subcontinent. They are associated with a simultaneous deep-ening of the monsoon trough below a 850 hPa level across north/central India and the Bay of Bengal and development of the Tibetan anticyclone in the upper troposphere (Bol-lasina et al., 2002; Rao, 1976). A comparison of the simu-lated June mean low-level winds at 850 hPa between 2003 and 2009 along with corresponding fields from NCEP Fi-nal AFi-nalysis (FNL) data, available at 1◦ resolution (NCEP, 2000), are presented in Fig. 6. The simulated low-level circu-lation is slightly stronger in 2003 relative to 2009 as in FNL analysis, especially over the Arabian Sea, suggesting weaker winds in 2009. The height of the seasonal trough at a 850 hPa level is higher (1490 m) in 2003 than (1460 m) in 2009, in-dicating simulation of a deeper trough in 2003. A stronger Somali Jet is simulated in 2003 relative to 2009 as in FNL data. The simulated June mean daily precipitation difference for these years along with the corresponding field from IMD 25 km gridded rainfall and NNRP reanalysis are presented in Fig. 7. The ARW simulation indicates larger area coverage of monsoon rainfall over the Indian land region in 2003 rel-ative to 2009, with precipitation rates of 4 to 12 mm day−1 over central, northern, eastern, southeastern, west coast and northeastern areas of India in addition to low to moderate rainfall (1 to 4 mm day−1) areas in western, southern and northwestern parts, agreeing with IMD and NNRP rainfall. A rainfall reduction of 1 to 12 mm day−1in the northern and central peninsula and the northeast, and about 18 mm day−1 along the west coast is found in the simulation for 2009. This indicates simulation of scanty rainfall in the onset phase of the drought year 2009. The model could simulate the general circulation features of relatively weak low-level winds, weak Somali Jet and the overall decrease of rainfall during onset of the 2009 monsoon, similar to observations and the rainfall reduction in 2009 in the northwest (by∼2 mm day−1) and on the northern west coast (∼15 mm day−1). The simulated 5-day mean precipitation over the Indian land region (8–26◦N,
signif-Figure 6.Mean winds (m s−1) and mean geopotential (m) for June for the years 2003 and 2009. The left panels(a, c)are from the ARW model and the right panels(b, d)are from FNL analysis. The top panels are for the year 2003 and the bottom panels for the year 2009.
Figure 7.Mean daily precipitation anomaly in the contrasting monsoon years (2003–2009) (mm day−1) from(a)NNRP(b)ARW and
(c)IMD gridded rainfall data.
icant increase of rainfall over the country associated with monsoon progression. For the year 2009, the ARW model has generally overestimated the 5-day total rainfall in early June showing an early onset of the monsoon. However, a comparison of precipitation for the 2 years shows that while there is a continuous increase of rainfall in 2003, the rain-fall in 2009 initially increased and is interrupted thereafter in June. The model simulations could bring out these contrast-ing onset rainfall characteristics in 2003 and 2009, agree-ing with NNRP reanalysis and observed IMD rainfall trends. The 5-day rainfall over different zones clearly shows that the model could represent the characteristics of early onset in zones 5 and 6, late onset in zones 1 and 2 and the intermedi-ate onset trends in other zones in both 2003 and 2009 well,
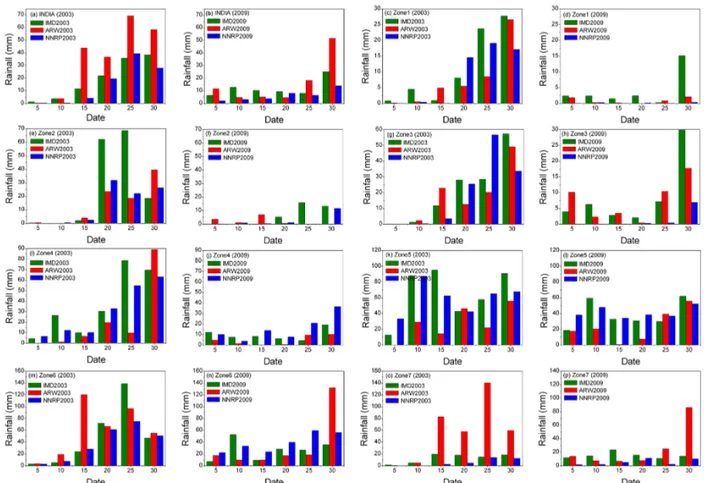
Figure 8.Variation of the 5-day mean precipitation (mm day−1) for 2003 and 2009 from model, NNRP reanalysis and IMD gridded rainfall data calculated over the Indian land region (8–26◦N, 66–86◦E) and over different rainfall zones. The panels(a, b),(c, d), . . .(o, p) corre-spond to India, zone 1, . . . zone 7 respectively for the years 2003 and 2009.
Figure 9.Rainfall in June over India and over each rainfall zone (Z1, Z2 . . . Z7) from model, NNRP reanalysis and IMD gridded rainfall for(a)2003 and(b)2009.
the model simulated the intensity of the Somali Jet, agree-ing with observations in both the years. The time variation indicates the Somali Jet gaining strength continuously from 5 (5 m s−1) to 30 June (14 m s−1) in both 2003 and 2009. The monsoon onset-phase characteristics over northern In-dia (i.e., at latitudes > 30◦N over the Himalayas and the Ti-betan Plateau) are related to progressive surface heating. The eastern part of the Tibetan Plateau (i.e., east of 85◦E)
gen-Figure 10.Variation of 5-day mean wind speed (m s−1) during the years(a)2003 and(b)2009 from simulation and NCEP FNL anal-ysis calculated over the region 2–16◦N, 52–64◦E.
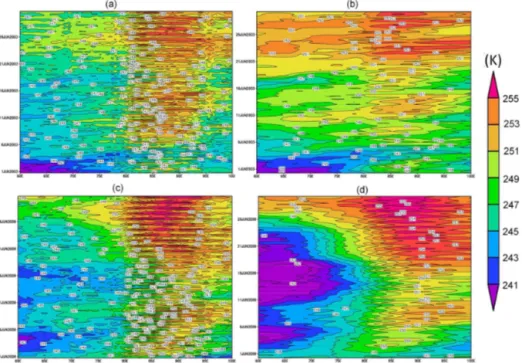
Figure 11.Time–longitude cross section at 30◦N of the 500–200 hPa layer temperature (in◦K) for the years 2003(a, b)and 2009(c, d). The left panels(a, c)represent ARW simulation and the right panels(b, d)FNL analysis.
Figure 12.Outgoing long-wave radiation (OLR) in watts m−2from simulation and NNRP data for the years 2003(a, b)and 2009(c, d). The left panels(a, c)represent ARW simulation and the right panels(b, d)NNRP reanalysis.
corresponding data from FNL fields are shown in Fig. 11. Both the model simulation and FNL analysis depict a well defined meridional thermal contrast and a stronger heating of the atmosphere in the northern latitudes (at 30◦N) with the
layer attains a local maximum heating by 12 June in 2003 and 21 June in 2009. These simulated features are found to agree well with analysis, except that the maximum heating is underestimated by 3◦C in the simulation. The outgoing long-wave radiation (OLR) can be taken as a proxy parameter for convection to identify the cloud conditions over the tropical region (from deep convective clouds to a cloud-free zone us-ing a proper threshold). The OLR derived from simulation and NNRP reanalysis data is presented in Fig. 12 for June. The model OLR pattern is in good agreement with the reanal-ysis data, although slight differences are noted in the magni-tude over northwest, southwest and southeastern parts of the domain. Relative to 2009, lower OLR in the eastern, south-eastern and northern parts, and a higher OLR in northwest India and adjoining western parts are found in 2003, both in simulation and analysis. The lower OLR in most parts of the country in 2003 indicates a deeper convection and higher rainfall in 2003 relative to 2009. It is noted that the OLR is underestimated (by about 25 watts m−2)by the model in the northwestern parts during both the years. A maximum differ-ence of 10 to 40 watts m−2 is simulated over India between 2003 and 2009. The simulated OLR in 2003 is higher than that in 2009 in parts of northern India, northwestern India, Pakistan and Afghanistan, representing reduction of the heat low and hence a reduction in deep convection and rainfall in these regions. Similarly the simulated OLR is lower in 2003 than 2009 over the northern, eastern and southeastern parts of the country and parts of Bay of Bengal as in reanalysis data, indicating enhancement of moist convection processes and increased rainfall in 2003 in these regions. The simu-lation shows slightly lower OLR in the northwest zone as compared to the analysis in both the years. The OLR pat-terns from simulations as well as reanalysis data indicate the maximum OLR differences between 2003 and 2009 are con-centrated over Pakistan and adjoining regions, indicating a reduction of rainfall in this belt in 2003.
4 Summary and conclusions
In this work, the ARW regional model with 30 km resolu-tion is used to make onset-phase rainfall simularesolu-tions for the decade 2000–2009. A seasonal- scale (May–July) integra-tion starting on 1 May for each year is performed using the NCEP 2.5◦reanalysis fields for initial/boundary conditions. The model-simulated pentad rainfall during the onset phase, between 16 May and 15 July over seven representative homo-geneous rainfall zones, is compared with the corresponding data from IMD 25 km gridded rainfall as well as the NNRP precipitation. The correlations and error metrics for the time series of running pentad rainfall from different rainfall zones show that the progression of rainfall during the onset phase of the monsoon could be simulated reasonably well in quantity and distribution. The model could simulate the onset-phase rainfall in most zones except the humid/perhumid high rain-fall zone in the northeast. In other zones the timing of onset
simulations be made with the incorporation of SST data and with the adoption of a higher resolution to reduce the un-certainty in the simulations over the southeast and northwest zones, and to address the slight dry bias in onset-phase rain-fall.
Acknowledgements. The authors thank P. R. Vasudeava Rao, Di-rector of IGCAR, and S. A. V. Sathya Murty, DiDi-rector of EIRSG, for their encouragement and support. The NCEP Reanalysis data are provided by the NOAA/OAR/ESRL PSD, Boulder, CO, USA, from their website at http://www.esrl.noaa.gov/psd/. The authors ac-knowledge the NCEP and NCAR, USA, for facilitating the public access of NNRP and FNL analysis data. Authors acknowledge the India Meteorological Department for providing the gridded rainfall observations used in the study. The authors thank the anonymous reviewers for the technical comments which significantly improved the quality of the manuscript.
The topical editor C. Jacobi thanks one anonymous referee for help in evaluating this paper.
References
Ananthakrishnan, R. and Soman, M. K.: The onset of the south-west monsoon over Kerala: 1901–1980, J. Climatol., 8, 283–296, 1988.
Ananthakrishnan, R. and Soman, M. K.: Onset dates of the south-west monsoon over Kerala for the period, 1870–1900, Int J. Cli-matol., 9, 321–322, 1989.
Ananthakrishnan, R., Acharya, U. R., and Krishnan, A. R. R.: On the Criteria for Declaring the Onset of the Southwest Monsoon over Kerala (forecasting manual, FMU Rep. No. IV-18.1), India Meteorological Department, Pune, India, 52 pp., 1967.
Betts, A. K. and Miller, M. J.: A new convective adjustment scheme, Part II: single column tests using GATE wave, BOMEX, and arc-tic air-mass data sets, Q. J. Roy. Meteor. Soc., 112, 693–709, 1986.
Bhaskaran, B., Jones, R. G., Murphy, J. M., and Noguer, M.: Simu-lations of the Indian summer monsoon using a nested regional climate model: Domain size experiments, Clim. Dynam., 12, 573–578, 1996.
Bhaskar Rao, D., Srinivas, D., and Bishoyi Ratna, S.: Regional scale prediction of the onset phase of the Indian southwest monsoon with a high-resolution atmospheric model, Atmos. Sci. Lett., 9, 237–244, 2008.
Bollasina, M., Bertolani, L., and Tartari, G.: Simulations of the 2001 Indian Summer Monsoon Onset with a General Circu-lation Model, in: Integrated Assessment and Decision Sup-port, edited by: Rizzoli, A. E. and Jakeman, A. J., Proceed-ings of the 1st Biennial Meeting of the iEMSs, Vol. 2, 343– 348, available at: http://www.iemss.org/iemss2002/proceedings/ pdf/volumedue/173_bollasina.pdf (last access: 20 August 2013), 2002.
Chakraborty, A., Nanjundiah, R. S., and Srinivasan, J.: Theoreti-cal aspects of the onset of Indian summer monsoon from per-turbed orography simulations in a GCM, Ann. Geophys., 24, 2075–2089, doi:10.5194/angeo-24-2075-2006, 2006.
Chen, F. and Dudhia, J.: Coupling an advanced land surface-hydrology model with the Penn State-NCAR MM5 modeling system. Part I: model implementation and sensitivity, Mon. Weather Rev., 129, 569–585, 2001.
Das, P. K.: Summer monsoonal rainfall simulation on the Tibetan Plateau with a regional climate model using a one-way double-nesting system, in: The Monsoons, National Book Trust, India. A-5 Green Park, New Delhi 110016., edited by: Cui, X, Lang-mann, B, Graf, H.-F., 2007, Scientific Online: Letters on the At-mosphere, 3, 49–52, 1968.
Dudhia, J.: Numerical study of convection observed during the Win-ter Monsoon Experiment using a mesoscale two-dimensional model, J. Atmos. Sci., 46, 3077–3107, 1989.
Fasullo, J. and Webster P. J.: A hydrological definition of In-dian monsoon onset and withdrawal, J. Climate, 16, 3200–3211, 2003.
Flatau, M., Flatau, P., Schmidt, J., and Kiladis, G.: Delayed on-set of the 2002 Indian monsoon, Geophys. Res. Lett., 30, 1768, doi:10.1029/2003GL017434, 2003.
Gadgil, G. and Sajini, S.: Monsoon precipitation in the AMIP runs, Clim. Dynam., 14, 659–689, 1998.
Gadgil, S., Rajeevan, M., and Nanjundiah, R.: Monsoon predic-tion – Why yet another failure?, Curr. Sci. India, 88, 1389–1400, 2005.
Gao, X., Zhang, D., Chen, Z., Pal, J., and Giorgi, F.: Land use effects on climate in China as simulated by a regional climate model, Sci. China Ser. D, 50, 620–628, 2007.
Giorgi, F., Bi, X., and Pal, J.: Mean, interannual variability and trends in a regional climate experiment over Europe II: fugure climate (2070–2100). Clim Dyn 23 (7): 839-858, 2004
Goswami B. B., Mukhopadhyay, P., Mahanta, R., and Goswami, B. N.: Multiscale interaction with topography and extreme rain-fall events in the northeast Indian region, J. Geophys. Res., 115, D12114. doi:10.1029/2009JD012275, 2010.
Goswami, B. N.: South Asian Monsoon, in: Intraseasonal Vari-ability in the Atmosphere-Ocean Climate System, edited by: Lau, W. K.-M. and Waliser, D. E., XXXIII, 613 pp., available at: http://www.springer.com/978-3-642-13913-0 (last access: 12 November 2013), 2012.
Hari Prasad, D., Venkata Srinivas, C., Venkata Bhaskar Rao, D., and Anjaneyulu, Y.: Simulation of Indian monsoon extreme rainfall events during the decadal period 2000–2009 using a high reso-lution mesoscale model, Advances in Geosciences, 22, 31–48, 2011.
Hastenrath, S.: Clim. Dynam. of the Tropics: An Updated Edition of Climate and Circulation of the Tropics, Kluwer Academic Pub-lishers, Norwell, MA, USA, 488, 1994.
Hong, S.-Y., Dudhia, J., and Chen, S.-H.: A Revised Approach to Ice Microphysical Processes for the Bulk Parameterization of Clouds and Precipitation, Mon. Weather Rev., 132, 103–120, 2004.
Hong, S.-Y., Noh, Y., and Dudhia, J.: A new vertical diffusion package with explicit treatment of entrainment processes, Mon. Weather Rev., 134, 2318–2341, 2006.
India Meteorological Department (IMD): Weather in India-Monsoon season (June to September 2003), Mausam, 55, 515– 548, 2004.
Monograph No: Synoptic Meteorology No. 09/2010, National Climate Centre, India Meteorological Department, Pune-411005, India, 2010.
Janjic, Z. I.: Comments on “Development and Evalu-ation of a Convection Scheme for Use in Climate Models”, J. Atmos. Sci., 57, 3686, doi:10.1175/1520-0469(2000)057<3686:CODAEO>2.0.CO;2, 2000.
Joseph, P., Eischeid, J., and Pyle, R.: Interannual variability of the onset of the Indian summer monsoon and its association with at-mospheric features, El Niño and sea surface temperature anoma-lies. J. Climate, 7, 81–105, 1994.
Joseph, P. V., Sooraj, K. P., and Rajan, C. K.: The Summer Monsoon onset over Process over South Asia and an Objective method for the Date of Monsoon Onset over Kerala, Int. J. Climatol., 26, 1871–1893, 2006.
Joseph, P. V.: Onset, advance and withdrawal of monsoon, in: Mon-soon Monograph (Volume I), edited by: Tyagi, A., Asnani, G. C., De, U. S., Hatwar, H. R., and Mazumdar, A. B., India Meteoro-logical Department, New Dehli, India, 2012.
Kalnay, E., Kanamitsu, M., Kistler, R., Collins, W., Deaven, D., Gandin, L., Iredell, M., Saha, S., White, G., Woollen, J., Zhu, Y., Chelliah, M., Ebisuzaki, W., Higgins, W., Janowiak, J., Mo, K. C., Ropelewski, C., Wang, J., Leetmaa, A., Reynolds, R., Jenne, R., and Joseph, D.: The NMC/NCAR 40-year reanalysis project. B. Am. Meteorol. Soc., 77, 437–471, 1996.
Kang, I. S., Jin, K., Wang, B., Lau, K. M., Shukla, J., Krishna-murthy, V., Schubert, S. D., Wailser, D. E., Stern, W. F., Kitoh, A., Meehl, G. A., Kanamitsu, M., Galin, V. Y., Satyan, V., Park, C. K., and Liu, Y.: Intercomparison of the climatological varia-tions of Asian Summer Monsoon precipitation simulated by 10 GCMS, Clim. Dynam., 19, 383–395, 2002.
Kelkar, R. R.: Monsoon Prediction, BS Publications, Hyderabad, A. P., India, 234 pp., 2009.
Kripalani, R. H., Kulkarni, A., Sabade, S. S., Revadekar, J. V., Pat-wardhan, S. K., and Kulkarni, J. R.: Intra-seasonal oscillations during monsoon 2002 and 2003, Current Sci. India, 87, 325–331, 2004.
Krishna Kumar, K., Hoerling, M., and Rajagopalan, B.: Advancing dynamical prediction of Indian monsoon rainfall, Geophys. Res. Lett. 32, L08704, doi:10.1029/2004GL021979,4, 2005. Krishnamurti, T. N.: Summer monsoon experiment: A review.,
Mon. Weather Rev., 113, 1590–1626, 1985.
Krishnamurti, T. N., Kishtawal, C. M., LaRow, T. E., Bachiochi, D. R., Zhang, Z., Williford, C. E., Gadgil, S., and Surendran, S.: Multimodel ensemble forecasts for weather and seasonal climate, J. Climate, 13, 4196–4216, 2000.
Mandal, C., Mandal, D. K., Srinivas, C. V., Sehgal, J., and Ve-layutham, M.: Soil-Climatic Database for Crop Planning in In-dia, NBSS Publ., 53, 1014 pp. NBSS & LUP, Indian Council of Agricultural Research, Nagpur, India, 1999.
Mlawer, E. J., Taubman, S. J., Brown, P. D., Iacono, M. J., and Clough, S. A.: Radiative transfer for inhomogeneous atmo-sphere: RRTM, a validated correlated-k model for the longwave, J. Geophys. Res., 102, 16663–16682, 1997.
Mukhopadhyay, P., Taraphdar, S., Goswami, B. N., and Krishnaku-mar, K.: Indian summer monsoon precipitation climatology in a high-regional climate model: impacts of convective parame-terization on systematic biases, Weather Forecast., 25, 369–387, 2010.
Murphy, A. H. and Winkler, R. L.: A general framework for forecast verification, Mon. Weather Rev., 115, 1330–1338, 1987. National Centers for Environmental Prediction (NCEP): NCEP
FNL Operational Model Global Tropospheric Analyses, contin-uing from July 1999, doi:10.5065/D6M043C6, Research Data Archive at the National Center for Atmospheric Research, Com-putational and Information Systems Laboratory, Boulder, CO, USA, available at: http://rda.ucar.edu/datasets/ds083.2/ (last ac-cess: 15 May 2012), 2000.
Noh, Y., Chen, W. G., Hong, S.-Y., and Raasch S.: Improvement of the K-pro?le model for the planetary boundary layer based on large eddy simulation data, Boundary Layer Meteorology, 107, 401–427, 2003.
Pai, D. S. and Nair, R. M.: Summer monsoon onset over Kerala: New definition and prediction, J. Earth Syst. Sci., 118, 123–135, 2009.
Pai, D. S., Sridhar, L., Rajeevan, M., Sreejith, O. P., Satbhai, N. S., and Mukhopadhyay, B.: Development and Analysis of A New High Spatial Resolution (0.25◦×0.25◦) Long Period (1901– 2010) Daily Gridded Rainfall Data Set Over India. National Cli-mate Centre Research Report No. 1/2013, India Meteorological Department, Pune, India, 2013.
Pearce, R. P. and Mohanty, U. C.: Onsets of the Asian summer mon-soon, 1979–1982, J. Atmos. Sci., 41, 1620–1639, 1984. Preethi, B., Revadekar, J. V., and Kripalani, R. H.: Anomalous
be-havior of the Indian summer monsoon 2009, J. Earth Syst. Sci., 120, 783–784, 2011.
Puranik, S. S., Sinha Ray, K. C., Sen, P. N., and Pradeep Kumar, P.: An index for predicting the onset of monsoon over Kerala, Curr. Sci. India, 105, 954–961, 2013.
Raju, A., Anant, P., and Gnanaseelan, C.: Evolution of Verti-cal Moist Thermodynamic Structure Associated with the In-dian Summer Monsoon 2010 in a Regional Climate Model, Pure Appl. Geophys., 171, 1499–1518, doi:10.1007/s00024-013-0697-3, 2013.
Raju, A., Parekh, A., Chowdary, J. S., and Gnanaseelan, C.: Assessment of the Indian summer monsoon in the WRF regional climate model, Clim. Dynam., 44, 3077–3100, doi:10.1007/s00382-014-2295-1, 2014.
Rao Y. P.: Southwest Monsoon: Meteorological Monograph (Syn-optic Meteorology), India Meteorological Department, Pune, In-dia, No. 1/1976, 367, 1976.
Seth, A., Rauscher, S. A., Carmago, S. J., Qian, J. H., and Pal, J.: RegCM3 regional climatologies for South America using reanal-ysis and ECHAM global model driving fields, Clim. Dynam., 28, 461–480, 2006.
Skamarock, W. C., Klemp, J. B., Dudhia, J., Gill, D. O., Barker, D. M., Duda, M. G., Huang X.-Y., Wang, W., and Powers, J. G.: A Description of the Advanced Research WRF Version 3. NCAR Technical Note, NCAR/TN-475+STR. Mesoscale and Microscale Meteorology Division, National Center for Atmo-spheric Research, Boulder, CO, USA, 2008.
Soman, M. K. and Kumar, K. K.: Space-time evolution of mete-orological features associated with the onset of Indian summer monsoon, Mon. Weather Rev., 121, 1177–1194, 1993.
model, Int. J. Climatol, 33, 1195–1210, doi:10.1002/joc.3505, 2012.
Srinivas, C. V., Bhaskar Rao, D. V., Hari Prasad, D., Hari Prasad, K. B. R. R., Baskaran, R., and Venkatraman, B.: A study on the influence of the Land Surface Processes on the Southwest Mon-soon simulations using a Regional Climate model, Pure. Appl. Geophys., doi:10.1007/s00024-014-0905-9, 2014.
Sylla, M. B., Coppola, E., Mariotti, L., Giorgi, F., Ruti, P. M., Dell’Auila, A., and Bi, X.: Multiyear simulation of the African climate using a regional climate model (RegCM3) with the high resolution ERA-interim reanalysis, Clim. Dynam., 35, 231–247, 2010.
Thornthwaite, C. W. and Mather, R. J.: The water balance publica-tion in climatology 8(10), DIT, Laboratory of climatology, Cen-terton, NJ, USA, 104 pp., 1955.
Tyagi, A., Mazumdar, B., Khole, M., Gaonkar, S. B., and Sunitha, D.: Re-determination of normal dates of onset of southwest mon-soon over India. Mausam, 62, 321–328, 2011.
Wang, B., Ding Q., Fu, X., Kang, I., Jin, K., Shukla, J., and Doblas-Reyes, F.: Fundamental challenge in simulation and prediction of summer monsoon rainfall, Geophys. Res. Lett. 32, L15711, doi:10.1029/2005GL022734, 2005.
Wang, B., Ding, Q., and Joseph, P. V.: Objective definition of the Indian summer monsoon onset, J. Climate, 22, 3303–3316, doi:10.1175/2008JCLI2675.1, 2009.
Webster, P. J., Palmer, T., Yanai, M., Tomas, R., Magana, V., Shukla, J., and Yasunari, A.: Monsoons: Processes, predictability and the prospectus for prediction, J. Geophys. Res., 103, 14451–14510, 1998.
World Climate Research Programme (WCRP): Simulation of in-terannual and intraseasonal monsoon variability. Rep Work-shop, National Center for Atmospheric Research, Boulder, CO, USA, 21–24 October 1991, WMO/TD- No. 470, WMO, Geneva, Switzerland, 1992.