The neuromuscular transmission of the
SOD1(G93A) mouse model of
Amyotrophic Lateral Sclerosis
Mariana Cúcio Rocha
Master in Neurosciences Lisbon 2012
The neuromuscular transmission of the
SOD1(G93A) mouse model of
Amyotrophic Lateral Sclerosis
Mariana Cúcio Rocha
Supervised by: Joaquim A. Ribeiro, MD, PhD
Paula Pousinha, PhD
Master in Neurosciences Lisbon 2012
The printing of this thesis was approved by the Coordinating Committee of the Scientific Board of the Faculty of Medicine, University of Lisbon, on the October 23rd 2012, meeting.
A impressão desta dissertação foi aprovada pela Comissão Coordenadora do Conselho Científico da Faculdade de Medicina da Universidade de Lisboa em reunião de 23 de Outubro de 2012.
O trabalho experimental apresentado nesta tese foi realizado no Instituto de Farmacologia e Neurociências, Faculdade de Medicina e Unidade de Neurociências, Instituto de Medicina Molecular, sob orientação do Professor Doutor Joaquim Alexandre Ribeiro e Doutora Paula Pousinha.
The experimental work described in this thesis was performed at the Institute of Pharmacology and Neuroscience, Faculty of Medicine and Unit of Neurosciences, Institute of Molecular Medicine, under supervision of Professor Joaquim Alexandre Ribeiro and Professor Paula Pousinha.
Table of contents
Abbreviation list ……… ix
Resumo ……….………. xi
Abstract………. xiii
1 Introduction... 1
1.1 Amyotrophic Lateral Sclerosis: the disease ... 1
1.1.1 Disease definition and primary features ... 1
1.1.2 Cellular and molecular mechanism underlying ALS ... 2
1.1.3 The dying-back and dying-forward hypothesis ... 4
1.2 The neuromuscular junction ... 5
1.2.1 Structure of the neuromuscular junction ... 5
1.2.2 Neuromuscular transmission ... 7
1.3 ALS and the neuromuscular junction ... 9
1.3.1 Molecular changes... 9
1.3.2 Functional changes ...10
2 Goals ...13
3 Materials and methods ...15
3.1 Animals ...15
3.1.1 Animal model ...15
3.1.2 Animal strains, breeding and husbandry ...17
3.2 Genotyping ...17
3.3 Behavioural phenotyping ...19
3.3.1 Body weight...19
3.3.2 Rotarod test ...19
3.4.1 The neuromuscular junction model ...20
3.4.2 Diaphragm phrenic-nerve preparation ...21
3.4.3 Muscle contraction blockade ...22
3.4.4 Intracellular recordings ...22 3.5 Statistical analysis ...24 4 Results ...25 4.1 Behavioral phenotyping ...25 4.1.1 Pre-symptomatic phase ...25 4.1.2 Symptomatic phase ...25 4.2 Neuromuscular transmission ...26 4.2.1 Pre-symptomatic phase ...26 4.2.2 Symptomatic phase ...30
4.2.3 Comparison between phases ...34
5 Discussion ...37
6 Conclusions...41
7 Acknowledgments ...42
Abbreviation list
ACh Acetylcholine
AChE Acetylcholinesterase
AChR Acetylcholine receptor
ALS Amyotrophic Lateral Sclerosis
ATP Adenosine 5´-triphosphate
ChAT Choline acethyltransferase
EPP Endplate potential
GMEPP Giant miniature endplate potential
IgGs Immunoglobulins G
IP3 Inositol 1,4,5-triphosphate
LF Latency-to-fall
MEPP Miniature endplate potential
NMJ Neuromuscular junction
QC Quantal content
Rpm Rotations-per-minute
SEM Standard error mean
Resumo
A Esclerose Lateral Amiotrófica (ELA), uma das doenças do neurónio motor mais comum, caracteriza-se pela perda caracteriza-selectiva de neurónios motores do tracto corticoespinhal. Vários estudos sugerem que a degeneração inicia-se na porção distal do axónio com uma progressão retrógrada. Assim, o presente trabalho teve como objectivo avaliar a transmissão sináptica na junção neuromuscular dos animais SOD1(G93A), nos períodos correspondentes às fases pré-sintomática e sintomática da ELA.
As experiências foram efectuadas em ratinhos transgénicos SOD1(G93A) e não transgénicos (WT), na fase pré-sintomática (4 a 6 semanas de idade) e fase sintomática (12 a 16 semanas de idade). Após o nascimento, os animais foram genotipados por polymerase chain reaction (PCR). Nas respectivas fases da doença, os animais foram testados no rotarod, e em seguida fizeram-se registos electrofisiologicos: potenciais de placa evocados (EPPs), potenciais de placa miniatura (MEPPs) e MEPPs gigantes (GMEPPs: MEPPs > 1mV). Os registos foram feitos em fibras musculares do diafragma inervado, paralisadas com μ-conotoxina GIIIB. O conteúdo quântico dos EPPs foi calculado através da razão entre a amplitude média dos EPPs e a amplitude média dos MEPPs.
Na fase pré-sintomática da doença, os ratos SOD1(G93A) não exibiram alterações na função motora a 10 rpm. Relativamente à transmissão neuromuscular, estes animais apresentaram um aumento significativo da amplitude média dos EPPs e do conteúdo quântico dos EPPs, quando comparados com os animais WT, sugerindo uma maior eficiência da transmissão neuromuscular nos animais SOD1(G93A). Para além disso, o aumento significativo da frequência de GMEPPs, o que pela literatura parece estar associado a uma desregulação dos níveis intracelulares de Ca2+, e as alterações na amplitude e cinética dos MEPPs sugerem a existência de alterações ao nível da junção neuromuscular numa fase pré-sintomatica. Na fase sintomática, os animais SOD1(G93A) apresentaram um défice motor aos 10 rpm. Os registos electrofisiológicos revelaram a existência de dois grupos de junções neuromusculares nos ratos SOD1(G93A): SOD1a e SOD1b. O grupo SOD1a apresentou EPPs e MEPPs com amplitudes significativamente reduzidas bem como um rise-time dos MEPPs aumentado, quando comparado com os grupos SOD1b e WT, sugerindo um enfraquecimento da transmissão neuromuscular, nesse grupo. Pelo contrário, o grupo SOD1b apresentou uma transmissão neuromuscular semelhante tanto à dos animais SOD1(G93A) pré-sintomáticos, como também à dos WT com 12-14 semanas.
Em conclusão, este trabalho mostra que a transmissão neuromuscular dos animais SOD1(G93A) encontra-se aumentada na fase pré-sintomática. Na fase sintomática, a presença de uma população mista de junções neuromusculares é consistente com os ciclos de desinervação/ re-inervação, já descritos
noutros estudos. As alterações iniciais na transmissão neuromuscular dos animais SOD1(G93A) representam assim mais uma evidência que os mecanismos patológicos da ELA iniciam-se antes do aparecimento dos primeiros sintomas.
Abstract
Amyotrophic Lateral Sclerosis (ALS) is the most frequent adult-onset motor neuron disease and is characterized by a selective and progressive loss of motor neurons in the corticospinal tract. Growing evidence suggest that degeneration may begin at the distal axon proceeding in a dying-back pattern, increasing the need to focus on neuromuscular junction parameters. It seemed therefore of interest to investigate synaptic transmission at the neuromuscular junction (NMJ) in both pre- and symptomatic phases of the disease.
Experiments were performed in SOD1(G93A) mice and in non-transgenic littermates (WT) with 4-6 and 12-14 weeks-old, corresponding respectively to pre- and symptomatic phases. After birth, mice were genotyped through polymerase chain reaction (PCR). At the respective age, mice were submitted rotarod, then low-frequency (0.5 Hz) evoked endplate potentials (EPPs), miniature endplate potentials (MEPPs) and giant MEPPs (GMEPPs: MEPPs >1mV) were recorded from innervated diaphragm muscle fibers, paralyzed with μ-conotoxin GIIIB. The quantal content of EPPs was estimated as the ratio between EPPs amplitude and MEPPs amplitude.
In the pre-symptomatic phase, SOD1(G93A) mice did not present motor deficits on the rotarod at 10rpm. However, SOD1(G93A) mice exhibited a significant increase of the mean amplitude of EPPs together with an increase in the mean quantal content of EPPs, suggesting that more acetylcholine is being released into the synaptic cleft. Also, SOD1(G93A) mice presented a higher frequency of GMEPPs, suggestive of intracellular Ca2+ deregulation in nerve terminals. The observed increase in the mean amplitude of MEPPs and the decreased mean rise-time of MEPPs in SOD1(G93A) mice point as well to post-synaptic related changes. In symptomatic phase, SOD1(G93A) mice presented a lower motor balance and coordination. Electrophysiological data showed evidence for two NMJ groups in SOD1(G93A) mice: SOD1a and SOD1b. The SOD1a group presented both mean amplitude of EPPs and of MEPPs reduced. The mean rise-time of MEPPs was increased, when compared to WT and to SOD1b group, indicating an impairment in the neuromuscular transmission. In contrast, the neuromuscular transmission of SOD1b group was not different from age-matched WT or from the pre-symptomatic SOD1(G93A) mice.
Altogether these results clearly show that the neuromuscular transmission of SOD1(G93A) mice is enhanced in the pre-symptomatic phase. In the symptomatic phase our results are consistent with the hypothesis that the diaphragm of SOD1(G93A) mice are undergoing cycles of denervation/re-innervation supported by the mixed population of neuromuscular junctions. These early changes in the neuromuscular
transmission of SOD1(G93A) mice is a novel proof that the ALS associated events starts long before the symptoms appear.
1
Introduction
1.1 Amyotrophic Lateral Sclerosis: the disease
1.1.1 Disease definition and primary features
Amyotrophic Lateral Sclerosis (ALS), also known as Charcot´s Sclerosis or Lou Gehrig´s disease, is the most common adult-onset motor neuron disease and the most frequent neurodegenerative disorder after Alzheimer and Parkinson diseases. Although its incidence is similar to that of multiple sclerosis (2-3 per 100,000 each year), its low prevalence of just 4-6 per 100,000 each year, owing to the poor prognosis, understates the impact of ALS (see Boillee et al., 2006 and Dion et al., 2009).
The primary disease hallmark is a selective and progressive degeneration of motor neurons in the corticospinal tracts. The consequent loss of upper motor neurons, which are found in the motor cortex, triggers spasticity and hyper-reflexia while that of lower motor neurons, present in the brainstem and spinal cord, leads to widespread muscle weakness, atrophy and paralysis. This disorder is diagnosed in midlife (usually between age 45 and 60) and patients die once denervation reaches the respiratory muscles and diaphragm, that is 1 to 5 years after symptoms onset (see Gonzalez de Aguilar et al., 2007).
Most cases (90%) do not present a hereditary pattern and are hence classified as sporadic ALS. Increasing evidence suggest the involvement of genetic factors, with susceptibility genes increasing the overall risk for neurodegeneration, as well of epigenetics. The remaining 10% are termed familial ALS and the disease is frequently inherited in an autosomal dominant manner. Over the past two decades, 13 genes and loci have been reported to predispose to ALS. However, both forms produce similar pathological and clinical hallmarks suggesting a common pathogenesis (see Boillee et al., 2006; Kiernan et al., 2011).
Despite many advances in investigative medicine over the past decades, there is no diagnostic test for ALS. Clinicians have to identify a combination of diagnostic features and classify patients into categories according to the level of diagnostic certainly, which is a method of detection with very poor sensitivity particularly in the early stages of the disease. Regarding the management of ALS, there is no prophylactic or curative treatment for ALS. The 2-amino-6-trifluoromethoxy-benzothiazole (Riluzole) (Mizoule et al., 1985) is the only approved disease-modifying agent that has been shown to prolong survival of ALS patients by a few months (Bensimon et al., 1994; Miller et al., 2003). Riluzole exerts its neuroprotective effects by blocking both voltage-gated sodium channels (Na+) and N-methyl-D-aspartate (NMDA) receptors thereby preventing excessive calcium influx into neurons (Hubert et al., 1994; Malgouris et al., 1994).
1.1.2 Cellular and molecular mechanism underlying ALS
Cu/Zn superoxide dismutase mutation
First insights into the cellular and molecular basis of ALS began with the identification of mutations in the copper/zinc superoxide dismutase gene (Cu/Zn, SOD1) (Rosen et al., 1993), accountable for approximately 20% of familial cases and 5% of apparently sporadic ALS (see Kiernan et al., 2011). Wild-type SOD1 is an abundant homodimeric and cytosolic enzyme ubiquitously expressed. This polypeptide comprises 153 amino-acid and is responsible for the conversion of superoxide radicals, a by-product of mitochondrial respiration, into molecular oxygen and hydrogen peroxide, as follows;
2O2- + 2H+ H2O2 + O2
Copper atom, which binds one of the monomers, plays the active role in the removal of superoxide whereas zinc atom, bound to the other monomer, confers structural stability to the enzyme. This two-step process prevents the generation of reactive oxygen species (ROS), and hence, reduces oxidative stress in cells (see Cozzolino et al., 2008; Dion et al., 2009).
Currently, more than 130 different SOD1 mutations have been reported to cause ALS. These mutations are distributed throughout all five exons of the gene and most of them are point mutations affecting either the active site or the structure (see Cozzolino et al., 2008; Dion et al., 2009). Since SOD1-knockout mice do not present neurodegeneration (Reaume et al., 1996) and many SOD1 variants show normal (Gurney et al., 1994; Wong et al., 1995) or no enzymatic activity (Ripps et al., 1995; Bruijn et al., 1997), those mutations are responsible for imparting an additional toxic function rather than inducing a reduction or loss of superoxide scavenging activity (see Dion et al., 2009).
Model for the evolution
ALS is considered a multifactorial disease, as it results from a complex interplay between multiple pathological mechanisms. Also, it is considered a multisystemic disease (Pramatarova et al., 2001; Gong et al., 2000), where damage within motor neurons is determinant for disease initiation whereas damage within non-neuronal cells drives disease progression and spread (Clement et al., 2003; Boillee et al., 2006).
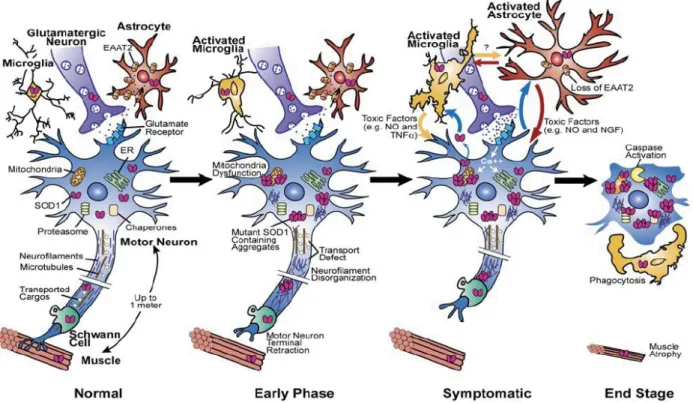
Most of the current knowledge about cellular and molecular events taking place during disease progression (figure 1.1) has come from studies with multiple animal models. During the early phase of the disease, where there are no clinical signs, mutant SOD1 primarily acts within motor neurons causing the early retraction of motor axons from their synapses at the neuromuscular junction (Frey et al., 2000; Fischer et al., 2004; Pun et al., 2006). The mutant protein is also known to disrupt several cellular
machineries such as mitochondria (Dal Canto and Gurney 1994; Wong et al., 1995; Kong and Xu 1998), axonal transport (Wong et al., 1995; Zhang et al., 1997; Williamson and Cleveland 1999), endoplasmatic reticulum (Atkin et al., 2006) and proteasome (Urushitani et al., 2002; Kabashi et al., 2004).
During the symptomatic phase, there is a massive activation of microglia (Hall et al., 1998) and astrocytes (Schiffer et al., 1996; Hall et al., 1998) besides the continuing damage within motor neurons. Mutant SOD1 acts within these non-neuronal neighbors triggering a reduction in the levels of the glutamate transporter (EAAT2) (Bruijn et al., 1997, Howland et al., 2002), thereby promoting excitotoxicity in motor neurons, as well as a reduced secretion of trophic factors and/or release of toxic factors (Elliott 2001; Hensley et al., 2003). The build-up of damage within motor neurons, due to both intrinsic and extrinsic factors, ultimately triggers the activation of a caspase-depedent cell suicide program (Raoul et al., 2002; Wengenack et al., 2004). Consequently, denervation leads to the widespread muscle weakness and later to the progressive paralysis.
Figure 1.1 Model for the progression of ALS (from Boillee et al., 2006)
The early phase of the disease starts with the retraction of motor axons from their synapses. Aggregates containing missfolded SOD1 damage mitochondria, reducing ATP production and increasing free Ca2+ release, the endoplasmatic reticulum and the proteasome. Also, the disorganization of neurofilaments and/or mitochondrial defects lead to disruption of axonal transport. During symptomatic phase, mutant SOD1 triggers the inactivation of the glutamate transporter (EAAT2) in astrocytes, leading to an excessive influx of Ca2+ into lower motor neurons. In addition, activated microglia and astrocytes by reduced secretion of trophic factors or/and release of toxic factors into the cellular environment, amplify the initial damage and drive the progression of the disease. The end stage is characterized by paralysis and muscle atrophy with caspase-depedent cell death.
1.1.3 The dying-back and dying-forward hypothesis
At present, there is controversy whether disease starts distally, centrally or independently in upper motor neurons and lower motor neurons. The dying-forward hypothesis proposes that disease begins primarily in motor cortex, with upper motor neurons mediating in a latter phase the anterograde degeneration of lower motor neurons (by glutamate-induced excitotoxicity). The dying-back hypothesis, on the other hand, stands up for an initiation at the motor endplate, with a retrograde degeneration (see Kiernan et al., 2011).
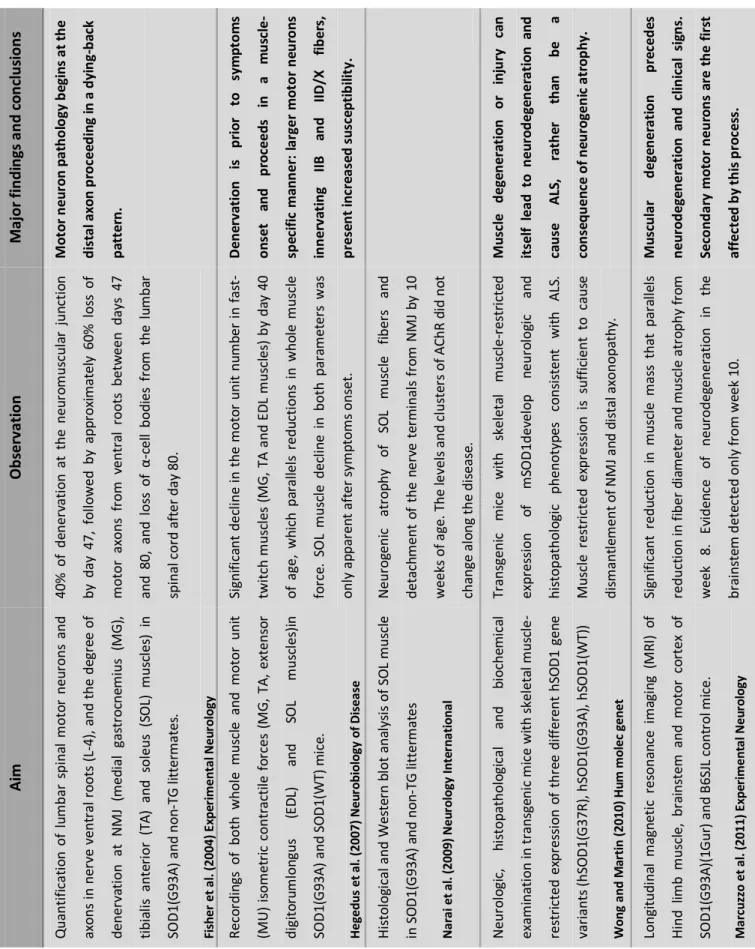
Evidence for dying-back hypothesis
In the past decades, several studies that explored the spatio-temporal changes in motor neuron pathology in ALS (summarized in table 1.I) have been pointing to a retrograde degeneration. Both Frey and collaborators (2000) and Fisher and collaborators (2004) were the first groups to detect an early detachment of motor axons from their synapses at the neuromuscular junction in pre-symptomatic SOD1(G93A) mice, stating a dying-back axonopathy. Indeed, endplates denervation and motor axons loss were detected before soma degeneration and symptoms onset (Fischer et al., 2004), and fast-fatigable neuromuscular junctions presented a higher vulnerability to degeneration than slow-type synapses, thereby being lost early on (Frey et al., 2000).
The assessment of functional motor units loss in SOD1(G93A) mice by Hegedus and colleagues (2007; 2008) reinforced the dying-back hypothesis. These authors found a decline in motor unit numbers in fast-twitch muscles from day 40 and a concomitant decline in whole muscle contractile force. Later, they reported a preferential vulnerability of large motor units innervating IIB and IID/X fast-fatigable muscle fibers, together with a conversion to motor units innervating IIA fast-resistant muscle fibers.
More recently, a longitudinal MRI study performed by Marcuzzo and colleagues (2011) in the SOD1(G93A) mice revealed that muscle degeneration precedes neurodegeneration and clinical signs, supporting the retrograde dying-back of motor neurons.
Muscle as the primary site of degeneration
Besides the dying-back hypothesis, some studies suggest that skeletal muscle is the primary site of toxicity and the cause of the retraction of motor axons. Dupuis and colleagues (2002) demonstrated a shift in muscle gene expression, with an up-regulation of the neurite outgrowth inhibitor Nogo–A, in skeletal muscle from SOD1(G93A) mice and ALS patients. This suggests that muscle can play a key role in initiating
and modulating the disease, a finding consistent with the positive outcomes of treatments acting on muscle fibers, as IGF1 (Dobrowolny et al., 2005).
Moreover, it was detected that SOD1(G93A) mice suffer from a dramatic defect in energy homeostasis that seems to be linked to an abnormal hypermetabolism mainly of muscular origin (Dupuis et al., 2004). Consistent with this hypothesis, a mouse model of muscle restricted mitochondrial defect (similar to the hypermetabolism) is able per se to destabilize neuromuscular junctions and generate motor neuron degeneration (Dupuis et al., 2009).
Finally, Wong and colleagues (2010) showed that the restricted expression of the mutant SOD1 in muscle is sufficient to trigger motor neuron degeneration with a phenotype consistent with ALS.
1.2 The neuromuscular junction
The neuromuscular junction is the synapse between a spinal motor neuron and a skeletal muscle fiber. This system is responsible for transmitting the electric impulse from the nervous system to the muscle, triggering muscle contraction.
1.2.1 Structure of the neuromuscular junction
In mostly higher vertebrates, each skeletal muscle fiber is innervated at a single site by a single motor axon. As the motor neuron approaches the muscle fiber, the axon loses its myelin sheath and divides into fine branches. The ends of the branches form multiple expansions, called synaptic boutons, which make synaptic contacts with the muscle fibers membrane at a specialized region, the motor the endplate (Kandel, 2000).
Each nerve ending contains all the machinery required to release the neurotransmitter including synaptic vesicles, voltage-gated calcium channels (Ca2+) and numerous mitochondria. Synaptic vesicles (also termed quanta) store acetylcholine (ACh) which is the only neurotransmitter at the skeletal neuromuscular junctions. ACh is first produced locally from acetyl coenzyme A (acetylCoA, synthesized from glucose) and choline (transported from the plasma) by choline acetyltransferase (ChAT) and then loaded into vesicles through vesicular transport (Purves, 2001). The number of ACh molecules inside a single vesicle, termed quantum of transmitter, varies from 500 to 10 000 (Kuffler and Yoshikami 1975) and was shown to vary with the functional state of the nerve terminal (Brooks and Thies, 1962; Naves and Van der Kloot, 2001).
Table 1.I. Major studies performed in SOD1 model of ALS and pointing for a dying-back pathology. M aj o r fi n d in gs a n d c o n cl u si o n s M o to r n eu ro n p at h o lo gy b egi n s at t h e d is ta l a xo n p ro ce ed in g in a d yi n g-b ac k p at te rn . D en erv at io n is p ri o r to sym p to m s o n se t an d p ro ce ed s in a m u sc le -sp ec if ic m an n er: la rg e r m o to r n eu ro n s in n er va ti n g II B an d II D /X fi b er s, p res en t in cre as ed s u sc ep ti b ili ty. M u sc le d ege n era ti o n o r in ju ry ca n it se lf l ea d t o n eu ro d ege n er at io n a n d ca u se A LS , ra th er th an b e a co n se q u en ce o f n eu ro gen ic a tr o p h y. M u sc u la r d ege n er at io n p re ce d es n eu ro d ege n era ti o n a n d c lin ic al s ig n s. Se co n d ar y m o to r n eu ro n s are th e fi rs t af fe ct ed b y th is p ro ce ss . Ob se rv ati o n 4 0% o f de ner vat io n at the neu ro m us cul ar jun cti on by da y 4 7 , fo llo wed by ap pr o xi m at el y 60 % lo ss o f m o to r ax o ns f ro m v entr al r o o ts betw ee n da ys 4 7 an d 8 0 , an d lo ss o f α -c el l bo di es f ro m the l u m ba r spi na l c o rd aft er da y 8 0. Si gni fi ca nt dec line in the m o to r uni t nu m b er i n fas t-twi tc h m us cl es ( MG , TA an d ED L m us cl es ) b y da y 40 o f age , wh ic h pa ral lel s redu cti o ns i n who le m us cl e fo rc e. S O L m us cl e dec lin e in bo th pa ra m et er s wa s o nl y ap pa ren t aft er s ym pto m s o ns et. N eur o geni c at ro phy o f SO L m us cl e fi ber s an d deta ch m ent of the ner ve te rm ina ls f ro m N MJ b y 10 wee ks o f age . T he leve ls an d cl us te rs o f A C hR d id no t cha ng e al o ng the di seas e. Tr an sg eni c m ic e wi th skel eta l m us cl e -r es tr ic te d exp res si o n o f m SO D 1dev el o p neur ol o gi c an d hi sto pa tho lo gi c pheno typ es co ns is ten t wi th A LS . Mus cl e res tr ic ted ex pr es si o n is s uf fi ci ent to c au se di sm an tl em ent o f N MJ an d di sta l ax o no pa thy . Si gni fi ca nt redu cti o n in m us cl e m as s tha t pa ra lle ls reduc ti o n in fi ber d ia m ete r an d m us cl e at ro phy f ro m wee k 8 . Ev iden ce o f neu ro deg ener at io n in th e br ai ns te m dete cted o nl y fr o m we ek 1 0. Ai m Q ua nti fi cat io n o f lu m ba r spi na l m o to r neu ro ns an d ax o ns in ner ve vent ral r o o ts ( L-4) , an d the de gr ee o f dener va ti o n at N MJ (m ed ial g as tr o cne m ius (MG ), ti bi al is an te ri o r (T A ) an d so leus ( SO L) m us cl es ) in SO D 1 (G 9 3A ) an d no n -T G li tt er m at es . Fi sh er e t al . ( 20 0 4 ) Ex p er imen ta l Ne u ro lo gy R ec o rdi n gs o f bo th who le m us cl e an d m o to r uni t (MU ) is o m et ri c co ntr acti le fo rc es ( MG , TA , ext ens o r di gi to ru m lo n gus (E D L) an d SO L m us cl es )i n SO D 1 (G 9 3A ) an d SO D 1 (W T) m ic e. Hege d u s et a l. (2 0 0 7) Ne u ro b io lo gy o f Di se as e H is to lo gi cal an d W es te rn bl o t an al ys is o f SO L m us cl e in SO D 1 (G 93 A ) and no n -T G li tt er m at es Na ra i e t al . ( 2 0 0 9 ) Ne ur o lo gy In te rn at io n al N eur o lo gi c, hi sto pa tho lo gi cal an d bi o che m ic al exa m ina ti o n in tr an sg eni c m ic e wi th skel eta l m us cl e -res tr ic ted ex pr es si o n of thr ee di ff er ent hS O D 1 gen e var ian ts ( hS O D 1( G 37 R ), hS O D 1( G 9 3 A ), hS O D 1 (W T) ) W o n g an d M ar ti n ( 2 01 0 ) Hu m mo le c ge n e t Lo ng itud ina l m agn eti c res o na nc e im ag in g (MR I) o f H ind lim b m us cl e, br ai ns tem an d m o to r co rtex o f SO D 1 (G 9 3A )( 1G ur ) an d B 6 SJ L co nt ro l m ic e. M ar cu zz o e t al . ( 2 0 11 ) Ex p er imen ta l Ne u ro lo gy
Synaptic vesicles can be attributed to three functionally different pools. The readily releasable pool comprises synaptic vesicles clustered at active zones, the specialized region for transmitter vesicular release, and sustains low and moderate neurotransmission. The cycling pool, located near the active zones, ensures the replenishment of the readily releasable pool. Recycled synaptic vesicles can either incorporate the readily releasable or the cycling pool. Finally, the reserve pool, located further away, sustains the replenishment of the below pools and is recruited only upon long-term transmission (Richards et al., 2003, see Rizzoli and Betz 2005).
The space between the nerve and muscle fibers is termed the synaptic cleft and consists in a condensed extracellular matrix (basement membrane or basal lamina) composed of collagen and glycoproteins with a structural function in organizing the synapse. Both the nerve and muscle fibers secrete proteins into the basement membrane namely acetylcholinesterase (AChE). This is a high catalytic enzyme that, by cleaving ACh into acetate and choline, limits both temporal and spatial extent of transmitter action (Kandel et al., 2000).
The motor endplate is characterized by a deep folding of the sarcolema. The crests contain a high density of ACh receptors, whereas the depths present a high density of voltage-gated sodium channels (Na+). Post-synaptic actions of ACh are mediated by the ionotropic nicotinic ACh receptors, which are non selective cation channels (Kandel et al., 2000).
1.2.2 Neuromuscular transmission
Most of the knowledge on synaptic transmission comes from the pioneering work on neuromuscular transmission performed by Bernard Katz and his colleagues during the 1950s and 1960s.
Resting membrane potential
The resting membrane potential (RMP) is the electrical potential measured across the cell membrane in the absence of signaling. It results from a separation of charges that, in general terms, is due to differences 1) in the concentrations of specific ions across cell membrane and 2) in the selective permeability of the membrane to some of these ions. The negative membrane potential indicates an excess in negative charges within the cell, and can be predicted by the Goldman equation;
PK[K+]o + PNa[Na+]o + PCl[Cl-]i
PK[K+]i + PNa[Na+]i + PCl[Cl-]o
RMP = ln RT F
Where R indicates the gas constant, T the temperature, F the faraday constant, P the permeability of the membrane for the ion X, and [X]o and [X]i the concentrations of the ion inside and outside the muscle fiber.
In these conditions, cells are in a steady state with no net flux of ions across the membrane.
During synaptic transmission, the temporary opening of ion channels produces brief changes in the flow of electrical current across the cell membrane that drives the membrane potential away from its resting value (Purves, 2001; Kandel et al., 2000).
Evoked activity
During nerve stimulation, the action potential propagating along the axon reaches the nerve terminal and the resulting depolarization causes the opening of voltage-gated Ca2+ channels. The subsequent influx of Ca2+ raises the intracellular free Ca2+ concentration in the pre-synaptic terminal triggering the synchronous fusion of the synaptic vesicles with the pre-synaptic membrane. The number of quanta released by each nerve impulse is known as quantal content of the EPP.
In the post-synaptic membrane, the activation of nicotinic ACh receptors by two molecules of ACh increases the total conductance of the endplate membrane, allowing Na+ and K+ to flow with nearly equal permeability. This local depolarization, called the endplate potential (EPP), is normally large enough to bring the membrane potential of the muscle fiber above the threshold for the activation of voltage-gated Na+ channel. By a positive feedback loop, more voltage-gated Na+ channels are activated, producing an actively propagated action potential that ultimately triggers muscle contraction (Purves, 2001; Kandel et al., 2000).
Spontaneous activity
In the absence of nerve stimulation, spontaneous deflections of the resting membrane potential are also detected (Fatt and Katz 1952). These small depolarizations (<1 mV) are designated miniature endplate potentials (MEPPs) and arise from the spontaneous asynchronous release of individual vesicles. “Giant” miniature endplate potentials (GMEPPs) (Liley 1957) are classified separately from the usual MEPPs. These arise from a spontaneous synchronous release of multiple vesicles insensitive to both nerve terminal depolarization and extracellular Ca2+ (Colmeus et al., 1982; Thesleff et al., 1983) being instead triggered by Ca2+ released from intracellular stores and/or result from an impaired processing of recycled vesicles (Rizzoli and Betz 2002). Moreover several studies reported an increased frequency of GMEPPs in re-innervated muscles (Miledi 1960), nerve terminals in degeneration (Birks et al., 1960) and in motor endplate diseases (Weinstein 1980).
Safety factor
The transmission of signals from nerve to skeletal muscle is a highly reliable process that is necessary for the normal function of the body. Motor nerve terminals release more quanta per nerve impulse than the required to initiate an action potential. This excess is referred as safety factor and allows the neuromuscular transmission to remain effective under several physiological conditions and stresses. Numerous diseases characterized by an impairment of neuromuscular transmission, and therefore by a weakness of voluntary contraction, present a reduced safety factor (see Wood and Slater 2001).
1.3 ALS and the neuromuscular junction
1.3.1 Molecular changes
Mitochondria and axonal transport are considered key players in many cellular processes relevant for neuromuscular transmission and their impairment, as reported in ALS, might be related to changes in neuromuscular junction function.
Mitochondria are vital organelles with a predominant role in energy metabolism providing ATP for axonal transport, ion pump fueling (Na+/K+), neurotransmitter synthesis, and for several steps in the vesicle cycle such as vesicle fusion, uncoating and refilling. This metabolite is also essential to sustain neurotransmission during high-frequency stimulation mediating the mobilization of vesicles from the reserve pool and recycling via endocytosis. Mitochondria are specifically retained in regions of the axon with high energy-demand including Ranvier nodes and nerve terminals in particular near the actives zones (Vos et al., 2010 and Kawamata and Manfredi 2010). In ALS, mutant SOD1 was reported to accumulate in vacuoles in the mitochondrial intermembrane space (Higgins et al., 2003). In accordance, defects in the mitochondrial respiratory chain (ATP-generating oxidative phosphorylation) were observed in both ALS patients tissues (Wiedemann et al., 2002) and transgenic mice (Mattiazzi et al., 2002). Moreover, mutant SOD1 was also reported to disrupt anterograde transport of mitochondria, inducing an accumulation of mitochondria in cell bodies and in proximal axons of transgenic mice (De Vos et al., 2007). Consistent with this, the reduced mitochondrial content in the distal axon combined with the impaired mitochondrial function may lead to a local ATP depletion, thereby inducing axonal stress and compromising neuromuscular transmission (De Vos et al., 2007).
Mitochondria also contribute to neuronal function through regulation of calcium homeostasis. This organelle is able to sequester and release Ca2+ and thereby modulates numerous events such as the probability of neurotransmitter release (promoting either recovery from depression or vesicles depletion),
and the endocytic rate within vesicle recycling process (see Vos et al., 2010; Kawamata and Manfredi 2010). In ALS, motor nerve terminals present a lower cytosolic calcium clearance (Vila et al., 2003; Jaiswal et al., 2009; Nguyen et al., 2009) and muscle fibers present both reduced mitochondrial Ca2+ uptake and increased Ca2+ release from endoplasmatic reticulum stores (Zhou et al., 2010). This reduction in calcium buffering leads to an increase in intracellular calcium levels making motor neurons more vulnerable to degeneration (Siklos et al., 1998; Kim et al., 2002).
Finally, mitochondria constitute an important source of reactive oxygen species (ROS) through mitochondrial respiration (Vos et al., 2010 and Kawamata and Manfredi 2010). Hydrogen peroxide (H2O2),
which is generated from the superoxide by SOD1, was reported to be a modulator of transmitter release. While low physiological concentrations of H2O2 were shown to facilitate neuromuscular transmission by
enhancing transmitter release (Giniatullin and Giniatullin 2003), high concentrations caused synaptic depression through a direct impairment of the releasing machinery, mediated by SNAP25 essential fusion protein (Giniatullin and Giniatullin 2003, Giniatullin et al., 2006). In ALS, multiple pathological studies have reported evidence of increased oxidative stress in postmortem tissue from patients (Shaw et al., 1995; Simpson et al., 2004).
Motor neurons are polarized and contain long processes, often with more than a meter in length, through which cargoes have to move. Axonal transport is therefore a key component in structure maintenance and signal transmission, namely neurotransmitter synthesis, release and recycling, at the nerve terminals of motor axons. In ALS, mutant SOD1 species were shown to bind KAP3, a component of the kinesin-2 motor complex that mediates the transport of ChAT. Consistent with this, both ChAT levels at nerve terminals and ACh release, were reduced (Tateno et al., 2009).
1.3.2 Functional changes
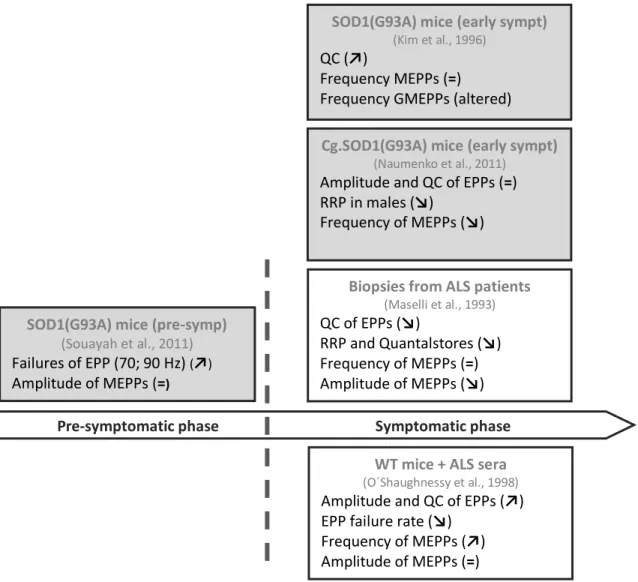
Figure 1.2 illustrates the current knowledge on neuromuscular transmission in ALS. At present, there is little information regarding pre-symptomatic phase. Souayah and colleagues (2012) reported that 6 weeks-old SOD1(G93A) mice presented a reduced probability of successful neuromuscular transmission (more failures) at high frequencies of stimulation (70 and 90 Hz). This functionally compromised phenotype was attributed by the authors to an impaired action potential initiation and propagation along the axon or impairments in transmitter mobilization and release from the nerve ending.
Figure 1.2 Current knowledge on neuromuscular transmission in ALS
Here is summarized the results from major electrophysiological studies in both pre-symptomatic and symptomatic phases of ALS disease. Grey boxes show studies performed in mice models of ALS whereas white boxes show studies performed with samples from ALS patients. In pre-symptomatic phase, Souayah and colleagues (2012) assessed neuromuscular transmission of 6weeks-old SOD1(G93A). In symptomatic phase, Kim (1996) and Naumenko (2011) groups looked at neuromuscular transmission of SOD1(G93A) and congenic SOD1(G93A) mice respectively, when both models started to show signs of disease. Electrophysiological recordings in anconeus muscle biopsies from ALS patients (Maselli et al., 1993) or in WT mice passively transferred with sera from sporadic ALS patients (O'Shaughnessy et al., 1998) were also studied. ↗indicates an increase↘,a decrease and =no changes when compared to the control. QC, quantal content; EPP, endplate potential; MEPPs, miniature endplate potentials; RRP, readily releasable pool.
Regarding symptomatic phase, contradictory results were published. Maselli and colleagues (1993) reported that anconeus muscle biopsies taken from ALS patients presented an impaired neuromuscular transmission with a reduced mean quantal content of EPPs, mean quanta available for immediate release, as well as mean quantal stores. Whereas the mean frequency of MEPPs remained unchanged, the mean amplitude of MEPPs was similarly decreased. Naumenko and colleagues (2011) however did not observed
Cg.SOD1(G93A) mice (early sympt)
(Naumenko et al., 2011)
Amplitude and QC of EPPs (=) RRP in males (↘)
Frequency of MEPPs (↘)
SOD1(G93A) mice (pre-symp) (Souayah et al., 2011) Failures of EPP (70; 90 Hz) (↗)
Amplitude of MEPPs (=)
SOD1(G93A) mice (early sympt)
(Kim et al., 1996)
QC (↗)
Frequency MEPPs (=)
Frequency GMEPPs (altered)
Biopsies from ALS patients
(Maselli et al., 1993)
QC of EPPs (↘)
RRP and Quantalstores (↘) Frequency of MEPPs (=) Amplitude of MEPPs (↘)
WT mice + ALS sera
(O´Shaughnessy et al., 1998)
Amplitude and QC of EPPs (↗) EPP failure rate (↘)
Frequency of MEPPs (↗) Amplitude of MEPPs (=)
differences in the amplitude and quantal content of EPPs in symptomatic congenic SOD1(G93A) transgenic mice. Whereas there was a dramatic drop in spontaneous activity with a reduced mean frequency of MEPPs, no alterations in the amplitude of MEPPs were detected. Male neuromuscular junctions were also reported to present a reduced readily releasable pool and to be more vulnerable to reactive oxygen species. In contrast, a preliminary study performed by Kim and colleagues (1996) detected an increased mean quantal content in symptomatic SOD1(G93A) mice (10-12 weeks-old) and no changes in both frequency and amplitude of MEPPs. Although no details were provided by the authors, the frequency of GMEPPs was reported to be changed.
Interestingly, the passive transfer of sera from sporadic ALS patients to wild-type mice increased the evoked transmitter release (amplitude and mean quantal content) and spontaneous activity (frequency of MEPPs) (O'Shaughnessy et al., 1998). In accordance, either passive transfer or pre-incubation of neuromuscular junctions with immunoglobulins G (IgGs) from ALS patients had already been reported to increase the frequency of MEPPs (Uchitel et al., 1988; Uchitel et al., 1992). Consistent with this, Pagani and colleagues (2006) showed that IgGs from ALS patients interacted with nerve terminals potentiating spontaneous release through the activation of both N-type (CaV2.2) channels and IP3 receptors, and
2
Goals
ALS is the most frequent adult-onset motor neuron disease. Currently, numerous authors have been pointing for a dying-back disease. Since the neuromuscular junction might be the first site to be affected and, therefore, where first signs of the disease can be detected at early stages, there is a need to focus on neuromuscular junction parameters.
At present there is little information about neuromuscular transmission in the SOD1(G93A) mice, and the existing one is often controversial. We considered therefore of interest to evaluate neuromuscular function with the following specific goals:
1. To investigate if the evoked and spontaneous neuromuscular transmission is impaired in pre-symptomatic phase of the disease,
2. To investigate if the evoked and spontaneous neuromuscular transmission is impaired in symptomatic phase of the disease,
3. To investigate if symptomatic transgenic mice present differences in evoked and spontaneous neuromuscular transmission when compared to pre-symptomatic transgenic mice.
To meet the previous aims we performed the following tasks:
1. Establishment and maintenance of the SOD1(G93A) colony at IMM facilities, 2. Litters genotyping in order to distinguish transgenic from non-transgenic mice,
3. Behavioral phenotyping to evaluate motor function and validate therefore the phase of the disease.
4. Intracellular recordings in phrenic-nerve diaphragm preparations from transgenic and non-transgenic mice in two age groups: 4-6 and 12-14 weeks-old corresponding respectively to pre-symptomatic and symptomatic phases of ALS.
3
Materials and methods
3.1 Animals
3.1.1 Animal model
Animal models are of extreme importance since they constitute a major tool to explore the etiology and pathogenesis of diseases and to test possible therapeutic approaches. In the framework of ALS, as most human samples are obtained from patients at the terminal stage, the investigation of pathogenic mechanisms operating from disease onset to death becomes nearly impossible without resorting animal models (see Kato 2008).
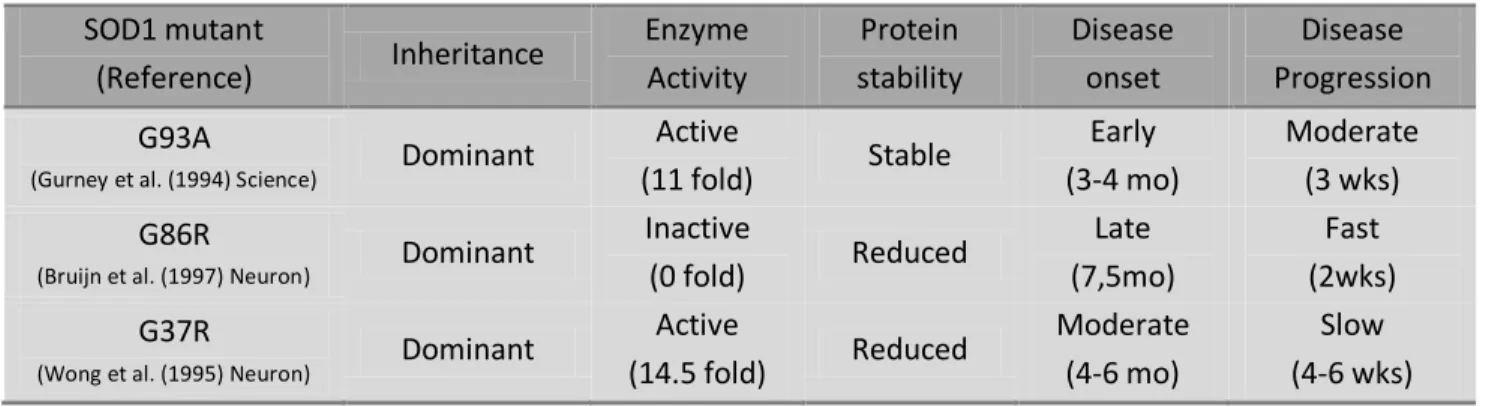
Table 3.I. Characteristics of main mutant SOD1 mouse models (adapted from Swarup and Julien 2011)
SOD1 mutant (Reference) Inheritance Enzyme Activity Protein stability Disease onset Disease Progression G93A
(Gurney et al. (1994) Science) Dominant
Active (11 fold) Stable Early (3-4 mo) Moderate (3 wks) G86R
(Bruijn et al. (1997) Neuron) Dominant
Inactive (0 fold) Reduced Late (7,5mo) Fast (2wks) G37R
(Wong et al. (1995) Neuron) Dominant
Active (14.5 fold) Reduced Moderate (4-6 mo) Slow (4-6 wks)
The generation of ALS animal models started after the identification of sod1 as a causative gene for this disease (Rosen et al., 1993). Until now more than 12 transgenic mice carrying different SOD1 mutations have been created by inducing the expression of mutant sod1 mini-genes. These are constructs involving typically 12-15kb human genomic fragments, encoding mutated SOD1, driven by endogenous promoter and regulatory sequences (see Turner and Talbot 2008). Table 3.I presents the characteristics of major SOD1 transgenic lines. As illustrated, these lines differ in transgene copy number, enzyme levels and activity, as well as disease onset and progression. Despite the vast differences, all of them have been reported to exhibit the same histopathological hallmarks that are observed clinically in both sporadic and familial ALS (see Julien and Kriz 2006). More importantly, mice that express wild-type human SOD1 do not develop this stereotyped syndrome suggestive of motor neuron disease (Gurney et al., 1994). More recently, the discovery of other genes implicated in ALS namely alsin, dynactin, senataxin, VAPB, FUS and
TDP-43, has lead to the creation of new animal models. Nevertheless, SOD1 models remain the only reliable mouse model for either sporadic or familial ALS (see Swarup and Julien 2011).
In the present study we used the SOD1(G93A) model (Gurney et al., 1994) since it constitutes the most widely used and the best-characterized mouse model of ALS, as illustrated in figure 3.1. These animals carry a high copy number (25±1.5) of the human SOD1 gene (transgene) with a point mutation responsible for a glycine to alanine substitution at position 93.
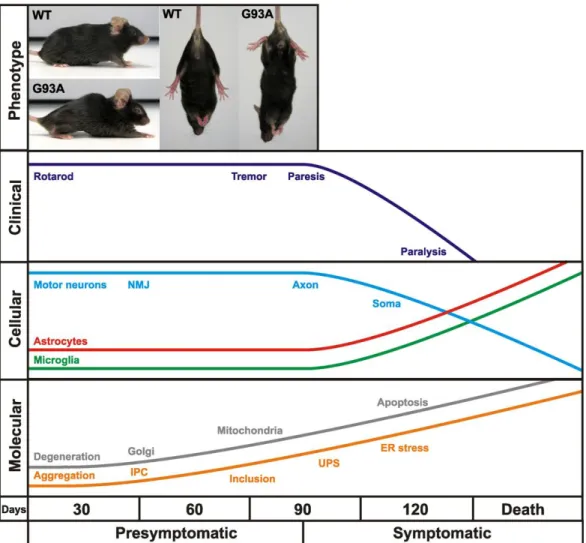
Figure 3.1 Time course of clinical and neuropathological events in SOD1(G93A) mice (from Turner and Talbot 2008)
Clinically, mice begin to show signs of hind limb tremor and weakness by 3 months of age. From 3 to 4 months, mice progress to hyper-reflexia, paralysis and premature death. At the cellular level, neurodegeneration begins with denervation of neuromuscular junctions, followed by a significant axonal loss and soma loss. A massive activation of astrocytes and microglia becomes visible at approximately disease onset. Finally, at the molecular level, pathologic features of motor neurons include mitochondrial vacuolization, Golgi apparatus fragmentation, neurofilament-positive inclusions, mutant SOD1 aggregation into insoluble protein complexes (IPC) (Turner and Talbot 2008).
3.1.2 Animal strains, breeding and husbandry
Transgenic B6SJL-TgN(SOD1-G93A)1Gur/J males (Jackson Laboratory, No. 002726) and wild-type B6SJLF1/J females were purchased from Jackson Laboratory (USA) and a colony was established at BEEM facilities. Since transgenic females are infertile, mice were maintained on a background B6SJL by breeding transgenic males with non-transgenic females in a rotational scheme.
At time of weaning, littermates were identified through ear punching and separated in different cages according to their gender. This system is a permanent procedure that attributes to each hole a number and so allows individual identification of mice. Moreover, this method does not require anesthesia, guarantee animal welfare, and the tissue removed by the ear punch can be used for DNA analysis, phasing out the requirement of an additional procedure. All animals were housed 4-5 mice/cage, under a 12h light/12h dark cycle, and received food and water ad libitum. Animals were handled according to European Community guidelines and Portuguese Law on Animal Care.
3.2 Genotyping
A polymerase chain reaction (PCR) was then conducted to differentiate between non-transgenic and transgenic mice. Ear tissue punches taken from each mice were placed separately in microcentrifuge tubes along with 0.1ml of DNA digestion buffer (50mM KCl, 10nM Tris-HCl (pH 9.0) and 0.1% Triton X-100 with proteinase K added to a final concentration of 0.15 mg/ml) and were incubated overnight at 56ºC. A gentle shaking was applied in order to aid complete tissue disruption. After incubation, proteinase K was inactivated by placing tubes in a dry heating block set at 95ºC for 15min. Samples were then centrifuged for 2 min at 1200rpm to get rid of debris and supernatants were transferred into new autoclaved eppendorfs tubes. DNA samples were either used immediately as templates for amplification reaction or stored at -20ºC.
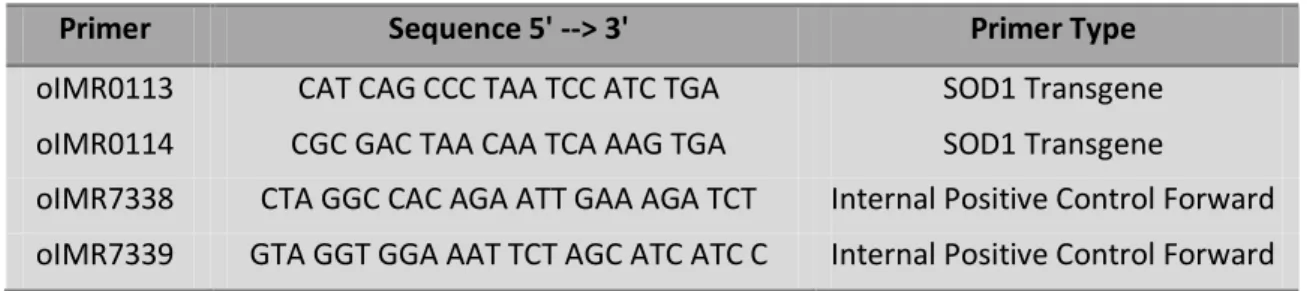
Table 3.II. Protocol Primers (adapted from Jackson´s Laboratories manual)
Primer Sequence 5' --> 3' Primer Type
oIMR0113 CAT CAG CCC TAA TCC ATC TGA SOD1 Transgene
oIMR0114 CGC GAC TAA CAA TCA AAG TGA SOD1 Transgene
oIMR7338 CTA GGC CAC AGA ATT GAA AGA TCT Internal Positive Control Forward oIMR7339 GTA GGT GGA AAT TCT AGC ATC ATC C Internal Positive Control Forward
A mix solution was prepared (15.7µl H2O autoclaved, 2.50µl 10xPCR Buffer II, 2.5mM of each dNTPs,
20µM of each primer (presented on table 3.II) and 5U/µl Taq DNA polymerase, to a final volume of 25µl/sample), taking into account the number of DNA samples and controls to run, plus 10% extra for losses while pipeting. IMR0113 and IMR0114 amplify SOD1 human fragment while IMR7338 and IMR339 amplify a internal positive fragment. After pipeting 25µl of the mix reaction into PCR tubes, 1µl of each DNA sample was added, and tubes were placed in a termocycler device for PCR assay. After an initial denaturation step of 3min at 94ºC, DNA was amplified for 29 cycles (30s at 94ºC, 30s at 62ºC and 30s at 72ºC) followed by a final elongation step of 10 min a 72ºC and a cool down step, where solutions are maintained at 4ºC.
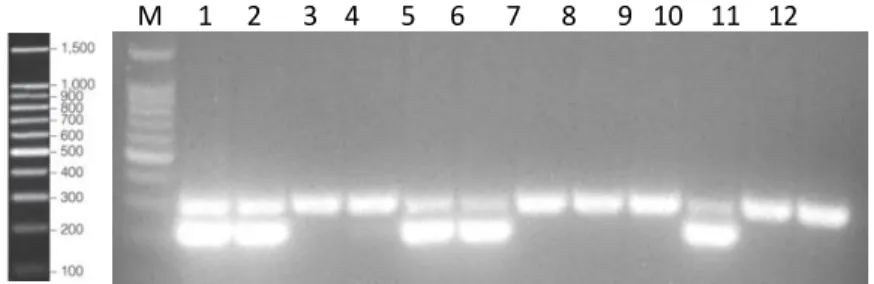
Finally, PCR products were separated on a 2% agarose gel. To do that, 5µl of loading buffer was added to each sample tube, and then 15µl of the mixture was loaded to the gel-well. To allow band size estimation, 6µl of the BenchTop 100bp DNA ladder was also applied. Gel was run for 30 to 40min at 100 volts in an electrophoresis bath containing 1x Tris-Acetate-EDTA (TAE) buffer and then placed under UV light for band inspection. Figure 3.2 shows an example of a progeny genotyping with the SOD1 and WT bands on the agarose gel. Wild-type mice present a unique band of 324pb corresponding to the internal positive control, while transgenic mice exhibits 2 bands, the 236pb and 324bp corresponding to the transgene and internal positive standard respectively.
Figure 3.2 Example of a progeny genotyping
Here is illustrated the identification of SOD1 and WT mice on a 2% agarose gel. On the left side is the BenchTop 100bp DNA ladder separated equally on a 2% agarose gel. The PCR product of the WT genotype (lane 11) is a fragment of 324bp whereas the one of SOD1 mice (lane 5) are two fragments of 236 and 324bp. Lane under M in the gel is the 100bp size marker.
3.3 Behavioural phenotyping
3.3.1 Body weight
Body weight is easy to measure and can be indicative of general wealth of mice. However, the correlation between the process of weight loss and changes in locomotor coordination and muscular strength is difficult (Knippenberg et al., 2010). In this way body weight was recorded has an additional parameter.
3.3.2 Rotarod test
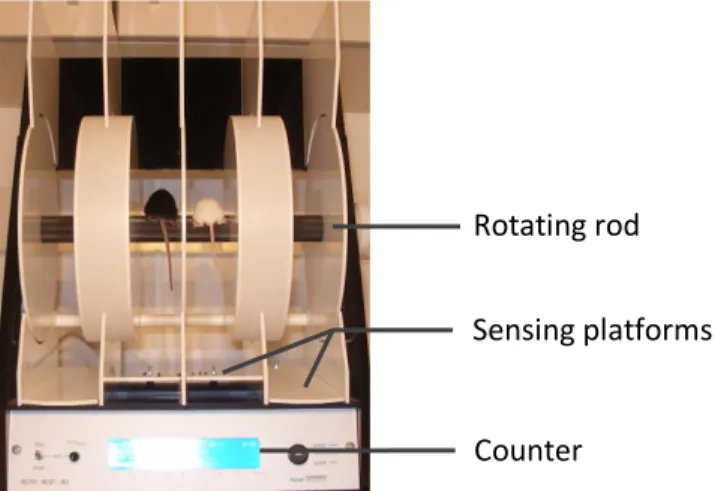
At present, rotarod is considered the gold standard test to assess motor function in mice (see Brooks and Dunnett 2009). As shown by Knippenberg and colleagues (2010), is the most sensitive and appropriate method for early detection of symptoms onset in the SOD1(G93A) mouse model. The rotarod apparatus is illustrated in figure 3.3. Briefly, mice are placed on the rotating rod where they have to maintain their balance and motor coordination to remain on it. When mice fall from the rod, sensing platforms (a trip switch on the floor below) stop the counter and latency-to-fall is recorded. This test can be performed at fixed or accelerating speeds. Fixed-speed test are known to provide separate data on each range and does not confound motor coordination with fatigue as the accelerating test do. In addition, this version was reported to be more appropriate to detect small changes with a maximum sensitivity (Monville et al., 2006; Brooks and Dunnett 2009)
Figure 3.3 Rotarod device
Mice falling from the rotating rod push the platforms. This stops the counter and in this way the latency-to-fall is recorded.
Rotating rod
Sensing platforms
In the context of ALS, multiple rotarod protocols have been generated. Most of them were used to assess disease onset and progression while testing new drug treatments and so where performed in an overtime fashion. Typically, fixed speed tests are performed at 10 or 15 rpm with a cut-off time set at 180s (Smittkamp et al., 2008; Banerjee et al., 2008) and accelerating versions increase speed from 2 to 20 rpm over the course of 300s (Smittkamp et al., 2008) or 1 to 18 rpm during 180s (Knippenberg et al., 2010).
In the present study rotarod was conducted in two age groups: in animals with 4-6 and 12-14 weeks. A training period comprising two stages was performed so as to minimize environmental variability. First animals were habituated to handling, initiated four days before the testing day, then to the rotarod apparatus and finally were taught the task itself. For that, mice were placed on the rod at the lowest rotation speed (4 rpm) where they had to maintain for at least 120s. Once the task was learnt, mice were placed and taken off from the rod several times by the researcher in order to reduce handling stress (Rozas et al., 1997). In the testing day, mice were sequentially assessed at 5, 10, 15, and 25 rpm, for a maximum of 300s each speed. 3 trials were performed per speed with 5 min rest between each trial.
3.4 Electrophysiological recordings
3.4.1 The neuromuscular junction model
Since the turn of the century, the neuromuscular junction of vertebrate skeletal muscle has served as a model for studying synaptic transmission conveying most of our current knowledge about neurotransmission within central and peripheral nervous system.
This synapse has been considered a prototype model due to its accessibility (located at periphery), size, and more importantly its simplicity, facilitating the experimental analysis (Deschenes et al., 1994). Indeed, each muscle fiber is innervated by a single motor neuron, so any event occurring in this cell results from just one input. This is not the case in central nervous system where one neuron can receive a thousand of different inputs, either excitatory or inhibitory, from adjacent neurons. Additionally, the only input is excitatory and results from the action of ACh. This neurotransmitter is released in multimolecular packets or quanta, and the number of quanta release by an EPP, that is the quantal content, can be easily assessed. Finally, since the amplitude of any synaptic potential depends upon both the amount of transmitter released and the postsynaptic responsiveness to transmitter, the differentiation between pre and post-synaptic factors becomes possible. Typically changes in MEPPs frequency are related to the pre-synaptic component. Changes of MEPPs amplitude may reflect both pre- and postpre-synaptic factors. Generally it results from changes in post-synaptic action of ACh or changes in postsynaptic membrane
resistance or capacitance. If these remain unchanged, then this difference has a pre-synaptic origin, such as less ACh contained in each quanta. Additionally, the electrophysiological assessment provides an excellent time resolution of events and the method is relatively simple. It constitutes the best way to evaluate the nerve-muscle communication and hence to detect impairments (Naguib et al., 2002).
3.4.2 Diaphragm phrenic-nerve preparation
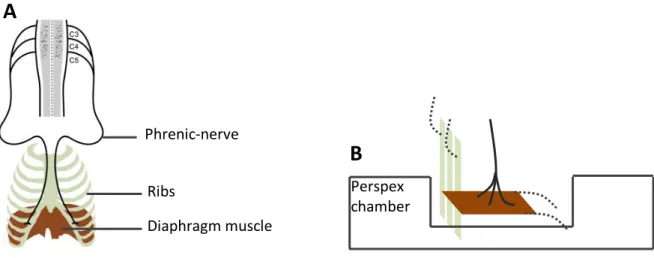
Experiments were conducted in animals with 4-6 and 12-14 weeks-old. Non-transgenic littermates (WT) were used as age-matched controls. At the different stages of disease, mice were anesthetized with gaseous isoflurane and then sacrified by decapitation. Hemi-diaphragm muscle with its attached phrenic-nerve was isolated and then mounted on a 3ml Perspex chamber in order to be maintained at resting tension as illustrated in figure 3.4. Tissue was perfused continuously with a gassed (95% O2 and 5% CO2)
physiological saline solution (containing (mM): NaCl 117; KCl 5; NaHCO3 25; NaH2PO4 1,2; glucose 11; CaCl2
2,5; MgCl2 1,2) kept at room temperature (22-25ºC). Perfusion was maintained at a rate of 3ml/min via a
roller pump, and bath volume was kept constant by suction.
Figure 3.4 Scheme depicting diaphragm phrenic-nerve preparation
A) Phrenic motor neurons together with a strip of the innervated diaphragm muscle and ribs are isolated (adapted from Mantilla and Sieck 2009) and then B) assembled in a perspex chamber to be maintained at resting tension. Perspex chamber Phrenic-nerve Diaphragm muscle Ribs
A
B
3.4.3 Muscle contraction blockade
Before any recording, muscle action potential had to be blocked in order to prevent mechanical disturbance resulting from muscle contraction. This can be achieved by 1) raising [Mg2+] or lowering [Ca2+], 2) treating preparations with d-tubocurarine, or 3) damaging muscle fibers. In the framework of this study, however, these alternative approaches present the limitation that they do not allow the full effect of nerve activity to be measured. By contrast, the use of µ-conotoxin GIIIB, a natural toxin isolated from the venom of the snail Conusgeographus, allows EPP recording from intact muscle fibers without affecting quantal
content of EPPs. This inhibitory peptide preferentially blocks muscle Na+ channels and not those present on
nerves (Cruz et al., 1985). In this study, muscle contraction was prevented by treating preparations with 2µM µ-conotoxin GIIIB for 45 to 60min, as done previously (Gillingwater et al., 2002). For this purpose, perfusion was stopped and toxin was applied to the solution bath, just beneath tissue preparation. During time treatment, preparation was kept under oxygenation. At the end, perfusion was retaken by turning on the roller pump. This procedure was repeated whenever contraction became visible.
3.4.4 Intracellular recordings
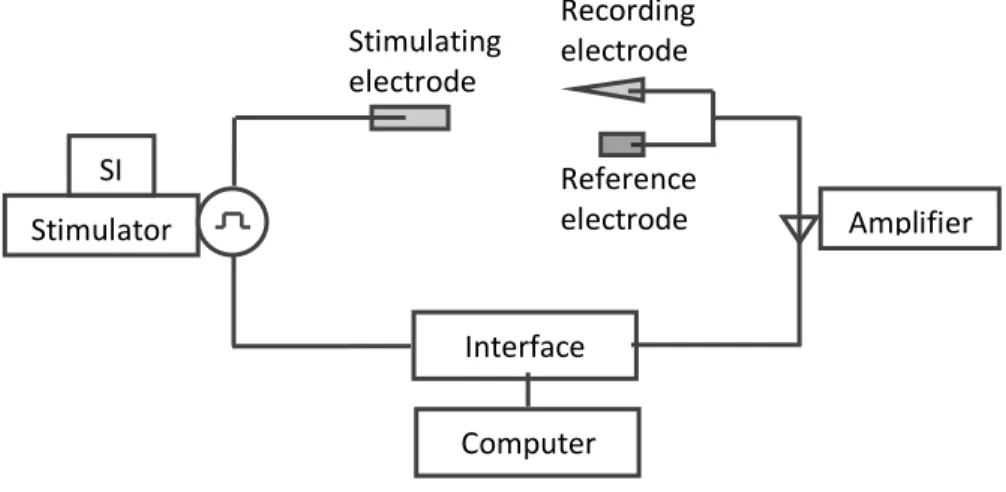
Figure 3.5. Diagram of the electrophysiological setup
The interface board first converts digital signals into analog allowing the computer to send command
signals (stimulus duration, frequency, strength) to stimulate the nerve. Then, the current is delivered from
the stimulator through the stimulus isolator (SI) and a suction electrode is use to stimulate the motor axons
into firing action potentials. The resting membrane potentials (through channel 1) and spontaneous or
evoked activity (through channel 2) are recorded simultaneously by the microelectrode and then sent into
the amplifier through corresponding channels. Once amplified, the electrical (analogue) signals travel to the
interface board to be converted into digital forms and then acquired by the computer using specially
designed software. SI Stimulator Amplifier Interface Computer Stimulating electrode Recording electrode Reference electrode
Data acquisition
Intracellular recordings were performed in the conventional way (figure 3.5) (Ribeiro and Walker 1975; Ribeiro and Sebastiao 1987; Pousinha et al., 2012). Glass microelectrodes (10-30mΩ) filled with 3KCl were inserted within muscle fibers at the motor endplate and the reference electrode was an Ag-AgCl pellet placed in the bath.
For EPP recordings, the phrenic-nerve was stimulated supramaximally at 0.5 Hz, with constant current of 20 µs duration, by means of a suction electrode. It is known that quantal release, which is itself frequency dependent, gradually declines in response to stimulation frequencies greater than 1 Hz. Hence, the frequency of stimulation chosen ensured the measurement of individual responses to evoked activity without summation of postsynaptic potentials over time.
MEPPs were acquired in gap free mode during 100s. Through all the experiment, resting membrane potential (RMP) of the muscle fiber was monitored.
After recording, signals were amplified, digitalized and stored on a computer with Clampex program (pClamp10 Axon Instruments, Foster City, USA), to offline analysis of data.
Data offline analysis
The neuromuscular junctions considered for analysis had to meet 2 conditions: a stable resting membrane potential ranging from -50mV to -80mV and recordings in gap free mode with a basal noise lower than 0.3mV.
The evoked activity was measured during intervals of 10 minutes. The EPP amplitude represents the amplitude of 60 consecutive sweeps. As the magnitude of the recorded EPP is influenced by capacitive properties of the muscle fiber membrane (see Wood and Slater 2001) amplitudes were normalized to a membrane potential of -75 mV, as done previously (Sons and Plomp 2006; Pardo et al., 2006; Rozas et al., 2011) using the following equation;
VNOR = [VOBS x (-75)] / RMP
VNOR indicates the corrected amplitude, VOBS the recorded amplitude and RMP the recorded resting
membrane potential. This normalization allows the correction of the EPP amplitude from subtle changes in the resting membrane potential and/or subsequent comparisons of EPP amplitudes from neuromuscular junctions with different membrane potentials. Then, the mean amplitude of EPPs was calculated for each neuromuscular junction by averaging the 5 normalized EPP amplitudes. The quantal content of the EPPs, which indicates the number of vesicles released per impulse, was estimated through the indirect method as follows;
The mean EPPNOR indicates the average evoked response normalized, and mean MEPPNOR, the average
spontaneous response normalized, both acquired during the same period.
Spontaneous events acquired during the time interval of 100s were detected by a detection protocol after application of a lowpass filter to attenuate high frequency noise. The threshold for MEPPs detection was set at levels between 0.2mV and 1mV of amplitude. This maximum amplitude was established in order to treat GMEPPs separately. Additionally, a minimum and maximum of events duration of 2 and 8 ms respectively were set in order to prevent signal contamination with electric noise. The mean amplitude of MEPPs was calculated by averaging the amplitude of each MEPP recorded. The same procedure was done to assess the mean rise-time of MEPPs and mean decay-time of MEPPs. Additionally the mean frequency of MEPPs was measured by counting the number of events acquired during the 100s. The minimum amplitude for GMEPPs detection was set at 1mV. The mean frequency of GMEPPs was calculated by counting the number of these events acquired during the 100s.
3.5 Statistical analysis
All data are presented as mean ± standard error mean (SEM) in each group, with n corresponding to the number of animals used or the number of neuromuscular junctions sampled, as indicated in each figure or table.
Statistical significance of differences between means was determined through GraphPad software. The parametric Student´s t test was used whenever both groups presented a normal distribution and equality of variances. Normality was tested through Shapiro-Wilk test (S-W), which is more appropriate for small samples (n<30), and homogeneity of variances tested through F test. Alternatively, the non parametric Mann-Whitney U-test (M-W) was applied when one of the groups was non-normally distributed, and Student´s t test with Welsh correction, when the equality of variances condition was not met (F test p<0.05).
The frequency distribution of MEPPs amplitude plotted the amplitude of all MEPPs recorded at WT and SOD1 neuromuscular junctions. Histograms with a bin width of 0.1mV ranged from 0.2mV to 1mV. Then a non-linear regression that better fit the distribution of data was added, being used a Gaussian distribution and a Sum of two Gaussians distributions. To evaluate if the model chosen best fitted the distribution we looked at R2, which is a measure of goodness of fit. This ratio ranges between 0 and 1, and when R2=1 all points lie exactly on the fitted curve.
4
Results
4.1 Behavioral phenotyping
To evaluate motor function, mice were tested on the rotarod at several speeds and the latency-to-fall (LF), the time that mice spent on the rotating rod, was recorded. The stage of the disease was determined by the evaluation of animal’s performance on rotarod at 10rpm (for more details see methods 3.2.2). The results obtained in the behavioral assessment of mice from both phases are summarized in table 4.I.
4.1.1 Pre-symptomatic phase
As shown in table 4.I, the mean body weight of 4-6 weeks-old SOD1(G93A) mice (18.0±0.95g, n=11) was approximately the same as WT mice (18.5±0.72g, n=16) (p>0.05, Student´s t test). Regarding rotarod test, the mean latency-to-fall of 4-6 weeks-old SOD1(G93A) mice did not differ from WT mice neither at 5rpm (262±14.0s, n=11, and 257±11.8, n=16, respectively, p>0.05, Mann Whitney test), at 10rpm (236±21.8s, n=11, and 257±11.8s, n=16, respectively, p>0.05, Mann Whitney test) nor at 15rpm (79.6±14.1, n=11, and 138±20.7s, n=16, respectively, p>0.05, Mann Whitney test), confirming the absence of symptoms in SOD1(G93A) mice at low speeds. The performance on the rotarod at 25rpm was, however, reduced in the SOD1(G93A) group (23.8±3.76s, n=11) when compared to the WT group (80.6±19.2s, n=16) (p<0.05, Mann Whitney test), suggesting a motor impairment at high speeds.
4.1.2 Symptomatic phase
As indicated in table 4.I, differences in the mean body weight between 12-14 weeks old SOD1(G93A) and WT mice were not detected (23.5 ± 0.93g, n=10, 23.9 ± 0.89g, n=10, in WT and SOD1 groups, p>0.05, Student´s t test). The performance of SOD1(G93A) mice on the rotarod task was significantly decreased when compared to WT mice. The mean latency-to-fall, not different between groups at 5rpm (267 ± 12.3s, n=10, 246 ± 23.6s n=10, in WT and SOD1(G93A) groups, p>0.05, Mann Whitney test), became significantly reduced by 31% at 10rpm (263±13.9s, n=10, and 181±31.3s, n=10, in WT and SOD1(G93A) groups, p<0.05, Mann Whitney test) 59% at 15rpm (218±20.2s, n=10, and 90.4±15.2s, n=10, in WT and SOD1(G93A) groups, p<0.05, Student´s t test) and 76% at 25rpm (125±28.7s, n=10, and 29.7±3.54s, n=10, in WT and SOD1(G93A) groups, p<0.05, Student´s t test with Welsh correction) indicating an impaired motor balance and coordination. We therefore confirmed the symptomatic state of 12-14 weeks old SOD1(G93A) mice.