Vol.57, n.1: pp. 145-154, January/February 2014
ISSN 1516-8913 Printed in Brazil BRAZILIAN ARCHIVES OF
BIOLOGY AND TECHNOLOGY
A N I N T E R N A T I O N A L J O U R N A L
Production of Polyhydroxyalkanoates (PHAs) By Bacillus
subtilis and Escherichia coli Grown on Cane Molasses
Fortified with Ethanol
Eman Zakaria Gomaa
*Department of Biological and Geological Sciences; Faculty of Education; Ain Shams University; Cairo - Egypt
ABSTRACT
The aim of this work was to study the production of polyhydroxyalkanoates (PHAs) by Bacillus subtilis and Escherichia coli isolated from the industrial contaminated soil samples using cane molasses as an inexpensive substrate. The amount of PHA accumulated followed a similar pattern to its growth for each of treatment indicating a growth-related production, yielding maximum PHA production of 54.1 and 47.16% for B. subtilis and E. coli, respectively after 96 h cultivation in the medium containing 6 and 8 % molasses, respectively and decreased thereafter. The growth and PHA yields were improved by introducing 1% ethanol into the molasses medium. Ammonium sulphate and ammonium nitrate at a concentration of 1 g/L served as the best nitrogen sources for bacterial growth, allowing B. subtilis and E. coli cells to accumulate PHA up to 62.21 and 58.7%, respectively. The optimum environmental conditions that influenced the PHA production by the two strains were inoculum concentration of 8%, pH 7.0 and a temperature of 35°C. The functional groups of the extracted PHA granules were identified by Fourier transform infrared (FTIR) spectroscopy analysis.
Key words: Polyhydroxyalkanoates, Cane molasses, infrared spectroscopy
*Author for correspondence: [email protected]
INTRODUCTION
The reliance on natural biopolymers such as wool, leather, silk and cellulose has been replaced by the synthetic plastic materials. However, these
synthetic polymers are causing serious
environmental problems due to their non-biodegradability. In order to reduce the amount of plastic waste, world-wide programs for efficient management of used plastic materials, such as recycling, have been initiated. Another solution to reduce plastic residues is the use of biodegradable plastics (Kalia et al. 2003).
Polyhydroxyalkanoates (PHAs) are natural,
biodegradable, renewable and biocompatible biopolymers, accumulated intra-cellularly in
bacteria as a carbon and/or energy storage material under the conditions of nutrient stress such as nitrogen, phosphate, or oxygen limitation, or in non-optimum pH culture medium and in an excess of carbon sources (Hazer and Steinbuchel 2007). The composition of PHAs depends on the microorganism and nature of the carbon sources allowing the formulation of new polymers with different physicochemical properties such as short or mid-chain and long-chain fatty acids. However, the most common forms found in microbial cells
are polyhydroxybutyrate (PHB) and
The major limitations in the production of PHAs are special growth condition required, expensive
raw materials such as the producer
microorganisms and substrate composition,
cultures condition, fermentation processes (batch, fed-batch, repeated batch, or fed-batch, and continuous modes) and high cost of their recovery (Castilho et al. 2009). About 50% of the production costs of the PHAs is the cost of carbon source. Agro-industrial wastes and by-products, such as olive oil mill effluents, sugarcane molasses, or paper mill waste water could be used as the carbon source rather than refined organic substrates (Halami 2008). Recycling of these wastes for polyhydroxyalkanoate production is not only crucial for waste management but also in economizing and commercializing the polymer (Thomsen 2005).
The present study was designed to determine the feasibility of molasses as a substrate for the growth and PHA production. The culture parameters were optimized for maximizing the accumulation of PHA by the selected efficient strains using shake flask as a batch culture.
MATERIALS AND METHODS
Isolation and screening of PHA producing bacteria
Ten contaminated soil samples from the industrial areas of Helwan, Kaluobia and 6th October cities
were collected for the isolation of
polyhydroxyalkanoates producing bacteria. Serial dilutions, 10-5 or 10-6, were prepared using 0.9% NaCl solution and 100µl of diluted samples were spread on nutrient agar medium supplemented with glucose (1%). After two to seven days incubation at 35°C, potential PHA producers were detected by Sudan Black B (SBB) staining method. Briefly, a 0.02% SBB solution in ethanol (97%) was gently spread over the plates, completely soaking them, incubated at room temperature for 30-60 min, then discarded and washed with ethanol (97%).
Quantification of PHA production and selection of isolates
All the Sudan Black B positive isolates were subjected to quantification of PHA production following the method of Kemavongse et al. (2008). The bacterial strains giving the highest amount of PHA were selected for further studies.
The selected bacteria were streaked onto nutrient agar slants, incubated at 35º C overnight and then stored at 4ºC and subculture every 15 days.
Strains identification 16S rRNA sequencing and analysis
Bacterial isolates were tested for species identity using the 16S rRNA sequencing method (Rochelle et al. 1995). The gene sequencing was done at Macrogen (South Korea). DNA sequences were aligned using the Gene Mapper v4.1 & Data Collection v 3.1 Communication Patch1. Sequence analysis was performed with sequences in the National Center for Biotechnology Information (NCBI), USA database using Basic Local
Alignment Search Tool for Nucleotides
(BLASTN)(Altschul et al. 1997).
Polyhydroxyalkanoate production
A standard inoculum was prepared by inoculating the 100 mL of nutrient broth contained in 250 mL conical flasks with a loop of the culture. The inoculated flasks were incubated on rotary shaker (150 rpm) at 35ºC for 24 h. This was used as inoculum (1.0 mL contained 6 X 10⁵ viable cells) for all the experiments. After 24 h of cultivation, cells were harvested by centrifugation at 10,000 rpm at 4ºC for 15 min, washed aseptically with sterile distilled water and re-suspended into 1 L Erlenmeyer flasks containing 400 mL of production medium containing (g/L): NH4Cl 1.0,
NaHCO3 0.5, KH2PO4 2.0, Na2 HPO4. 2H2O 2.0,
MgSO4.7H2O 0.5, CaCl2. 2H2O 0.01, Fe (NH4)
citrate 0.05, trace elements solution: 5.0 mL of the
solution (containing ZnSO4.7H2O 0.08,
MnCl2.4H2O 0.03, H3BO3 0.3, CoCl2.6H2O 0.2,
CuCl2.2H2O 0.01, NiCl2.6H2O 0.02, Na2
MoO4.2H2O 0.03). Sugarcane molasses was added
as the sole carbon source at a concentration of 2%. The culture medium was inoculated with 2% of the seed culture and incubated on rotary shaker at 150 rpm at 35°C for 72 h. The pH was maintained at 7.0 by the manual addition of NaOH (10%), or HCl (10%) (Sharma et al. 2007).
Factors affecting PHA accumulation Carbon Source
(a) Centrifugation: Cane molasses was mixed with an equal quantity of double-glass distilled water. The diluted mixture was kept at 40°C for 5 h followed by centrifugation at 2000 rpm for 10 min. The clarified liquid was used for all the pretreatment methods.
(b) Sulfuric acid treatment: The pH of molasses was adjusted to 3.0 by adding 0.1N H2SO4
and the solution was allowed to stand for 1.5 h and then centrifuged at 3000 rpm for 15
min. The supernatant was used for
fermentation and stored at 4°C for further use. (c) Tricalcium phosphate treatment: The pH of molasses was adjusted tov7.0 by the addition of 0.1N NaOH and treated with 2% (w/v)
tricalcium phosphate, followed by
autoclaving at 105°C for 5 min. The mixture was cooled and centrifuged at 3000 rpm for 15 min. The insoluble matter was discarded (Gazaerly 1983).
The fermentation was carried out in 250 mL Erlenmeyer flasks containing 100 mL production medium. Effects of different concentrations of acid treated molasses (2, 4, 6, 8 and 10 %) were studied. The flasks were inoculated with 2.0 mL inoculum and incubated at 35ºC using rotary shaker (150 rpm) for 120 h. For each concentration, samples (10 mL) in triplicates were taken from the growing cultures periodically every 24 h under aseptic conditions for biomass and PHA quantification.
Addition of ethanol
Effect of addition of lower alcohols such as ethanol at different concentration (0, 1, 2, 3, 4 and 5%) on growth and PHA production was studied.
Nitrogen source
To study the effect of different nitrogen sources on PHA production, ammonium chloride was replaced by nineteen sources of nitrogen such as yeast extract, peptone, malt extract, beef extract, casein, protease peptone, soybean meal, corn steep liquor, urea, ammonium sulphate, ammonium nitrate, ammonium oxalate, di ammonium hydrogen phosphate, ammonium molybidate, sodium nitrate, potassium nitrate, asparagin, cystein and glycine. The amount of nitrogen compound added was calculated to give the same nitrogen concentration as the original source. Effect of different concentrations of the best N
source viz., 0.5, 1.0, 1.5, 2.0, 2.5 and 3.0 g/L, were also investigated.
Salts
Different KH2PO4 and Na2HPO4.2H2O
concentrations (1, 2, 3, 4 and 5 g/L) were added separately to the production medium. Also, different concentrations of MgSO4 (0.1- 0.6 g/L)
and CaCl2.2H2O (0.01-0.05 g/L) were used to
determine the most promising concentration for PHA production. Samples were taken after 96 h of incubation in order to determine the bacterial growth and the accumulated PHA.
Inoculum size
The effect of inoculum size on the growth and PHA production by B. subtilis and E. coli was studied by varying inoculum size from 2 to 10% of the inoculum prepared as described above.
pH
Different initial pH of the medium (5.0 to 9.0) was used to check whether pH has any effect on PHA production. The initial pH of the medium was adjusted by 1N hydrochloric acid, or sodium hydroxide.
Incubation temperature
Fermentation was carried out at different temperature viz. 20, 25, 30, 35 and 40°C and after 96 h of incubation, growth and PHA production were determined.
Analytical procedures Cell growth
Cell growth was monitored by measuring the optical density at 600 nm using spectrophotometer (UV-VIS Double Beam PC, Labomed INC). Ten milliliter culture medium was centrifuged at 10,000 rpm, 4°C for 15 min and the cell pellet was washed with 10 mL distilled water. The cell pellet was harvested by centrifugation and dried at 105°C for 48 h, or till constant weight was obtained (Naheed et al. 2012). Cell mass concentration was determined by the standard calibration curve between OD600 and cell dry
weight.
Quantification of polyhydroxyalkanoates
added to the dried biomass pellet and mixed well. The mixtures were incubated at 37°C for 1 h. The solids were recovered by centrifugation at 10,000 rpm for 15 min and washed with 10 mL of acetone. The contents were then centrifuged, washed with 10 mL distilled water and centrifuged again to obtain the pellet. Ten millilitre of chloroform was then added to the pellet and dried at 50°C for 12 h following with 105°C for 48 h. PHA yiled was calculated as follows: PHA% = (weight of PHA / dry cell weight) × 100. The experiments were performed in three replicates.
Fourier Transform Infrared (FTIR) analysis
The chemical structure of the extracted
polyhydroxyalkanoates was analyzed by Fourier transform infrared spectroscopy. The biopolymer was dissolved in chloroform and added to KBr pellets and then the solvent was evaporated. The infrared spectra of the samples were recorded in the wave number range from 400 to 4000 cm−1 using a Perkin Elmer Fourier transform infrared (FTIR) spectrophotometer (Jasco FTIR- 6100, Japan) using KBr disc (Shamala et al. 2003).
RESULTS AND DISCUSSION
Although previous studies have shown that a large number of bacterial species, both Gram positive and Gram negative produce PHA, the sheer diversity of the microbial world calls for the identification of bacteria capable of producing large amounts of PHA utilizing cheap nutrient sources. In the present study, ten contaminated soil samples collected from different ecological areas were used for isolating the PHA producers on nutrient agar medium amended with glucose (1%). In all, 60 representative bacteria were isolated, purified and maintained as pure cultures till further use. The visual screening for PHA production using Sudan Black B showed 25 cultures as PHA positive. PHA producers tend to be stained
dark-blue, or black, while negative PHA accumulators remains white, or light-blue (Lee and Choi 1999). The positive bacteria were assigned the code number depicting the place of their origin. These isolates were quantitatively screened for PHA production and two cultures designated as HL2 and SK1 were selected based on PHA production (data not shown).
In order to confirm the identification of the selected isolates, 16S rRNA gene sequence analysis was performed. The sequence alignment using BLASTN software for the comparison up to 1,500 bp of the analysis gave a high identity of 99% to Bacillus subtilis strain AJ-3 and 98% to
Escherichia coli K-12, respectively.
Molasses being an agro-industrial waste is cheap and easily available substrate may help to cut down the cost of PHA production. Molasses has very high sugar content (54%, w/w), comprising sucrose (62%) and fructose (38%) (Albuquerque et al. 2007). It contains trace elements and vitamins such as thiamine, riboflavin, pyridoxine and niacinamide (Rodrigues et al. 2006). In view of all these, molasses was used in the present study as a carbon source for the production of PHA by B. subtilis and E. coli.
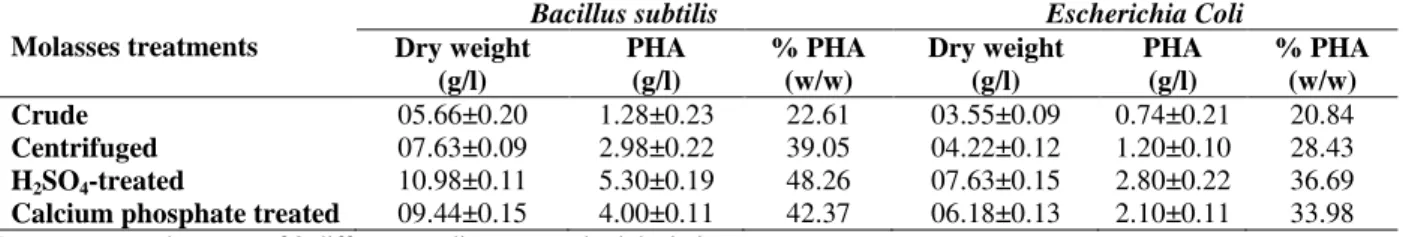
Table 1 showed that B. subtilis and E. coli produced satisfactory amounts of PHA on molasses medium (crude or treated). It was observed that the acid treated molasses gave the highest dry cell mass (10.98 and 7.63 g/L, for B. subtilis and E. coli, respectively) in comparison with crude, centrifuged and calcium phosphate treated molasses. The highest PHA contents were 5.3 and 2.8 g/L, respectively obtained using acid treated molasses. Gazaerly (1983) found that the removal of the mud from molasses reduced the concentration of both Zn and Cu elements by about 25%. Helal (1986) found that when molasses was clarified by H2SO4 and added into
the fermentation medium as a sole carbon source, it increased the dry weight yield with a little decrease in the nitrogen content.
Table 1 - PHA production by Bacillus subtilis and Escherichia coli as affected by different treatments of molasses as a carbon source.
Molasses treatments
Bacillus subtilis Escherichia Coli
Dry weight (g/l)
PHA (g/l)
% PHA (w/w)
Dry weight (g/l)
PHA (g/l)
% PHA (w/w) Crude 05.66±0.20 1.28±0.23 22.61 03.55±0.09 0.74±0.21 20.84
Centrifuged 07.63±0.09 2.98±0.22 39.05 04.22±0.12 1.20±0.10 28.43
H2SO4-treated 10.98±0.11 5.30±0.19 48.26 07.63±0.15 2.80±0.22 36.69
Calcium phosphate treated 09.44±0.15 4.00±0.11 42.37 06.18±0.13 2.10±0.11 33.98
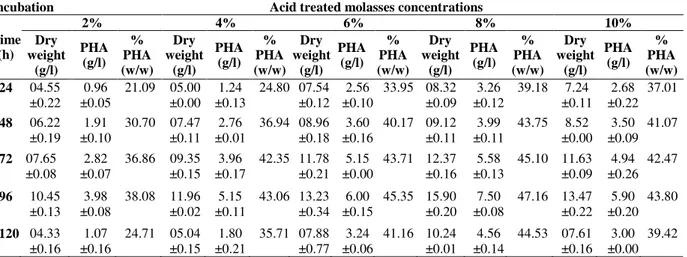
Tables 2 and 3 indicated that the increase in molasses concentration improved the growth of both the strains. Generally, B. subtilis showed better growth as compared to E. coli. Thus, B. subtilis was better adopted to grow and use the nutrients of molasses. The amount of PHA accumulated followed a similar pattern to the growth for each of treatment, indicating a growth-related production where the final amount of PHA
obtained depended on maximum biomass
produced. The maximum PHA production (54.1 and 47.16%) were recorded at 96 h cultivation in the medium using 6 and 8% molasses for B. subtilis and E. coli, respectively and decreased thereafter (Tables 2 and 3). This reduction might be due to the inhibitory effect of high concentration of PHA, decay in enzyme system responsible for the biosynthesis of PHA, nutrients depletion as well as cells consumption of PHA as a carbon source (Flora et al. 2010).
Table 2 - Time-course analysis of PHA production by Bacillus subtilis using different concentrations of acid treated molasses during 120 h of incubation at 35oC using shake flasks as a batch culture.
Incubation Acid treated molasses concentrations
Time (h)
2% 4% 6% 8% 10%
Dry weight (g/l) PHA (g/l) % PHA (w/w) Dry weight (g/l) PHA (g/l) % PHA (w/w) Dry weight (g/l) PHA (g/l) % PHA (w/w) Dry weight (g/l) PHA (g/l) % PHA (w/w) Dry weight (g/l) PHA (g/l) % PHA (w/w) 24 07.63
±0.14 2.11 ±0.03
27.65 08.36 ±0.01
3.44 ±0.06
41.14 13.36 ±0.29
6.30 ±0.50
47.15 10.00 ±0.15
2.90 ±0.40
29.00 09.90 ±0.30
1.37 ±0.00
13.83
48 10.09 ±0.16
3.06 ±0.00
30.32 10.77 ±0.03
4.64 ±0.02
46.79 14.84 ±0.22
7.30 ±0.00
49.19 15.03 ±0.12
5.06 ±0.30
33.66 11.26 ±0.70
3.09 ±0.08
27.44
72 10.98 ±0.19
5.32 ±0.12
48.45 13.99 ±0.01
6.88 ±0.09
49.17 21.18 ±0.15
10.89 ±0.60
51.41 20.43 ±0.08
8.54 ±0.00
41.80 17.22 ±0.80
6.70 ±0.14
38.90
96 13.99 ±0.08
6.97 ±0.19
49.82 15.95 ±0.22
8.00 ±0.03
50.15 22.88 ±0.29
12.38 ±0.29
54.10 19.37 ±0.04
6.98 ±0.30
36.03 15.43 ±0.90
5.24 ±0.13
33.95
120 11.40 ±0.02
3.69 ±0.17
32.36 11.96 ±0.08
5.96 ±0.01
49.83 15.68 ±0.18
7.90 ±0.13
50.38 15.71 ±0.24
5.08 ±0.20
32.33 12.93 ±0.00
3.35 ±0.29
25.90 Data represent the mean of 3 different readings ± standard deviation.
Table 3 - Time-course analysis of PHA production by Escherichia coli using different concentrations of acid treated molasses during 120 h of incubation at 35oC using shake flasks as a batch culture.
Incubation Acid treated molasses concentrations
Time (h)
2% 4% 6% 8% 10%
Dry weight (g/l) PHA (g/l) % PHA (w/w) Dry weight (g/l) PHA (g/l) % PHA (w/w) Dry weight (g/l) PHA (g/l) % PHA (w/w) Dry weight (g/l) PHA (g/l) % PHA (w/w) Dry weight (g/l) PHA (g/l) % PHA (w/w) 24 04.55
±0.22 0.96 ±0.05
21.09 05.00 ±0.00 1.24 ±0.13 24.80 07.54 ±0.12 2.56 ±0.10
33.95 08.32 ±0.09
3.26 ±0.12
39.18 7.24 ±0.11
2.68 ±0.22
37.01
48 06.22 ±0.19
1.91 ±0.10
30.70 07.47 ±0.11 2.76 ±0.01 36.94 08.96 ±0.18 3.60 ±0.16
40.17 09.12 ±0.11
3.99 ±0.11
43.75 8.52 ±0.00
3.50 ±0.09
41.07
72 07.65 ±0.08
2.82 ±0.07
36.86 09.35 ±0.15 3.96 ±0.17 42.35 11.78 ±0.21 5.15 ±0.00
43.71 12.37 ±0.16
5.58 ±0.13
45.10 11.63 ±0.09
4.94 ±0.26
42.47
96 10.45 ±0.13
3.98 ±0.08
38.08 11.96 ±0.02 5.15 ±0.11 43.06 13.23 ±0.34 6.00 ±0.15
45.35 15.90 ±0.20
7.50 ±0.08
47.16 13.47 ±0.22
5.90 ±0.20
43.80
120 04.33 ±0.16
1.07 ±0.16
24.71 05.04 ±0.15 1.80 ±0.21 35.71 07.88 ±0.77 3.24 ±0.06
41.16 10.24 ±0.01
4.56 ±0.14
44.53 07.61 ±0.16
3.00 ±0.00
39.42 Data represent the mean of 3 different readings ± standard deviation.
When the molasses medium was supplemented with ethanol, there was a stimulatory effect on the growth and PHA production. At the addition of 1.0% ethanol, the highest biomass yield (33.29 for B. subtilis and 18.54 g/L for E. coli) and the
concentration in the medium disturbed the bacterial metabolism and inoculum morphology, which resulted in decreasing in PHA production by the tested strains (Haq et al. 2003). The stimulating effect of ethanol on PHA production suggested that ethanol could be used as an additional cheap carbon source to be converted into PHA. One of the effects of ethanol is to increase the permeability of the cell membrane and, thus the secretion of PHA. Ethanol also greatly increases the tolerance levels of manganese, iron, and zinc far above those required for the cell growth. This provides the medium improved nutritional balance (Nadeem et al. 2010).
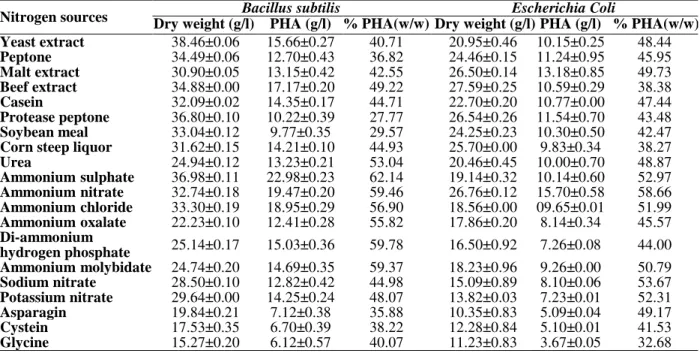
Next to the carbon, nitrogen source has to be controlled as nitrogen served as precursor for vitamins, amino acids and growth factors (Saranya
and Shenbagarathai 2010). As evident from Table 4, ammonium sulphate was the best supporter for the growth and PHA production by B. subtilis as it increased the cell dry mass and PHA production up to 36.98 and 22.98 g/L, respectively. However, in case of E. coli, ammonium nitrate supported the highest growth and PHA production, which were 26.76 and 15.70 g/L, respectively. Beaulieu et al. (1995) reported that the presence of inorganic chemicals such as ammonia, or ammonium salts as a source of nitrogen is an important requirement during the growth phase in order to maximize the concentration of biomass responsible for the accumulation of PHA. Wang and Lee (1997) reported that ammonia was used as the critical control factor for uncoupling the growth of the cells and PHA production.
Table 4 - PHA accumulations by Bacillus subtilis and Escherichia coli as affected by different nitrogen sources after 96 h of incubation at 35°C at pH 7.0 under shaking condition of growth.
Nitrogen sources Dry weight (g/l) PHA (g/l) % PHA(w/w) Dry weight (g/l) PHA (g/l) % PHA(w/w)Bacillus subtilis Escherichia Coli Yeast extract 38.46±0.06 15.66±0.27 40.71 20.95±0.46 10.15±0.25 48.44
Peptone 34.49±0.06 12.70±0.43 36.82 24.46±0.15 11.24±0.95 45.95
Malt extract 30.90±0.05 13.15±0.42 42.55 26.50±0.14 13.18±0.85 49.73
Beef extract 34.88±0.00 17.17±0.20 49.22 27.59±0.25 10.59±0.29 38.38
Casein 32.09±0.02 14.35±0.17 44.71 22.70±0.20 10.77±0.00 47.44
Protease peptone 36.80±0.10 10.22±0.39 27.77 26.54±0.26 11.54±0.70 43.48
Soybean meal 33.04±0.12 9.77±0.35 29.57 24.25±0.23 10.30±0.50 42.47
Corn steep liquor 31.62±0.15 14.21±0.10 44.93 25.70±0.00 9.83±0.34 38.27
Urea 24.94±0.12 13.23±0.21 53.04 20.46±0.45 10.00±0.70 48.87
Ammonium sulphate 36.98±0.11 22.98±0.23 62.14 19.14±0.32 10.14±0.60 52.97
Ammonium nitrate 32.74±0.18 19.47±0.20 59.46 26.76±0.12 15.70±0.58 58.66
Ammonium chloride 33.30±0.19 18.95±0.29 56.90 18.56±0.00 09.65±0.01 51.99
Ammonium oxalate 22.23±0.10 12.41±0.28 55.82 17.86±0.20 8.14±0.34 45.57
Di-ammonium
hydrogen phosphate 25.14±0.17 15.03±0.36 59.78 16.50±0.92 7.26±0.08 44.00 Ammonium molybidate 24.74±0.20 14.69±0.35 59.37 18.23±0.96 9.26±0.00 50.79
Sodium nitrate 28.50±0.10 12.82±0.42 44.98 15.09±0.89 8.10±0.06 53.67
Potassium nitrate 29.64±0.00 14.25±0.24 48.07 13.82±0.03 7.23±0.01 52.31
Asparagin 19.84±0.21 7.12±0.38 35.88 10.35±0.83 5.09±0.04 49.17
Cystein 17.53±0.35 6.70±0.39 38.22 12.28±0.84 5.10±0.01 41.53
Glycine 15.27±0.20 6.12±0.57 40.07 11.23±0.83 3.67±0.05 32.68
Data represent the mean of 3 different readings ± standard deviation.
It has been reported that PHA production is enhanced under limiting conditions of nitrogen and phosphorus/ sulfur (Verlinden et al. 2007). In the present study, the negative effect of increased concentrations of nitrogen sources on the growth and PHA production by B. subtilis and E. coli was studied by the addition of various concentrations (0.5 - 3.0 g/L) of ammonium sulphate and ammonium nitrate. Ammonium sulphate and ammonium nitrate at a concentration of 1 g/L
supported the PHA production, which was 62.21 and 58.70% for B. subtilis and E. coli, respectively. Beyond these concentrations, PHA
production by the two strains decreased
drastically. Thus, nutrient limitation is necessary to trigger the PHA accumulation.
required for the cell growth. On this study, the maximum PHA production by B. subtilis and E. coli (23.11 and 15.74 g/L, respectively) was recorded in the presence of 2 g/L of KH2PO4 and
Na2HPO4.2H2. Beyond these concentrations, both
the growth and PHA production decreased drastically by the two strains.
As far the effect of other mineral salts, MgSO4 and
CaCl2 had no effect either on cellular growth, or
PHA concentration by B. subtilis and E. coli. The results were in agreement with those of Nikel et al. (2005) who reported that MgSO4.7H2O (1- 10
mm) and trace elements solution (1-20 mL/L) did
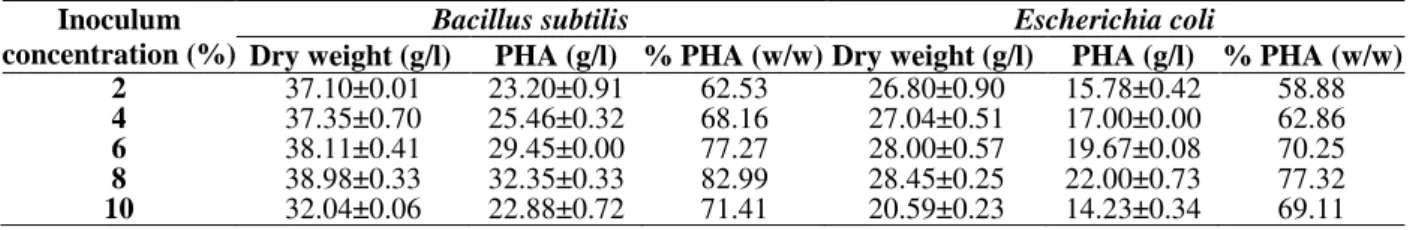
not affect PHA production in mineral medium. The present results showed that the increase in the molasses concentration with the addition of salts provided better nutrition and improved the growth and PHA production by B. subtilis and E. coli. The effects of inoculum concentration on the growth and PHA production by the two strains are shown in Table 5. The amount of PHA
accumulated by increasing the inoculum
concentration up to 8% reached 82.99 and 77.32% for B. subtilis and E. coli, respectively. Further increase in the inoculum size decreased PHA contents and cell growth.
Table 5 - Effect of inoculum concentration on dry cell mass and PHA production by Bacillus subtilis and
Escherichia coli
Inoculum concentration (%)
Bacillus subtilis Escherichia coli
Dry weight (g/l) PHA (g/l) % PHA (w/w) Dry weight (g/l) PHA (g/l) % PHA (w/w) 2 37.10±0.01 23.20±0.91 62.53 26.80±0.90 15.78±0.42 58.88
4 37.35±0.70 25.46±0.32 68.16 27.04±0.51 17.00±0.00 62.86
6 38.11±0.41 29.45±0.00 77.27 28.00±0.57 19.67±0.08 70.25
8 38.98±0.33 32.35±0.33 82.99 28.45±0.25 22.00±0.73 77.32
10 32.04±0.06 22.88±0.72 71.41 20.59±0.23 14.23±0.34 69.11
Data represent the mean of 3 different readings ± standard deviation.
Studies on the effect of pH of the medium on PHA production showed that the medium with initial pH of 7.0 gave the maximum production of PHA (83.56 and 77.94% by B. subtilis and E. coli, respectively). pH 7.0, being neutral, is the most favorable pH for bacterial growth and hence, would have contributed to higher PHA production. Tavernier et al. (1997) reported a decrease in PHA content in the medium with an acidic pH. Change in initial pH of the medium showed a strong influence on the production of PHA, which seemed to be due to the effect of initial pH on the bioavailability of trace elements.
Studies on the effect of temperature on the growth and PHA production by B. subtilis and E. coli showed 35oC as the optimum temperature for both the strains. At lower and higher temperatures, the growth and PHA production were sharply decreased.
It was interesting to note that the optimization of medium composition by B. subtilis and E. coli improved PHA yields about 4-fold as compared to un-optimized medium.
Downstream processing
In addition to the costs of maintaining pure
FTIR analysis
Fourier transform infrared (FTIR) spectroscopy is a routine chemical technique used to study the molecular structure (Naumann et al.1991). The IR spectrum of a sample represents its total chemical composition, because every chemical compound in the sample makes its own distinct contribution to the absorbance spectrum. The distinctness of an individual spectrum, which is determined by the chemical structure of each component and the degree to which each component contributes to the spectrum, is directly related to the concentrations of the components of the sample. FTIR spectroscopy also has the following advantages: very small samples are required (0.4 mg of biomass), speed (analysis time, 30 min), no
solvent is required and minimal sample
manipulation is required (Hong et al. 1999). IR
spectroscopy can thus provide a total,
simultaneous chemical analysis.
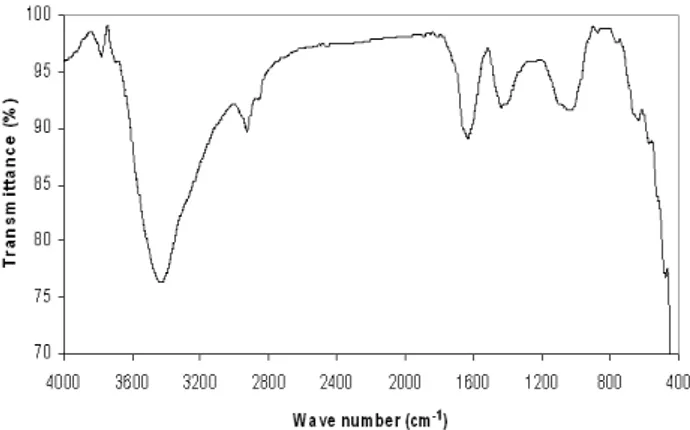
In the present study, FT-IR spectroscopy was performed between frequency ranges of 4000- 400 cm−1 to analyze the functional groups .The polymers extracted showed the intense absorption at 3427 and 3428 cm-1 for O-H bending group (Fig 1 and 2). Other adsorption bands at 2925 and 2934 cm-1 for C-H stretching group were observed. IR spectra of the polymers revealed the presence of marked peaks at wave numbers 1631 and 1644 cm-
1
representing the presence ester carbonyl (C=O) stretching groups in comparison with the standard polyhydroxybutyrate (Hong et al. 1999). Other adsorption bands at 1437 and 1411-1440 cm-1, were observed for -CH3 group. Other bands
recorded at 1026 and 1036 cm-1 are generally known to be typical characteristics of all sugar derivatives such as guluronic acid, manuronic acid and uronic acid (Suh et al. 1997). The small absorption band at 875 and 872 cm-1could be associated with β-glycosidic linkages between the sugar monomers, as suggested by Gupta et al. (1987).
On the basis of data obtained in the present work,
B. subtilis and E. coli capable of PHA
accumulation to more than 70% of dry cell weight could be employed for industrial application after the optimization of the conditions of PHA synthesis.
Figure 1 - Fourier transform infrared spectra analysis of PHA produced by Bacillus subtilis.
Figure 2 - Fourier transform infrared spectra analysis of PHA produced by Escherichia coli.
REFERENCES
Albuquerque MG, Eiroa M, Torres C, Nunes BR, Reis BR. Strategies for the development of a side stream process for polyhydroxyalkanoate PHA production from sugar cane molasses. J Biotechnol. 2007; 130: 411-421.
Altschul SF, Thomas LM, Alejandro AS, Zhang J, Zhang Z, Miller W, Lipman DJ. Gapped BLAST and PSI-BLAST: a new generation of protein database search programs. Nucleic Acids Res.1997;17: 3389-3402.
Braunegg G, Lefebvre G, Genser K. Polyhydroxyalkanoates, biopolyesters from renewable resources: physiological and engineering aspects. J Biotechnol. 1998; 65:127-161.
Castilho LR, Mitchell DA , Freire DM. Production of polyhydroxyalkanoates PHAs from waste materials and by-products by submerged and solid-state fermentation. Bioresource Technol. 2009; 100: 5996-6009.
Chen GQ. Amicrobial polyhydroxyalkanoates PHA based bio- and materials industry. Chem Soc Rev. 2009; 38: 2434-2446.
Flora GD, Bhatt K, Tuteja U. Optimization of culture conditions for polyhydroxybutyrate production from isolated Bacillus species. J Cell Tissue Res. 2010; 102: 2235-2242.
Gazaerly MA. The utilization of beet molasses for single cell protein production [M Sc Thesis]. Botany Department, Faculty of Science, Alexandria University, Egypt; 1983.
Gupta S, Madan RN, Bansal MC. Chemical composition of Pinus caribaea hemicellulose. TAPPI J. 1987; 70:113-114.
Halami PM. Production of polyhydroxyalkanoate from starch by the native isolate Bacillus cereus CFR06.
World J Microbiol Biotechnol. 2008; 24: 805-812. Haq I, Ali S, Qadeer MA, Javed I. Stimulatory effect of
alcohols methanol and ethanol on citric acid productivity by a 2-deoxy D-glucose resistant culture of Aspergillus niger GCB-47. Bioresource Technol. 2003; 86: 227-233.
Hazer B, Steinbuchel A. Increased diversification of polyhydroxyalkanoates by modification reactions for industrial and medical applications. Appl Microbiol Biotechnol. 2007; 74: 1-12.
Helal GA. Protein and fats from halophilic fungi [Ph D Thesis]. Department of Botany, Faculty of Science, Zagazig University, Egypt; 1986.
Hong K, Sun S, Tian W, Chen GQ, Huang W. A rapid method for detecting bacterial polyhydroxyalkanoates in intact cells by Fourier Transform Infrared Spectroscopy. Appl
Microbiol Biotechnol. 1999; 51: 523-526.
Kalia VC, Chauhan A, Bhattacharyya G , Rashmi P. Genomic data-bases yield novel bioplastic producers.
Nat Biotechnol. 2003; 21:845-846.
Kemavongse K, Prasertsan P, Upaichit A, Methacanon P. Poly-β-hydroxylkanoate production by halotolerant
Rhodobacter sphaeroides U7. World J Microbiol Biotechnol. 2008; 24: 2073-2085.
Lee SY, Choi J. Polyhydroxyalkanoates: Biodegradable Polymer. In: Arnold L, Demain J, Davis E, editor. Manual of industrial microbiology and biotechnology, American Society for Microbiology, Washington; 1999. p. 616-627.
Nadeem A, Syed Q, Baig S, Irfan M , Nadeem M. Enhanced production of citric acid by Aspergillus niger M-101 using lower lcohols. Turk J Biochem. 2010; 35:7-13.
Naheed N, Jamil N, Hasnain S , Abbas G. Biosynthesis of polyhydroxybutyrate in Enterobacter sp. SEL2 and Enterobacteriaceae bacterium sp. PFW1 using sugar cane molasses as media. Afr J Biotechnol. 2012; 11: 3321-3332.
Naumann D, Helm D, Labischinski H. Microbiological characterization by FTIR spectroscopy. Nature. 1991; 351:81-82.
Nikel PI, Pettinari MJ, Mendez BS, Galvagno MA. Statistical optimization of a culture medium for biomass and poly3-hydroxybutyrate production by recombinant Escherichia coli strain using agroindustrial by products. Int Microbiol. 2005; 8: 243-250.
Rochelle PA, Will JA, Fry JC, Jenkins GJ, Parkes RJ, Turley CM, Weightman AJ. Extraction and amplification of 16S rRNA genes from deep marine sediments and seawater to assess bacterial community Diversity. In: Trevors JT, van Elsas JD, editor. Nucleic Acids in the Environment, Springer. Berlin ; 1995. p. 219-239.
Rodrigues LR, Teixeira JA, Oliveira R. Low-cost fermentative medium for biosurfactant production by probiotic bacteria. Biochem Eng J. 2006; 32:135-142. Ryu HW, Hahn SK, Chang YK, Chang HN. Production
of poly3-hydroxybutyrate by high cell density fed-batch culture of Alcaligenes eutrophus with phosphate limitation. Biotechnol Bioengin. 1997; 55: 27-32.
Saranya V, Shenbagarathai R. Effect of nitrogen and calcium sources on growth and production of PHA of
Pseudomonas sp. LDC-5 and it’s mutant. Curr Res J Biol Sci. 2010; 23:164-167.
Shamala TR, Chandrashekar A, Vijayendra SV, Kshama L. Identification of polyhydroxyalkanoate PHA producing Bacillus spp. using the polymerase chain reaction. J Appl Microbiol. 2003; 94: 369-374. Sharma L, Kumar A, Panda B, Mallick BN. Process
optimization for poly 5-hydroxybutyrate production in a nitrogen fixing cyanobacterium, Nostoc muscorum using response surface. Bioresource Technol. 2007; 98: 987-993.
Steinbuchel A. PHB and Other Polyhydroxyalkanoic Acids. In: Biotechnology, Rehm HJ, Reed G, editor. VCH, New York; 1996. p. 403-464.
Suh HH, Kwon GS, Lee CH, Kim HS, Oh HM , Yoon BD. Characterization of bioflocculant produced by
Tavernier P, Portais JC, Saucedo JEN, Courtois J, Courtois B , Barbotin JN. Exopolysaccharide and poly-β-hydroxybutyrate coproduction in two
Rhizobium meliloti strains. Appl Environ Microbiol. 1997; 63: 21-26.
Thomsen MH. Complex media from processing of agricultural crops for microbial fermentation. Appl Microbiol Biotechnol. 2005; 68: 598-606.
Verlinden RA, Hill DJ, Kenward MA, Williams CD, Radecka I. Bacterial synthesis of biodegradable polyhydroxyalkanoates. J Appl Microbiol. 2007; 102: 1437-1449.
Wang F, Lee SY. Poly3-Hydroxybutyrate production with high productivity and high polymer content by a fed-batch culture of Alcaligenes latus under nitrogen limitation. Appl Environ Microb. 1997; 63: 3703-3706.