Impact of carbon/nitrogen feeding strategy on
polyhydroxyalkanoates production using mixed
microbial cultures
Orientador: Dr. Mauro Majone, Professor catedrático do
Departamento de Química da Universidade de
Roma
Co-orientadoras: Dra. Maria Ascensão Reis, Professora catedrática
do Departamento de Química da Universidade
Nova de Lisboa
Dra. Marianna Villano, Professora auxiliar do
Departamento de Química da Universidade de
Roma
Dezembro de 2015
Fernando Ramos Silva
Licenciado em BioquímicaDissertação para obtenção do Grau de Mestre em Biotecnologia
Júri:
Presidente: Dr. Pedro Miguel Calado Simões Vogais: Dra. Catarina Silva Simão de Oliveira
iii
Impact of carbon/nitrogen feeding strategy on polyhydroxyalkanoates production using mixed microbial cultures
v
Acknowledgments
Firstly, I would like to thank both Dr. Maria Ascensão Reis and Dr. Mauro Majone, for providing me the fantastic opportunity to work on this project which would have not been possible without you.
I am also grateful to Dr. Marianna Villano, Sabrina Campanari and Stefania Matteo for the scientific guidance, welcoming and supporting me during my stay. Besides, I would like to acknowledge all other members of the Lab 026, for their kind support and friendship.
I would like to thank my dear parents and my beloved girlfriend, Rita, to whom I dedicate this thesis. I’m
forever grateful to you, for your infinitive support and love and for always being there for me. I am also grateful to all my friends for all the support and good moments shared over the years.
vii
Resumo
A produção de polihidroxialcanoatos (PHAs) usando culturas microbianas mistas (MMC) requer um processo multi-stage, envolvendo a selecção de organismos acumuladores de PHA, e é frequentemente feito num reactor descontínuo sequencial (SBR). Como os feedstocks renováveis de baixo custo geralmente têm um baixo conteúdo de azoto, a adição de azoto é necessária durante a fase de selecção para promover o crescimento celular. Assim sendo, foi avaliada nesta dissertação a possibilidade de alimentar as fontes de carbono e azoto separadamente. Para além disso, três rácios COD:N distintos (100:3.79, 100:3.03 e 100:2.43) foram testados, permitindo a análise dos mesmos na performance do SBR.
Para cada reactor, uma mistura de ácidos acético e propiónico com uma carga orgânica de 8.5 gCOD L-1 d-1 foi usada como fonte de carbono, e o sulfato de amónio foi usado como fonte azoto num SBR à escala laboratorial, com um volume de 1 L – o tempo de retenção das lamas foi de 1 d, e a duração do ciclo de 6 h. A estratégia de alimentação estudada resultou numa melhoria significativa da pressão selectiva para organismos acumuladores de PHA, bem como na duplicação de PHA produzido (até cerca de 1.3 gCOD L-1). Uma resposta de acumulação elevada foi observada nos dois reactores com COD:N mais reduzido, enquanto o rácio mais elevado resultou numa fraca prestação em termos de produção de polímero. De facto, a forte limitação de azoto levou ao crescimento de fungos, e a uma baixa capacidade de armazenamento pelos microorganismos presentes. O rácio de COD:N afectou também a composição do polímero, pois o poli(3-hidroxibutirato-co-3-hidroxivalerato) (PHBV) produzido, apresentou um conteúdo de HV variável (1-20 %, w/w) nos três reactores, sendo menor para rácios de COD:N maiores. Este resultado sugere a possibilidade de usar o rácio COD:N como ferramenta para alterar o conteúdo de HV, sem no entanto alterar a composição do feedstock.
Palavras-chave: Ácidos gordos voláteis, culturas microbianas mistas, polihidroxialcanoatos, rácio
ix
Abstract
Polyhydroxyalkanoates (PHA) production using mixed microbial cultures (MMC) requires a multi-stage process involving the microbial selection of PHA-storing microorganisms, typically operated in sequencing batch reactors (SBR), and an accumulation reactor. Since low-cost renewable feedstocks used as process feedstock are often nitrogen-deficient, nutrient supply in the selection stage is required to allow for microbial growth. In this context, the possibility to uncouple nitrogen supply from carbon feeding within the SBR cycle has been investigated in this study. Moreover, three different COD:N ratios (100:3.79, 100:3.03 and 100:2.43) were tested in three different runs which also allowed the study of COD:N ratio on the SBR performance.
For each run, a synthetic mixture of acetic and propionic acids at an overall organic load rate of 8.5 gCOD L-1 d-1 was used as carbon feedstock, whereas ammonium sulfate was the nitrogen source in a lab-scale sequence batch reactor (SBR) with 1 L of working volume. Besides, a sludge retention time (SRT) of 1 d was used as well as a 6 h cycle length. The uncoupled feeding strategy significantly enhanced the selective pressure towards PHA-storing microorganisms, resulting in a two-fold increase in the PHA production (up to about 1.3 gCOD L-1). A high storage response was observed for the two runs with the COD:N ratios (gCOD:gN) of 100:3.79 and 100:3.03, whereas the lowest investigated nitrogen load resulted in very poor performance in terms of polymer production. In fact, strong nitrogen limitation caused fungi to grow and a very poor storage ability by microorganisms that thrived in those conditions. The COD:N ratio also affected the polymer composition, indeed the produced poly(3-hydroxybutyrate-co-3-hydroxyvalerate) (PHBV) showed a variable HV content (1-20 %, w/w) among the three runs, lessening as the COD:N increased. This clearly suggests the possibility to use the COD:N ratio as a tool for tuning polymer properties regardless the composition of the feedstock.
Keywords: COD:N ratio, feast and famine regime, mixed microbial cultures, polyhydroxyalkanoates,
xi
Table of Contents
Acknowledgments ... v
Resumo ... vii
Abstract ... ix
List of Figures ... xiii
List of Tables ... xv
List of Abbreviations ... xvii
1 INTRODUCTION ... 1
1.1 PHA: Structure, properties and applications ... 1
1.2 Pure cultures ... 4
1.2.1 PHA synthesis ... 5
1.2.2 Granule Formation ... 8
1.3 Mixed Microbial Cultures as an economical alternative ... 8
1.3.1 FF regime ... 9
1.3.2 MMC processes for PHA production ... 10
1.4 The importance of nutrients ... 12
1.5 Polymer Extraction... 13
2 OBJECTIVES ... 15
3 MATERIALS AND METHODS ... 17
3.1 Experimental set-up ... 17
3.1.1 MMC selection in Sequential Batch Reactor (SBR) ... 17
3.1.2 Polymer accumulation in batch reactor ... 19
3.2 Analytical procedures... 20
3.2.1 Suspended solids determination ... 20
3.2.2 PHA determination ... 20
3.2.3 VFA Analysis ... 21
3.2.4 Nitrogen measurement ... 21
3.3 Microscopic observations ... 21
3.3.1 Nile Blue staining ... 21
3.4 Data analysis and calculation of kinetic parameters... 22
4 RESULTS AND DISCUSSION ... 25
4.1 SBR run at 8.5 gCOD L-1 d-1 and 0.26 gN L-1 d-1– N-FAMINE 2 ... 25
4.1.1 SBR Performance ... 25
4.1.2 SBR kinetic test... 32
xii
4.2 SBR run at 8.5 gCOD L-1 d-1 and 0.32 gN L-1 d-1– N-FAMINE 1 ... 38
4.2.1 SBR Performance ... 38
4.3 SBR run at 8.5 gCOD L-1 d-1 and 0.21 gN L-1 d-1– N-FAMINE 3 ... 39
4.3.1 SBR Performance ... 39
4.3.2 SBR kinetic test... 40
4.4 Performance of the SBR under the different investigated operating conditions ... 43
4.4.1 Comparison of the SBR performance with coupled and uncoupled feeding of carbon and nitrogen sources ... 43
4.4.2 Effect of the COD:N ratio on the SBR performance with uncoupled carbon and nitrogen feeding 45 5 CONCLUSIONS AND FUTURE PERSPECTIVES ... 49
xiii
List of Figures
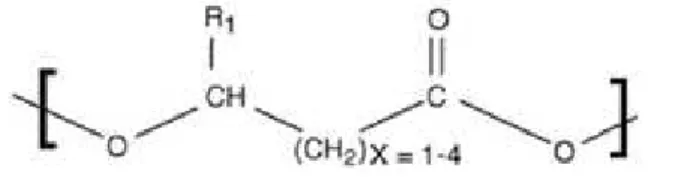
Figure 1.1 – PHA structure where X is the number of carbon atoms in the linear structure of the polymer and R the side chain. Adapted from (Keshavarz & Roy 2010). ... 1 Figure 1.2 – Key metabolic pathways involved in PHA synthesis. As shown, the polymer can be stored through glycolysis (a), de novo fatty acid synthesis (b), β-oxidation of fatty acids (c, d) and alkanes’ oxidation (e). Adapted from (Reis et al. 2011). ... 6 Figure 1.3 – Metabolic pathway which involves both synthesis and breakdown of P(HB). Adapted from (Khanna & Srivastava 2005)... 7 Figure 1.4 – Set of genes that codify the enzymes involved in PHA synthesis in R. eutropha. Adapted from (Luengo et al. 2003). ... 8 Figure 1.5 – Polymer storage under aerobic conditions in a feast and famine regime by MMC. Reprinted from (Reis et al. 2011) ... 11 Figure 3.1 – Layout of the SBR reactor: A – Feed tank; B – peristaltic pump for substrate feeding; C – peristaltic pump for nitrogen feeding; D – nitrogen feed tank; E – withdrawal pump; F – CO2 pump and pH
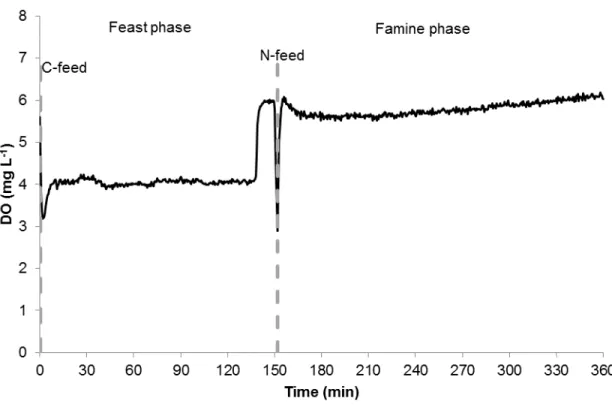
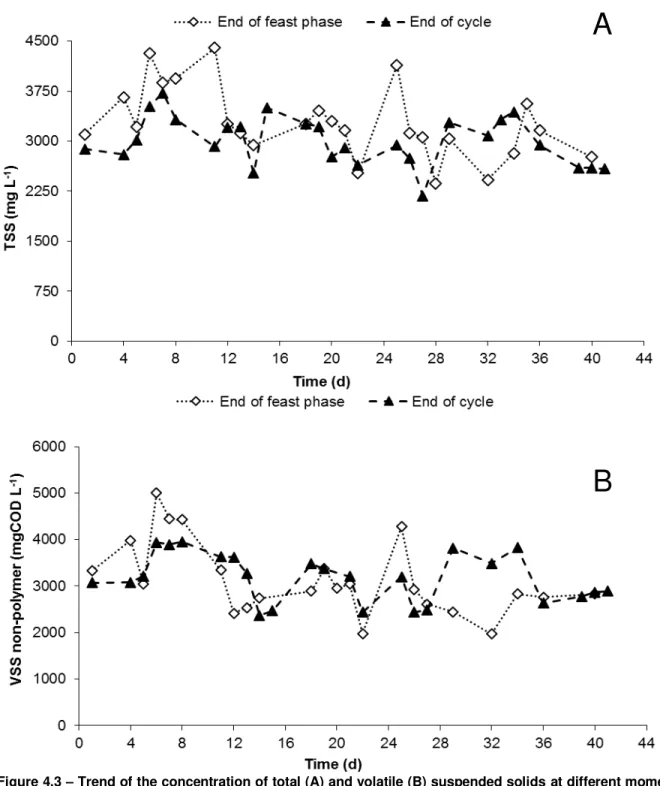
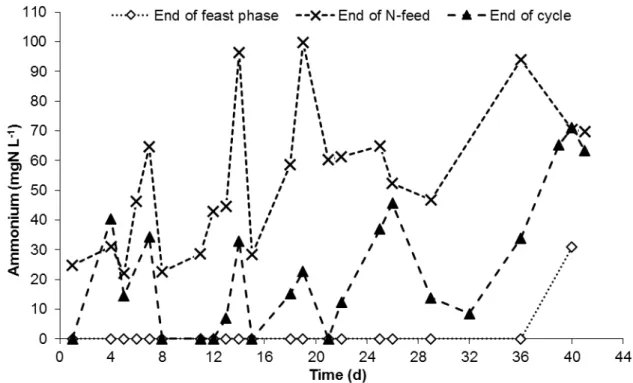
meter; G – air pump; H – mechanical stirrer; I – dissolved oxygen meter; J – reactor vessel; K – thermostatic vessel. ... 18 Figure 3.2 – Layout of the accumulation reactor: A – dissolved oxygen meter; B – air pump; C – pH meter; D – thermostatic bath; E - magnetic stirrer; F – reactor vessel ... 19 Figure 4.1 – Profile of dissolved oxygen concentration during a typical SBR cycle of the N-FAMINE 2 run. ... 26 Figure 4.2 – Feast phase duration of the daily measured cycle over the SBR operation period. ... 26 Figure 4.3 – Trend of the concentration of total (A) and volatile (B) suspended solids at different moments of the SBR cycle, during the entire period of operation of the N-FAMINE 2 run. ... 28 Figure 4.4 – VSS/TSS ratio (A) and non-polymer VSS (B) profiles at different moments of the SBR cycle, during the entire period of operation of the N-FAMINE 2 run. ... 29 Figure 4.5 – PHA concentration at different moments of the SBR cycle, during the entire period of operation of the N-FAMINE 2 run. ... 30 Figure 4.6 – HV content (A) and PHA content in the biomass (B) over the operational period of the SBR in N-FAMINE 2 run. ... 31 Figure 4.7 – Trend of the ammonium concentration over the operational period of the SBR. ... 32 Figure 4.8 – Trend of the concentration of DO and VFA (A) and PHA and ammonium (B) during a SBR kinetic carried out when the reactor was operated at an OLR of 8.5 gCOD L-1 d-1 and a nitrogen load of
0.26 gN L-1 d-1. ... 33
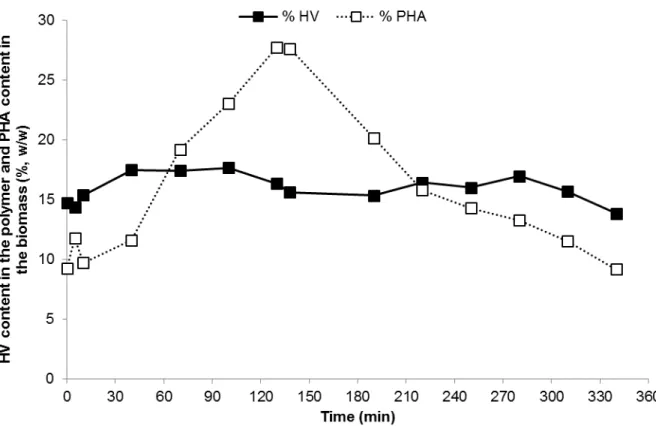
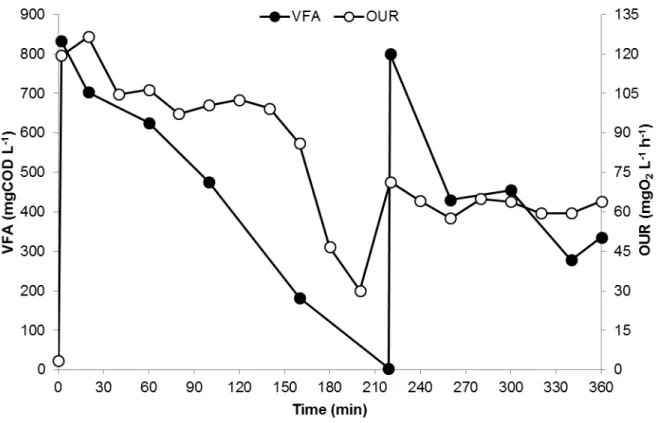
Figure 4.9 – Trend of the HV content in the stored polymer and PHA content in the biomass during a SBR kinetic carried out when the reactor was operated at an OLR of 8.5 gCOD L-1 d-1 and nitrogen load of 0.26 gN L-1 d-1 ... 34 Figure 4.10 – Trend of VFA concentration and OUR throughout a typical kinetic test in the accumulation reactor with the microbial culture selected in the SBR operated at an OLR of 8.5 gCOD L-1 d-1 and nitrogen
load of 0.26 gN L-1 d-1. ... 36
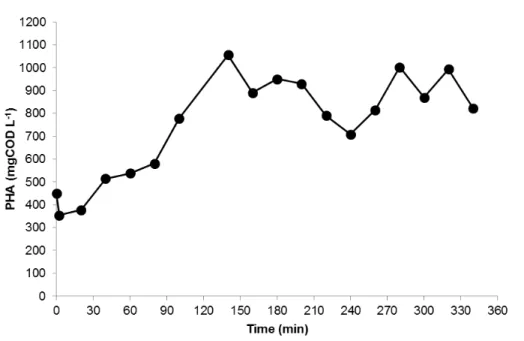
Figure 4.11 – Trend of PHA concentration throughout a typical kinetic test in the accumulation reactor with the microbial culture selected in the SBR operated at an OLR of 8.5 gCOD L-1 d-1 and nitrogen load of 0.26 gN L-1 d-1. ... 37 Figure 4.12 – Trend of PHA content in the biomass and HV content in the polymer throughout a typical kinetic test in the accumulation reactor with the microbial culture selected in the SBR operated at an OLR of 8.5 gCOD L-1 d-1 and nitrogen load of 0.26 gN L-1 d-1. ... 37
xiv Figure 4.14 – Trend of the concentration of PHA and VFA (A) and ammonium (B) during a SBR kinetic carried out when the reactor was operated at an OLR of 8.5 gCOD L-1 d-1 and a nitrogen load equal to
0.21 gN L-1 d-1. ... 41
xv
List of Tables
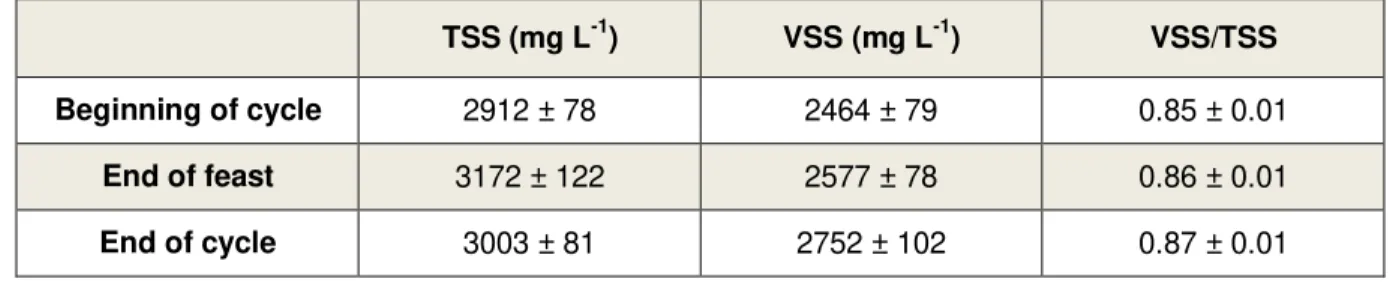
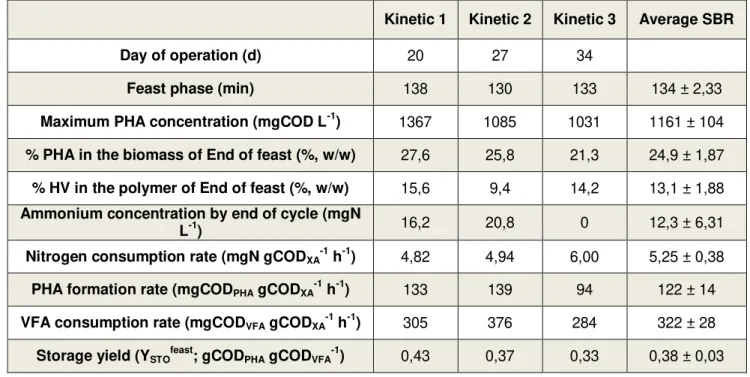
Table 1.1 – Different types of homopolymers and their respective R-groups. These polymers are equivalent to the ones represented in Figure 1.1 with X = 1. Adapted from (Verlinden et al. 2007). ... 2 Table 1.2 – Main properties of different PHA and PP. While PHBV contains 20 % of HV, PHB4B is made of 16 % of 4HB. Adapted from (Verlinden et al. 2007). ... 2 Table 1.3 – Properties of PHBV copolymers with different HV molar composition (adapted from (Loo & Sudesh 2007)). ... 3 Table 1.4 – Summary of some of the operating parameters typically used for MMC selection in PHA-storing organisms. Adapted from (Reis et al. 2011) ... 12 Table 4.1 – Average values of concentration of suspended solids at three different moments of the cycle in the SBR. ... 27 Table 4.2 – Comparison between the 3 SBR kinetics performed in the run operated at an OLR equal to 8.5 gCOD L-1 d-1 and a nitrogen load of 0.26 gN L-1 d-1. ... 35
Table 4.3 – Comparison between the three accumulation kinetics performed in the run operated at an OLR equal to 8.5 gCOD L-1 d-1 and a nitrogen load of 0.26 gN L-1 d-1. Values for PHA content in the
xvii
List of Abbreviations
3-HDD 3-hydroxydodecanoate
3-HO 3-hydroxyoctanoate 4-HA 4-hydroxyalkanoate
5-HA 5-hydroxyalkanoate Acetyl-CoA Acetyl Coenzyme A Acyl-CoA Acyl Coenzyme A
ADF Aerobic dynamic feeding
APME Association of Plastics Manufactures in Europe
ATP Adenosine triphosphate
COD Chemical oxygen demand
CSTR Continuous stirred tank reactor
Da Dalton
DO Dissolved oxygen (mgO2 L-1)
EBPR Enhanced biological phosphorus removal FADH2 Flavin adenine dinucleotide
FDA Food and Drug Administration
FF Feast and famine
FID Flame ionization detector
FSS Fixed suspended solids (mg L-1) GAO Glycogen accumulating organisms GTP Guanosine-5'-triphosphate
HA R-hydroxyalkanoic acid
HB 3-hydroxybutyrate
HHx 3-hydroxyhexanoate
HRT Hydraulic retention time (d)
HV 3-hydroxyvalerate
lcl-PHA Long chain length PHA mcl-PHA Medium chain length PHA MMCs Mixed microbial cultures
N Nitrogen (referred to nitrogen which was fed to the reactor) NADH Nicotinamide adenine dinucleotide
NADPH Nicotinamide adenine dinucleotide phosphate NPCM Non-PHA cellular mass
OLR Organic loading rate (gCOD L-1 d-1)
OUR Oxygen uptake rate (mgO2 L-1 h-1)
PAO Polyphosphate accumulating organisms
PGAP PHA granule-associated protein PHAs Polyhydroxyalkanoates
PhaA β-ketothiolase
PhaB NADPH-oxireductase PhaC PHA synthase
xviii
PhaP Phasins
PHB Poly(3-hydroxybutyrate)
PHBHx Poly(3-hydroxybutyrate-co-3-hydroxyhexanoate)
PHBV Poly(3-hydroxybutyrate-co-3-hydroxyvalerate)
PP Polypropylene
Prod Productivity (gPHA L-1 d-1)
RNA Ribonucleic acid
rPHA Polyhydroxyalkanoates storage rate (gCODPHA L-1 h-1)
rS Substrate consumption rate (gCODVFA L-1 h-1)
SBR Sequencing batch reactor
scl-PHA Short chain length PHA SDS Sodium dodecyl sulfate
SRT Sludge retention time (d)
SS Suspended solids
TCA Tricarboxylic acid
TSS Total suspended solids (mg L-1) VFA Volatile fatty acids
VSS Volatile suspended solids (mg L-1)
VSSnon-polymer Volatile suspended solids without polymer (mgCOD L -1)
WWTP Wastewater-treatment plant
XA Active biomass (mgCOD L-1)
YOBS Observed yield (gCODX gCODVFA-1)
1
1 INTRODUCTION
1.1 PHA: Structure, properties and applications
Over the past decades, most of the plastics used worldwide have been produced using unrenewable resources such as petroleum. This occurrence has been increasingly concerning some countries due to the impact of the carbon dioxide (CO2) emissions to the atmosphere as a result of the combustion of this
resources, the influence they can have on fauna and flora and, last but not least, the recalcitrance towards microbial degradation of these materials (Keshavarz & Roy 2010; Chen 2010). In fact, according to the Association of Plastics Manufacturers in Europe (APME), over 20 million tonnes of plastic wastes were produced in Western Europe in 2002 alone, of which only 38 % were recycled or used as an energy source (D. Dionisi et al. 2005). Also, the total consumption of plastics has been increasing, with about 150 million tonnes of plastics being consumed around the world yearly and the growth is expected to last until 2020 (Castilho et al. 2009). The massive dependence on the fossil resources will definitely lead to the depletion of the reserves in the long-term and to an increase of the cost of all materials produced with these sources. Therefore, an alternative to the production of polypropylene (PP) is in order.
In order to produce less recalcitrant plastics, the idea of producing biopolymers such as polysaccharides, polylactates and polyhydroxyalkanoates (PHA) has arisen. Biopolymers such as the ones mentioned are considered to be natural, biocompatible and biodegradable which means that they will hardly accumulate in the environment because they can be fully and easily biodegraded to water (H2O) and CO2 by bacteria
(Rehm 2010; Jendrossek & Handrick 2002; Lee 1996). The last group of biopolymers stated is believed to be among the most promising biopolymers researched nowadays (Villano et al. 2014). Owing to the monomer variation in the structure of the polymer, PHA usually presents a wide range of structural, mechanical and thermal properties (Albuquerque et al. 2011). In the future, it is believed that a process capable of efficiently producing PHA will address 3 major world problems: the shortage of petroleum for plastic materials production, the CO2 emissions to the atmosphere as a result of fossil resources combustion and a global
protection of the environment (Chen 2010).
Although the observation of PHA granules as refractile bodies in bacterial cells goes back at least to Beijerinck 1888, it was only in 1927 when PHA was discovered and described by Lemoigne (Braunegg et al. 1998). Later, the synthesis of PHA by mixed microbial cultures (MMC) was observed in wastewater treatment plants designed for enhanced biological phosphorus removal (EBPR) (Serafim et al. 2008; Wallen & Rohwedder 1974). This polyester is biologically synthesized by bacteria as an energy storage polymer using R-hydroxyalkanoic acid (HA) monomers with a general chemical structure shown in Figure 1.1.
2
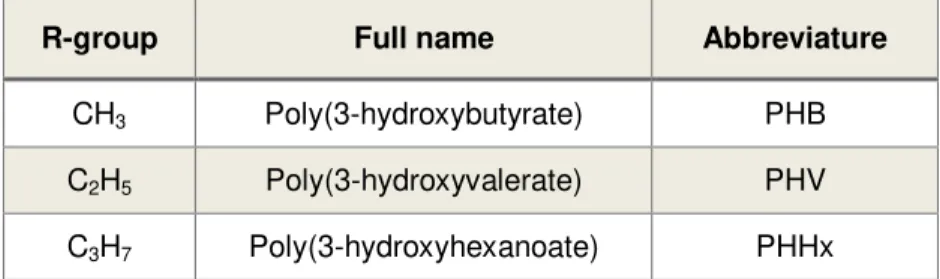
Table 1.1 – Different types of homopolymers and their respective R-groups. These polymers are equivalent to the ones represented in Figure 1.1 with X = 1. Adapted from (Verlinden et al. 2007).
R-group Full name Abbreviature
CH3 Poly(3-hydroxybutyrate) PHB
C2H5 Poly(3-hydroxyvalerate) PHV
C3H7 Poly(3-hydroxyhexanoate) PHHx
The bacterial production of PHA is the only process that can fully guarantee a complete stereospecificity, due to the PHA synthase present in the cells, which is a requirement to ensure the typical biodegradability and biocompatibility of these polymers. This process, almost always, yields a polymer with R-configuration. A quite rare exception is only made for S monomers which were reported by Sudesh et al (Zinn & Hany 2005; Sudesh et al. 2000).
Up to this point, over 150 different monomers have been identified and described in the literature, which can be divided according to their composition and length (Zhang et al. 2006; Wang et al. 2014). These monomers may be divided into 3 classes: short-chain-length PHAs (scl-PHAs), which have a short side chain of only 3 to 5 carbons; medium-chain-length PHAs (mcl-PHAs) own a side chain of 6 to 14 carbons; large-chain-length PHAs (lcl-PHAs) that possess a side chain of 15 or more carbons (Zinn et al. 2001). Although there are three different categories of HA monomers and dozens of monomers, the last category is the least common and the least studied and only a few monomers have been widely studied (Kunasundari & Sudesh 2011). The most common and widely studied monomers so far are the shortest monomers, which are represented in Table 1.1.
Poly(3-hydroxybutyrate), PHB, is the most extensively studied polymer, so far, and it is a great example of a scl-PHA. This material is comparable to polypropylene in a few properties such as the melting temperature (177-179 °C), glass transition temperature, crystallinity and tensile strength as shown in Table 1.2. On the other hand, PHB possesses a very low extension to break when compared to polypropylene (Verlinden et al. 2007; Loo & Sudesh 2007). Regarding the degradation temperature, it is as high as 180 °C, which means that when this polymer is processed at temperatures as high as its melting point, there is a loss of the mechanical properties of the polymer due to substantial loss of molecular weight (Kunioka & Doi 1990).
Table 1.2 – Main properties of different PHA and PP. While PHBV contains 20 % of HV, PHB4B is made of 16 % of 4HB. Adapted from (Verlinden et al. 2007).
Parameter PHB PHBV PHB4B PP
Melting temperature (°C) 177 145 150 176 Glass transition
temperature (°C) 2 -1 -7 -10
Crystallinity (%) 60 56 45 50-70
Tensile strength (MPa) 43 20 26 38
3
Table 1.3 – Properties of PHBV copolymers with different HV molar composition (adapted from (Loo & Sudesh 2007)).
Properties
HV Composition (mol, %)
0 3 9 14 20 25
Melting temperature (°C) 179 170 162 150 145 137
Glass transition
temperature (°C) 10 8 6 4 -1 -6
Young’s Modulus (GPa) 3.5 2.9 1.9 1.5 1.2 0.7
Tensile strength (MPa) 40 38 37 35 32 30
Heteropolymers arise as a potential alternative to homopolymers such as PHB. These polymers consist of different monomers, and unlike PHB, they have improved properties when compared to PP, which can lead to improvements in some industrial applications (Verlinden et al. 2007). Usually, these heteropolymers are a mixture hydroxybutyrate (HB) and other monomers, for instance, hydroxyvalerate (HV) and 3-hydroxyhexanoate (HHx). The incorporation of monomers with a longer side chain such as the ones just reported has significant effect in the crystallinity, diminishing it (Reis et al. 2003). Additionally, these polymers have shown a higher flexibility, lower melting temperature and lower glass transition temperature. Although the previous properties have a dependence on the monomer composition, the temperature of degradation of the polymer does not seem to be significantly affected by the monomer composition (Bengtsson et al. 2010). Hence, the processing of the heteropolymer can be achieved without major molecular weight loss at lower temperatures when compared to processing of PHB (Carrasco et al. 2006).
Poly(3-hydroxybutyrate-co-3-hydroxyvalerate) (PHBV) is among the most studied copolymers, and as shown in Table 1.3, the properties of the polymer change along with the increase in the percentage of HV units. The shift in the properties of the polymer is a consequence of the polymer becoming more amorphous (Anderson & Dawes 1990). Poly(3-hydroxybutyrate-co-3hydroxyhexanoate) (PHBHx) shows a similar trend in properties’
shift as the previous polymer, because of a loss of crystallinity (Doi et al. 1995). As previously reported, due to the high variability in structure and properties, tailor made polymer could have a deep impact on the world by suiting its wide range of needs (Linton et al. 2012). In fact, due to this polymer being produced by wide spectrum of over 300 bacteria ranging between Gram-positive and Gram-negative (e.g. Lampropaedia, Pseudomonas, Rhodobacter, Ralstonia, Bacillus, Clostridium), both aerobic and anaerobic photosynthetic bacteria and even some Archea, this biologically produced polymer may even show more variability and be tailor made by shifting some of the operational conditions (Valentino et al. 2011).
4 large number of applications for PHA, and due to its selling price being still too high, a few other applications, either less expensive or high value applications, should emerge shortly, making them more widely used. Despite the facts that PP is one of the most produced polymers nowadays and that it shares most of its mechanical and thermal properties with PHA, biodegradability is the one property that is exclusive to PHA. The molecular weight of the polymer plays an important role in PHA production because, not only does the molecular weight of the polymer matter in order to the polymer present the characteristics already mentioned, but it also affects for a matter of biodegradability. A vast number of microorganisms can degrade the polymer by using extracellular PHA depolymerases which partially degrade the polymer into small water soluble fragments, which after being incorporated, bacteria are able to completely degrade them internally (Madison & Huisman 1999; Khanna & Srivastava 2005). Although this process can be achieved without any special environmental requirements, both the activity of the enzymes is affected by pH, temperature, among other factors and the nature of polymer may also interfere with the rate at which it is degraded (Tokiwa & Calabia 2004; Madison & Huisman 1999). It has been reported that the lower the molecular weight and the melting point of the polymer, the higher the susceptibility for this polymer to be degraded in nature. Besides, the opposite trend has been described regarding crystallinity, which means that highly ordered structures have lower biodegradability (Philip et al. 2007).
1.2 Pure cultures
After the discovery and characterisation of PHA almost a century ago, this polymer has been thoroughly studied and an efficient and robust bioprocess for PHA production has also been researched in order to take advantage from all benefits this polymer presents when compared to PP. The maximum PHA productivity already achieved has been through the use of pure cultures. In the industry, PHA is generally produced in fed-batch mode in a two-step process: firstly, the reactor is fed with a sterile growth media in order to achieve a high cellular content; secondly, growth limiting conditions are deliberately imposed with a limitation of a nutrient (N, P or O2) so that PHA storage is induced (Reis et al. 2011; Laycock et al. 2014). This process is
accomplished by a few species with a considered high volumetric productivity such as Cupriavidus Necator (also known as Ralstonia eutropha or Alcaligenes eutrophus), Pseudomonas oleovorans, Protomonas extorquens and Alcaligenes latus. Regarding the recombinant cultures, since these can grow and produce polymer at the same time, a nutrient limited phase is not required to induce PHA production. However, a nutrient feeding strategy must be developed in order to achieve a balance between cellular growth and polymer formation (Valentino et al. 2011). E. coli is the most used organism in genetic manipulation due to its convenience for genetic manipulation and fast growth. Besides, depending on the genes incorporated in the genome of the wild strain, high diversity in the structures of the produced PHA have been reported in the literature (Chen 2009). Maximum PHA contents up to 80-90 % of cell dry weight have already been reported in the literature as well as a substantially high volumetric productivity (up to 5 gPHB L−1 h−1) (Reis et al. 2011;
Reddy et al. 2003). Despite the yields stated above, the costs of the process, including the product extraction and isolation, are as high as €11.5-14 kg-PHB-1, becoming an impediment to a widespread of products made of this polymer (Koller et al. 2011; Chanprateep 2010). The price is mainly due to substrate cost, accounting to approximately 40 % of the cost of the whole process (Albuquerque et al. 2007). The high cost attributed to the substrate is explained by the requirement of the sterilization of the nutrients, the use of refined sugar feedstocks such as glucose and sucrose and by the oxygen demand of this process. Moreover, the downstream-processing and energetic consumption contribute to the expensiveness reported (Dias et al. 2006; Reis et al. 2011).
5 required to be removed. However, PHA storage in recombinant plants has not been studied thoroughly enough and controversy over growth impairment as a result of PHA storage seems to occur in the literature (Poirier et al. 1995; Gumel et al. 2013). Another alternative which has already been studied, regards the use of photosynthetic MMC to produce PHA under a feast and famine regime (Fradinho, Oehmen, et al. 2013; Fradinho, Domingos, et al. 2013). Aeration is associated to reasonable portion of the costs of the process and a process which does not require aeration can be more economically competitive. Similar results to other studies using MMC under aeration and without photosynthetic organisms in PHA productivity have been reported. Although the aeration costs are cut with this process, high electricity costs can be associated because the organisms need constant light. Although sunlight as an illumination source has come up as potential cost-cutting measure, a long period of light absence occurs, decreasing the productivity of the process.
As a consequence of the overall high cost of PHA production, efforts have been made over the last years in order to turn the production into a more economical process, allowing the polymer to be used in its various applications (Laycock et al. 2014; Reis et al. 2011). In the field of genetic engineering, research has been done over the last years in order to obtain a higher PHA cellular content, more effective carbon source usage and to achieve innovative and valuable PHA properties (Vo et al. 2015). An increasing interest in using low-cost substrates based on agro-industrial wastes and by-products and MMC, which do not require sterile conditions, has also arisen (Valentino et al. 2011).
1.2.1 PHA synthesis
The metabolism of the most efficient PHA-accumulating organisms has been extensively studied and it is known that C. necator and A. latus use the Entner-Doudoroff pathway to convert carbohydrates into pyruvate in order to obtain energy in forms of adenosine triphosphate (ATP) and nicotinamide adenine dinucleotide (NADH). Under unrestricted growth conditions, the pyruvate produced is metabolized into Acetyl coenzyme A (acetyl-CoA), which will enter the tricarboxylic acid cycle (TCA cycle). In this part of the catabolic pathway occurs the full oxidation of carbon into CO2 coupled with the synthesis of guanosine-5'-triphosphate (GTP)
and reducing agents, namely NADH and flavin adenine dinucleotide (FADH2). Finally, in the mitochondria,
NADH and FADH2 are oxidised while oxygen is reduced to water in a process called oxidative
phosphorylation. These two reactions result in an energy production which is used by the cell to produce ATP (Reis et al. 2011; Anderson & Dawes 1990).
On the other hand, when the cells undergo a lack of a nutrient such as N, growth is limited. Protein formation slows down, the concentration of RNA in the cytoplasm decrease and the cell is not able to continue to growth as fast as in the non-limiting nutrient media (Valentino et al. 2011). In fact, nitrogen limitation has as consequence the increase of the intracellular concentrations of NADH and nicotinamide adenine dinucleotide phosphate (NADPH), which lead to an inhibition of TCA cycle, and consequently, increasing the amount of acetyl-CoA in the cell (Reis et al. 2011). Hence when cells uptake more carbon than what they can use, cells metabolize it all to acetyl-CoA, then get rid of the excess by producing PHA. The described metabolic pathway for PHA formation is shown in Figure 1.2 as well as some other pathways used by different organisms. According to Figure 1.2, ultimately, the variety of polymers is almost limitless since a very wide range of substrates with unique chemical structures can be given to bacteria in order to produce different monomers, and consequently, polymers with high diversity.
6
Figure 1.2 – Key metabolic pathways involved in PHA synthesis. As shown, the polymer can be stored through glycolysis (a), de novo fatty acid synthesis (b), β-oxidation of fatty acids (c, d) and alkanes’ oxidation (e). Adapted from (Reis et al. 2011).
7
Figure 1.3 – Metabolic pathway which involves both synthesis and breakdown of P(HB). Adapted from (Khanna & Srivastava 2005).
The regulation of PHA production seems to be a complex process. In fact, it has been demonstrated that B. megaterium’s polymerase is synthesized in an inactive form and that it is required a polypeptide (PhaR) to active this enzyme suggesting the regulation may involve different environmental, metabolic and genetic signals (Luengo et al. 2003). The process in which PhaR either activates or deactivates polymer formation in R. eutropha has been described. This process also involves another PHA-binding protein, phasin (PhaP), which it has been demonstrated its important role in granule formation. This low-molecular weight protein enhances polymer formation by binding to granules and regulating their size, number and surface to ratio of PHB inclusions. Also, this modulation of size and number of granules seems to be controlled by the PHA synthase, PhaC (Luengo et al. 2003).Furthermore, phasins from various bacterial strains have been shown to increase PHA production, promote accumulation of PHA as numerous small granules, and when they are not
present in the cell due to gene’s deletion, this strains exhibit approximately 50 % decrease in PHA production relatively to the wild-type (York et al. 2001).
The three enzymes directly involved in the polymer synthesis belong to a single operon named phaCBA as shown in Figure 1.4. While phaA encodes for the β-ketothiolase (PhaA), phaB codifies the NADPH-oxireductase (PhaB) and phaC encodes the PHA synthase (PhaC) (Luengo et al. 2003). As previously pointed out, significant efforts have been made towards optimizing as much as possible the productivity of the process aiming at selling the product at a more reasonable price. Some work has been done on pure cultures while some other researchers have been working on genetically modifying organisms by inserting the crucial enzymes in the genome with the purpose of improving the process.
Another pathway that has been increasingly exploited is the pathway where short-chain organic acids –
8
Figure 1.4 – Set of genes that codify the enzymes involved in PHA synthesis in R. eutropha. Adapted from (Luengo et al. 2003).
This pathway is common in MMC and, although there are few studies considering metabolic pathways in MMC using VFA, it has been assumed they share high similarity (Pardelha et al. 2014; Dias et al. 2008; Reis et al. 2003).
1.2.2 Granule Formation
PHA accumulate in the cell as water insoluble inclusions called PHA granules. Native PHA granules have been found to be made of 97.5 % PHA, 2 % proteins and probably some lipids. PHA granules seem to harbor a considerable amount of proteins called PHA granule-associated proteins (PGAP), among which there are PHA synthases, PHA depolymerases, regulators and structural proteins such as PhaP (Jendrossek & Pfeiffer 2014; Cai et al. 2014). Besides the already describe role for phasins, another phasin-like proteins have been described as crucial in the granule division during the cell division (Cai et al. 2014). This occurrence suggests granules are functional supramolecular complexes rather than a simple energy and carbon storage, for which the term “carbonosomes” was suggested to indicate the multifunctionality of the PHA granules (Jendrossek & Pfeiffer 2014; Jendrossek 2009). Although the number of granules seems to be constant over time and defined in the early stages of PHA accumulation, they present variable diameters (0.2 to 0.7 μm) (Valentino et al. 2011; Anderson & Dawes 1990; Braunegg et al. 1998). As stated by Anderson and Dawes, while the polymer can have a molecular weight up to 106 Dalton (Da), the PHA granules may weigh as much as 5*109
Da, thus suggesting than each granule may have over 1000 molecules of polymer (Anderson & Dawes 1990). The PHA-storing bacteria, the feedstock and the growth conditions such as pH and temperature are among the factors that influence the final molecular weight of the polymer (Laycock et al. 2014; van der Walle et al. 2001; Kusaka et al. 1997). As the mechanical properties of PHA deteriorate when the molecular weight drops below 0.4*106 Da, approaches to boost the average molecular weight have come up. While the first
involves a genetic modification of the expression of PHA synthase, by taking advantage of the fact that low levels of this synthase lead to high molecular weight, the latter consists of poly(ethylene glycol) addition to the fermentation medium (Laycock et al. 2014; Sim et al. 1997).
1.3 Mixed Microbial Cultures as an economical alternative
9 wastewaters, paper industries and palm oil (Campanari et al. 2014; Bengtsson et al. 2010; Bengtsson, Werker, Welander, et al. 2008; Bengtsson, Werker, Christensson, et al. 2008; Salmiati et al. 2007). The availability of these substrates is quite variable though. While some wastes are obtainable the entire year, others are seasonal. Furthermore, the carbon concentration of these effluents is variable, ranging between a few grams of COD L-1 to hundreds.
The synthesis of PHA using MMC was first observed by Wallen et al in a wastewater treatment plant (WWTP) design for enhanced biological phosphorus removal in 1974 (Wallen & Rohwedder 1974). Typically, these systems work in alternated aerobic and anaerobic cycles and the bacteria selected from this conditions are glycogen-accumulating organisms (GAO) and phosphate accumulating organisms (PAO) (Serafim et al. 2008). Both organisms have similar metabolic pathways, being essentially distinguished by the ability of PAO accumulating poly-phosphate which GAO cannot. Since then, a lot of investigation has been performed in order to find out which organisms specifically are present in these processes and how it can be optimized. The microbial population in MMC works in an open system, its composition is variable and it varies depending on the operational conditions imposed. It has been reported that nutrient concentration, pH, sludge retention time (SRT), among others affect both PHA production and microbial composition in this kind of systems. A proper selection either by discontinuous feed or a variation in the redox conditions (presence or absence of electron acceptor) can also have a great impact in microbial composition (Campanari et al. 2014; Valentino et al. 2014; Valentino et al. 2015; Villano, Beccari, et al. 2010; Lemos et al. 2008; Villano, Lampis, et al. 2010). Previous studies investigating microbial composition have revealed its wide diversity. A few Alphaproteobacteria (Xantobacter and Curtobacterium), several Betaproteobacteria (Thauera, Alcaligenes, Comamonas, Achromobacter) and Gammaproteobacteria (Kluyvera, Pseudomonas, Acinetobacter) were present in one study, while in another study Paracoccus of Alphaproteobacteria, Thauera and Azoarcus from Betaproteobacteria and Flavobacterium from Flavobacteria were present in higher concentration (Albuquerque et al. 2012; Lemos et al. 2008).
1.3.1 FF regime
In WWTP, selection processes were originally imposed for bulking control purposes and with the intention of avoiding problems related to biomass separation during sedimentation in EBPR systems. In addition to the usefulness of this strategy, later it has been found out that the key to the effectiveness of a PHA production process (both storage capacity and productivity) by MMC, relies on the culture selection (Valentino et al. 2011; Albuquerque et al. 2010). Whereas in PAO and GAO, selection was based on a metabolic shift, due to the presence or absence of oxygen, in other organisms, selection is accomplished through feast and famine (FF) conditions, which can also be called aerobic dynamic feeding (ADF), also implicating a metabolic change. In both scenarios growth limitation is accomplished while PHA production occurs. However, anaerobic and aerobic cycles result in a limitation because of the lack of O2 whereas ADF results also in an
internal limitation due to lack of substrate.
In a FF regime, there is a phase of abundance of carbon source and a following phase where it is absent (Reis et al. 2011). In the presence of carbon source, a fraction of substrate is aerobically oxidized to carbon dioxide, producing ATP and reduced compounds such as NADH, NADPH and FADH2,which can be used for
10 growth response cannot be predominant after a few FF cycles (Van Loosdrecht & Heijnen 2002). In this case, a storage response takes over and, microorganisms, which can store polymer the fastest, will store more polymer during the feast phase and will be able to use it later for growth and maintenance, thereby having a greater competitive advantage over the other bacteria.
As a consequence of imposing a FF regime, microorganisms use the carbon source during the feast phase to grow and produce polymer and, consume it during famine phase for growth and maintenance (Van Loosdrecht et al. 1997). Figure 1.5 represents this situation by showing the period in which carbon is being consumed as well as polymer is being formed. As for growth, although there is a peak during feast phase, this process is far from negligible during the famine phase.
Although the feast and famine regime seems to select the PHA accumulating organisms, the efficiency of the method deeply depends on the FF ratio because if the famine phase is not long enough to ensure internal limitation, microorganisms will still be better fit to grow. As reviewed by Valentino et al, a FF ratio up to 0.26 led to a stable storage response, a FF ratio over 0.9 resulted in a growth response, whereas for intermediate values the culture was stable (Valentino et al. 2011). Although in order to achieve a higher productivity may require using a higher organic load rate (OLR), this factor may be detrimental to FF ratio, increasing it, as previously demonstrated in a couple of studies (Dionisi et al. 2006; Albuquerque et al. 2010). The SRT should also be considered, because both high SRT and low number of cycles per SRT will lead to lower FF ratio, thereby a better performance (Albuquerque et al. 2012; Johnson, van Loosdrecht, et al. 2010; Chang et al. 2012). Moreover, pH and temperature have been reported to directly impact the performance of the selection. While an increase in the pH from 7.5 to 9.5 resulted in a poorer storage rates and yields, a higher temperature (30 °C) seem to affect positively the feast phase when compared to the performance of the reactor at a lower temperature (15 °C) (Villano, Beccari, et al. 2010; Johnson, van Geest, et al. 2010; Valentino et al. 2011). Last but not least, nutrients may also alter the FF ratio, as nitrogen limitation can lead to an increase in the FF ratio, as Johnson et al demonstrated (Johnson, van Loosdrecht, et al. 2010).
1.3.2 MMC processes for PHA production
As previously explained, efforts have been made in order to discover economical alternatives processes for PHA production. The conversion of both wastewaters and synthetic VFA mixtures, by MMC, has been reported as a more inexpensive procedure to synthesize the polymer in comparison to pure cultures processes and poly-ethylene production (Gurieff & Lant 2007; Ince et al. 2012). Depending on the substrate employed, typically, this process is either performed in two or three independent steps (Albuquerque et al. 2007).
The two-step process contemplates an initial phase for culture selection in PHA-accumulating organisms and further step for polymer accumulation by the selected culture and it has been widely and successfully applied (Moralejo-Gárate et al. 2013; Johnson et al. 2009). The produced PHA is extracted and purified afterwards. This process is appropriate for PHA production when VFA’s are used as feedstock. When glucose or wastewaters are used as feedstock, a preliminary stage is performed in order to convert the organic matter
11
Figure 1.5 – Polymer storage under aerobic conditions in a feast and famine regime by MMC. Reprinted from (Reis et al. 2011)
The efficiency of the microbial selection stage is crucial for the overall production of polymer in the following stage. The aim of this phase is to select a culture able to produce a high amount of PHA in stable mode. Besides, a high growth rate is important so that volumetric productivity of the process is as high as possible (Reis et al. 2011). Over the years, several methods have been tried in order to achieve a proper culture selection. Selection is usually performed in SBR and the variable most studied in these methods is the aeration and the impact of absence of oxygen during the beginning of the cycle. The anaerobic/aerobic selection process consists of an initial absence of oxygen followed by full aeration of the reactor. Although PHA content between 30 and 57 % was obtained under anaerobic/aerobic conditions, this process was not stable (Takabatake et al. 2000). Satoh et al proposed a new method, in which aeration was always present throughout the whole time (Satoh et al. 1998). However, less oxygen was present in the beginning of the cycle, in order to hinder growth of microorganisms and promote PHA production in a microaerophilic environment. The produced PHA was consumed during a fully aerobic phase for growth and maintenance, yielding a maximum PHA content of 62 %. Once again, PHA production was not stable (Dias et al. 2006). PHA production by activated sludge under fully aerobic conditions can be achieved when the sludge goes through successive periods of feast and famine. It has been shown this method can result in a stable storage capacity (Serafim et al. 2004; L. S. Serafim et al. 2008). Although FF regime can also be obtained with plug flow reactors and in two continuous stirred-tank reactors (CSTR) in series with biomass recirculation, SBR is the most widely used (Valentino et al. 2011). The conditions that improve the selection stage and feast and famine ratio have been investigated over the last years and the most common parameters used are summed up in Table 1.4. This process may economically compete with the production of PHA from pure cultures with the advantages of being a simpler process and requiring less investment and operational costs. However, the efficiency of the selection stage using consecutive cycles of feast and famine directly depends on feast and famine ratio.
12
Table 1.4 – Summary of some of the operating parameters typically used for MMC selection in PHA-storing organisms. Adapted from (Reis et al. 2011)
Operating Parameter Range
Sludge retention time (d) 1-20 Hydraulic retention time (d) 1-3
Length of SBR cycle (h) 2-12
pH 7-9.5
T 20-30
Operation mode SBR or two continuous reactors Organic loading rate (gCOD L-1 d-1) 1.8-31.25 Substrate concentration (gCOD L-1) 0.9-31.25
COD:N ratio (gC gN-1) 9-120
F/F ratio 0.1-1.15
1.4 The importance of nutrients
Microorganisms must be provided with the full spectrum of both micronutrients and macronutrients in order to perform all kinds of cellular activity. Some nutrients have more impact on growth and polymer production though. For instance, N, P and S, have already been linked tightly to growth and their limitation has been directly correlated with growth limitation and they are known to affect PHA storage (Hong et al. 2000; Basak et al. 2011; Wang et al. 2007). Low Acetyl-CoA levels as well as reduced amount of RNA’s and enzymes are a consequence of nutrient limitation and they have been reported to enhance PHA production and to affect the final PHA content (Zinn et al. 2001; Ince et al. 2012).
13 As a result of PHA production by MMC being ultimately aiming at using wastewaters as a substrate and these wastewaters having varying nutrient concentrations, the study of the impact of nutrients on the process performance becomes important so that SBR and accumulation reactors are not reasonably affected by the feedstock composition (Johnson, Kleerebezem, et al. 2010; Valentino et al. 2015).
1.5 Polymer Extraction
Ultimately, the produced polymer must be extracted and purified in order to be used later. The costs of this part of the process are considerable and different processes have been studied over the years in order to maximize purity, minimize costs and obtain a sustainable method (Reis et al. 2011).
The use of solvents is one of the oldest and the most widely used method to extract PHA from microorganisms. It is a recurrent method in laboratories due to its rapidity and simplicity and it can be divided into two steps. Firstly, the permeability of the cellular membrane is modified, thereby allowing the contents to be released and solubilized. Lastly, a non-solvent precipitation is followed (Jacquel et al. 2008; Kunasundari & Sudesh 2011). The process can be done using chlorinated hydrocarbons, for instance, chloroform and 1,2-dichloroethane and cyclic carbonates such as ethylene carbonate 1,2-propylene carbonate (Kunasundari & Sudesh 2011). Using this method, it is possible to obtain a polymer with high purity, high molecular weight with low degradation. On the other hand, the recovery yield is not high enough and the costs and the environmental impact do not allow the method to be unanimously accepted. Therefore, other approaches such as digestion methods, among others, have been considered as potential alternatives (Jacquel et al. 2008; Kunasundari & Sudesh 2011).
Digestion methods involve the solubilisation of non-PHA cellular mass (NPCM) and they can be classified as chemical digestion and enzymatic digestion, depending on the agent employed. Regarding chemical digestion, sodium hypochlorite and surfactants such as sodium dodecyl sulfate (SDS) and Triton X-100 are typically used. The first agent owns strong oxidizing properties and non-selectivity, allowing PHA recovery by digestion of the NPCM, while the second promotes disruption of the cellular wall by incorporating itself in it. While sodium hypochlorite allows an extraction with high purity, it can cause polymer degradation by as much as 50 % of polymer mass. On the other hand, surfactants do not typically cause loss of the molecular weight, but the final purity is low (Kunasundari & Sudesh 2011; Jacquel et al. 2008). As reviewed by Kunasundari and Sudesh, more complex strategies such as a sequence of surfactant and sodium hypochlorite and the use of chloroform with sodium hypochlorite have been tried (Kunasundari & Sudesh 2011). They resulted in a better, rapid and more economic recovery of PHA when compared to solvent extraction and a way to retain the high molecular weight of the polymer, respectively. Enzymatic digestion is based on the use of hydrolytic enzymes which specifically destroy the cellular membrane. The method gives rise to high purity and good polymer recovery with high reaction rates and negligent damage to the polymer. However, the high costs and complexity of the recovery process have been crucial drawbacks, thereby hampering its diffusion as a widely used method for PHA recovery (Kapritchkoff et al. 2006; Gumel et al. 2013; Kunasundari & Sudesh 2011). As reviewed by Jacquel and colleagues, other methods have also been studied such as mechanical disruption and supercritical fluids, but they are not widely used or they are still emerging and underdeveloped technologies requiring further research and optimization (Jacquel et al. 2008).
15
2 OBJECTIVES
As previously stated, most plastics used nowadays are made using non-renewable sources. Although they are economic, they are not biodegradable, thereby accumulating in the environment and directly affecting the ecosystem. PHA is one of the most promising alternatives to change the current situation, and this work ultimately aims at finding an eco-friendly and economic process for PHA production. Since the current processes for PHA production are still underdeveloped causing the prices to augment, performance should be optimised by increasing the volumetric PHA production rate, and/or decreasing costs in order to be economically competitive.
Whenever MMC are used, low-cost renewable feedstocks can also be used and these are often nutrient deficient (such as paper mill and olive oil mill wastewaters, cheese whey permeate, molasses), requiring nutrient supply in the selection stage in order to allow microbial growth. The effect of nutrient limitation on the performance of both the SBR and the PHA accumulation reactor has been widely studied, with main reference to COD:N ratio.
Despite the fact that it is already known a range of concentrations of nitrogen which yield a good performance, as well as COD:N ratios which induce a good selection stage, there is still lack of knowledge on the impact of nitrogen supply strategies in the SBR on the process performance (Johnson, van Loosdrecht, et al. 2010).
In this context, the main aims of this study were to investigate:
- the possibility to uncouple nitrogen supply from carbon feed within the SBR cycle, in order to make nitrogen available after the feast phase. As a result of this change, theoretically, microorganisms would only have nitrogen during the famine phase, thereby growing only during this period. In contrast, during feast phase, microorganisms would use all the external carbon to produce polymer, and use it to survive during the following phase;
- the effect of different COD:N ratios (100:2.43, 100:3.03 and 100:3.79) in a SBR operated with uncoupled carbon feed and nitrogen supply.
17
3 MATERIALS AND METHODS
3.1 Experimental set-up
3.1.1 MMC selection in Sequential Batch Reactor (SBR)
The culture selection stage was conducted in a lab-scale SBR with a working volume of 1 L. The reactor was inoculated with activated sludge from the Roma Nord full-scale treatment plant which mostly treats domestic wastewater. The reactor was operated under aerobic conditions at controlled temperature (25 °C) and pH (7.6) and a schematic representation of the SBR is shown in Figure 3.1. The reactor was made of glass with the top being made of plexiglass, it had 8 apertures, which were used to add and withdraw the mixed liquor, aerate the reactor and allow probes to access the reactor for monitoring purposes, such as the oxygen and pH probes. The reactor was aerated by means of air pumps through three ceramic diffusors and stirred by a mechanical impeller. As a result, it was guaranteed a non-oxygen limiting concentration (> 2 mg L-1) and an
oxygen transference coefficient (KLa) of about 0.3 min -1. While the pH of the reactor was kept constant
through carbon dioxide bubbling through compressed gas cylinder, temperature remained at around 25 °C using a thermostatic jacket.
The reactor was controlled with a computer software which allowed the management of all the phases whose total length was maintained at 6 h throughout all the study. The SBR was operated with nitrogen supply uncoupled from carbon feed within each cycle and three runs were performed at different COD:N ratios (gCOD:gN): 100:3.79, 100:3.03 and 100:2.43. The structure of the cycle was the same for the first two runs and consisted of a carbon feed phase, (10 min; 0.21 L cycle-1), a reaction phase when the carbon was consumed (140 min), a withdrawal phase of the mixed liquor (2 min; 0.25 L cycle-1), a nitrogen feed phase (5 min; 0.04 L cycle-1) and a famine phase (203 min). On the other hand, the third run started with the same
exact conditions but on the 8th day of operation the withdrawal phase was moved to the end of cycle. Thus,
the cycle structure started with the carbon feed (10 min; 0.21 L cycle-1), followed by a reaction phase (142
min), nitrogen feed (5 min; 0.04 L cycle-1), famine phase (201 min) and, lastly, withdrawal phase (2 min, 0.25
L cycle-1). This change occurred because the carbon was not depleted by the moment withdrawal occurred,
resulting in the withdrawal of carbon, so this phase as well as nitrogen feed were postponed, extending the reaction phase. Unlike common SBR operations, settling of the biomass was not implemented. Therefore, SRT and hydraulic retention time (HRT) were both equal to 1 d.
During the reaction phase, carbon is present abundantly until it is depleted and PHA is produced at the carbon source expense. On the opposite, the famine phase occurs when external carbon is depleted and biomass grows using the nitrogen that was just fed and the carbon in the form of polymer that was previously accumulated. The volume withdrawn during the withdrawal phase is equal to the sum of the volumes added during the carbon and the nitrogen feeds. The reactor was under stirring and aerations during all times except for the withdrawal phase in which aeration was stopped to guarantee the right volume was withdrawn. Regarding the carbon source, a synthetic mixture of acetic (85 % on a COD basis) and propionic acids (15 %) was fed in all runs, with an organic load rate (OLR) equal to 8.5 gCOD L-1 d-1 (corresponding to 260
Cmmol L-1 d-1). While the carbon source was constant during all times for all runs, the nitrogen load varied among runs. For the three separate runs, the addition of nitrogen was performed using ammonium sulfate and, in the first run, 322 mgN L-1 d-1 (corresponding to 23.0 Nmmol L-1 d-1) were given to the reactor, in the second, only 258 mgN L-1 d-1 (or 18.6 Nmmol L-1 d-1), and in the latter, 206 mgN L-1 d-1 (equal to 15.0 Nmmol
L-1 d-1). As a result, the COD:N ratio (gCOD:gN) in the runs was 100:3.79, 100:3.03 and 100:2.43, respectively, which, on a molar basis, corresponded to 11.3, 14.0, and 17.3 Cmol Nmol-1). Along with the
18
Figure 3.1 – Layout of the SBR reactor: A – Feed tank; B – peristaltic pump for substrate feeding; C – peristaltic pump for nitrogen feeding; D – nitrogen feed tank; E – withdrawal pump; F – CO2 pump and pH meter; G – air
pump; H – mechanical stirrer; I – dissolved oxygen meter; J – reactor vessel; K – thermostatic vessel.
1): FeCl
3 ∙ 6H2O (2), EDTA (3), thiourea (20), K2HPO4 (335), KH2PO4 (259), MgSO4 ∙ 7H2O (0.1), MnCl2 ∙
4H2O (0.03), H3BO3 (0.3), CoCl2∙ 6H2O (0.2), CuCl2∙ 2H2O (0.01), NiCl2 ∙ 6H2O (0.02) and Na2MoO4∙ 6H2O
(0.03).
19
Figure 3.2 – Layout of the accumulation reactor: A – dissolved oxygen meter; B – air pump; C – pH meter; D – thermostatic bath; E - magnetic stirrer; F – reactor vessel
3.1.2 Polymer accumulation in batch reactor
With the intention of simulating the last stage of the process, the PHA accumulation stage was performed in a 0.5 L batch reactor at 25 °C, which was achieved using also a thermostatic jacket. In general, the maintenance of the batch reactor was quiet similar to the maintenance of the SBR, which means that the reactor was aerated using an air pump, pH and oxygen probes were inserted in the reactor for control purposes and mechanical stirring was implemented. However, pH was manually adjusted at 7.6 by means of concentrated solutions of sodium hydroxide (3 M) and sulfuric acid (0.8 M). A schematic representation of the accumulation reactor is shown in Figure 3.2.
Typically, by the moment the carbon was depleted in the SBR, 125 mL of sludge were withdrawn from the SBR to the batch reactor and the accumulation stage started from this point on, having a total duration of 6 hours. The sludge was then diluted with 375 mL of mineral medium (having the same composition of that used in the SBR), adding up to the total volume of the reactor. During each accumulation test, a very concentrated (500 gCOD L-1) solution of synthetic acids, with the same proportions of acetic and propionic
20
some delay with sample analyzing in the first run, consequently lack of knowledge about the SBR’s stability,
along with some punctual instability, no batch was performed in the first run. In the second run, 3 batch tests were performed, whereas in the third run, no batch test was performed thanks to a poor SBR performance which will be later described in detail.
3.2 Analytical procedures
3.2.1 Suspended solids determination
Measurement of TSS was consistent with standard methods (APHA, 1995), except for the volume which was sampled. Due to technical reasons, only 5 mL were sampled. This volume, which was sampled, was filtered
under vacuum through GF/C filters (47 mm of diameter and 10 μm of porosity). Before filtration, filters were pretreated at 100 °C in incubator for 24 h. Their weight (P1) was measured and, after sample filtration, they
were incubated for at least 4 h at 100 °C and then for 30 min in exsicator and weighted (P2). Lastly, filters
were put in a muffle at 550 °C for 30 min, kept in the exsicator for 30 min and weighted (P3) one last time.
TSS, fixed suspended solids (FSS) and VSS were calculated, in mg L-1, as follows:
TSS =
(P
2V
- P
1)
FSS =
(P
3V
- P
1)
VSS = TSS - FSS
Regarding non-polymer VSS (VSSnon-polymer), which has also been called in literature as active biomass (XA),
this parameter is obtained by the subtraction of VSS by the polymer (both measured at the same moment within the SBR cycle, i.e. at the end of feast phase). In order to convert it to gCOD L-1, the oxidation
stoichiometry coefficient of the active biomass is used (1.42 gCOD gXA-1).
3.2.2 PHA determination
With the aim of measuring the PHA concentration, 5 mL of mixed liquor were taken at different moments of the SBR cycle and they were immediately treated with 1 mL of NaClO (7 % of active Cl2). The samples were
then stored at -4 °C until the day they were analyzed. The protocol used for extraction, hydrolysis and esterification of the HA was similar to the one used by Braunegg and colleagues (Braunegg et al. 1978). Unfrozen samples were centrifuged at 10000 rpm for 30 min with the aim to separate polymer from most of the cellular contents. 2 mL of a solution containing methanol, benzoic acid (50 mg L-1) and acidified with sulfuric acid 3 % (v/v) were added to the pellet recovered from the previous procedure. 1 mL of chloroform was added to the samples and, the mixture was put in a thermostat for 4 h at 100 °C. Finally, after cooling at room temperature, 1 mL of water was added and samples were mixed for 10 minutes. As a consequence, the mixture separated into a double phase, where the aqueous phase contained some cellular content and the organic phase, the esters which resulted from the esterification reaction.
A gas chromatograph (Perkin Elmer 8410 Gas Chromatograph) equipped with a flame ionization detector
(FID) set to 200 °C, a 6 ft ∙ ¼ inch ∙ 2 mm glass column with 2 % Reoplex 400 on 60/80 Chromosorb GAW was used for polymer quantification. Temperature started at 100 °C and rose at 8 °C min-1 until 148 °C. N2
was used as carrier gas at 120 KPa, whereas H2 and air pressure remained at 120 °C and 150 °C,
respectively. The injector temperature was set to 200 °C. Data was processed by means of a computing integrator (SEPU 3010 Chromatography Station). The retention times of the monomers (HB and HV) and internal standard (benzoic acid) corresponded to 4.5 min, 5.6 min and 6.5 min, respectively. The analysis
consisted of an injection of 1 μL of the organic phase in the gas-chromatograph.
21 same as the samples, with the only exception made for the centrifugation. Due to benzoic acid being used as internal standard, the determined standard curves reported the concentration of each monomer as a function of the ratio of peak area of the corresponding monomer and that of internal standard.
The results were obtained in mg L-1 and they were then converted into mgCOD L-1, according to their coefficients: 1.67 mgCOD mgHB-1 and 1.92 mgCOD mgHV-1. While the PHA concentration was the sum of
the concentrations of both monomers, the PHA content in the biomass was calculated by dividing the PHA concentration by the VSS concentration and it was expressed as a percentage.
3.2.3 VFA Analysis
Sampling for VFA analysis was achieved by taking 2 mL of sludge from the reactor with a syringe, filtrating them through a filter of cellulose acetate with a porosity of 0.45 μm. Samples were then stored at 4 °C until the moment of the analysis. Regarding the preparation of the analysis, 100 μL of oxalic acid (0.33 M) and 100
μL of acrylic acid (2 g L-1; internal standard) were added to 1 mL of sample for the analysis. Whenever
necessary, samples were diluted.
Analysis were performed in a gas chromatograph (DANI Master GC) equipped with a FID set to 200 °C and a 200 cm glass column with 2 mm in diameter. A packed stationary phase Carbopack was used and the temperature was set at 175 °C. Helium was used as a carrier gas at a flow rate of 25 mL min-1. The computer
software Clarity was used to integrate the chromatograms and the typical retention times were 3 min, 7 min and 9 min for the acetic, propionic and acrylic acid, respectively.
Calibration curves were done after a preparation of standards with both acids with concentrations ranging from 0 to 210 mg L-1 and from 0 to 100 mg L-1 for acetic and propionic acid, respectively. Due to acrylic acid being used as internal standard, calibration curves reported the concentration of each VFA as a function of the ratio between the peak area of the corresponding acid and that of acrylic acid. The results were obtained in mg L-1 and then converted into mgCOD L-1 according to their conversion coefficients: 1.067 mgCOD
mgacetic-1 and 1.51 mgCOD mgpropionic-1. All coefficients have been calculated based on the equations of full
carbon oxidation of each compound and they are equal to the mass of oxygen required to full oxidize one mol of compound divided by the mass of one mol of compound.
3.2.4 Nitrogen measurement
Concentration of nitrogen in the samples was measured spectrophotometrically using the Nessler method (APHA, 1995). A calibration curve was obtained by means of standard solutions which were prepared with ammonium sulfate with concentrations ranging between 0 and 200 mgN L-1 in mineral medium.
Although the samples which were taken from the SBR and batch reactor were the same as the VFA samples, the procedure for the analysis diverged. Firstly, 100 μL of sample were added to 5 mL of water. Secondly,
100 μL of Nessler reagent was added and, finally, two drops of Seignette salt were added. A 15 minute
waiting followed and samples were analyzed in spectrophotometer (SHIMADZU Spectophotometer UV-1800) at 410 nm. The Nessler reagent is made up of potassium iodomercurate and this compound reacts with ammonia, producing a colored complex.
3.3 Microscopic observations
3.3.1 Nile Blue staining
Intracellular PHA granules were identified using Nile Blue staining, which under epifluorescency have a red