PROGRAMA DE PÓS-GRADUAÇÃO EM
ECOLOGIA E CONSERVAÇÃO DE RECURSOS NATURAIS
TRAÇOS FUNCIONAIS DE PLANTAS DIRECIONAM O
FUNCIONAMENTO E A DINÂMICA DE COMUNIDADES
FLORESTAIS
PLANT FUNCTIONAL TRAITS DRIVE FOREST COMMUNITY
FUNCTIONING AND DYNAMIC
JAMIR AFONSO DO PRADO JÚNIOR
JAMIR AFONSO DO PRADO JÚNIOR
TRAÇOS FUNCIONAIS DE PLANTAS DIRECIONAM O
FUNCIONAMENTO E A DINÂMICA DE COMUNIDADES
FLORESTAIS
PLANT FUNCTIONAL TRAITS DRIVE FOREST COMMUNITY
FUNCTIONING AND DYNAMIC
Tese apresentada à Universidade Federal de Uberlândia como parte dos requisitos para a obtenção do título de Doutor em Ecologia e Conservação de Recursos Naturais.
Dr. Ivan Schiavini (orientador)
Dr. Lourens Poorter (coorientador)
Dados Internacionais de Catalogação na Publicação (CIP) Sistema de Bibliotecas da UFU, MG, Brasil.
P896t
2016 Prado Júnior, Jamir Afonso do, 1987 Traços funcionais de plantas direcionam o funcionamento e a dinâmica de comunidades florestais / Jamir Afonso do Prado Júnior. - 2016.
112 f. : il.
Orientador: Ivan Schiavini. Coorientador: Lourens Poorter.
Tese (doutorado) - Universidade Federal de Uberlândia, Programa de Pós-Graduação em Ecologia e Conservação de Recursos Naturais.
Inclui bibliografia.
1. Ecologia - Teses. 2. Biomassa vegetal - Teses. 3. Florestas tropicais - Teses. 4. Nicho (Ecologia) - Teses. I. Schiavini, Ivan. II. Poorter, Lourens. III. Universidade Federal de Uberlândia. Programa de Pós-Graduação em Ecologia e Conservação de Recursos Naturais. IV. Título.
JAMIR AFONSO DO PRADO JÚNIOR
TRAÇOS FUNCIONAIS DE PLANTAS DIRECIONAM O
FUNCIONAMENTO E A DINÂMICA DE COMUNIDADES
FLORESTAIS
PLANT FUNCTIONAL TRAITS DRIVE FOREST COMMUNITY
FUNCTIONING AND DYNAMIC
Tese apresentada à Universidade Federal de Uberlândia como parte dos requisitos para a obtenção do título de Doutor em Ecologia e Conservação de Recursos Naturais.
____________________________________________ Dr. Fabrício Alvim Carvalho
Universidade Federal de Juiz de Fora
____________________________________________ Dr. Sérgio de Faria Lopes
Universidade Estadual da Paraíba
____________________________________________ Dr. Vagner Santiago do Vale
Universidade Estadual de Goiás
____________________________________________ Dra. Ana Paula de Oliveira
Universidade Federal de Viçosa
____________________________________________ Dr. Ivan Schiavini
Universidade Federal de Uberlândia (orientador)
AGRADECIMENTOS
Aos meus pais, Jamir e Arlene, minhas irmãs, Thays e Luciana, que sempre me incentivaram a continuar os estudos e me possibilitaram tantos momentos de felicidade ao longo desses anos;
Ao Prof. Ivan Schiavini, pelas boas idéias, por ter me acompanhado em todos os campos, por ter acreditado em meu trabalho desde a época da graduação, por toda a estrutura disponibilizada para a pesquisa, pelo incentivo a fazer o doutorado sanduíche e seguir a carreira acadêmica, sempre prestativo mesmo quando algumas frustrações surgiram no meio do percurso;
Aos amigos do Laboratório de Ecologia Vegetal, Sérgio, Vagner, Carol, Jéfferson, Diego, Ana Paula, Olavo, Maca, Júlio e Pedro Paulo, pela ajuda nos campos e por me proporcionarem boas discussões teóricas, sempre intercaladas por momentos de descontração, desde a época de graduação. Um agradecimento especial ao Sérgio, Vagner e Carol, por terem compartilhado todos os momentos da tese e pela grande parceria nas análises e escrita;
Ao Prof. Lourens Poorter e a todo o pessoal do grupo Forest Ecology and Management de Wageningen, por toda a ajuda nas discussões e análises de dados. Foi um momento de grande aprendizado e felicidade que levarei comigo pra sempre. Um agradecimento especial ao Prof. Lourens, sempre muito atencioso e prestativo, por quem eu tenho grande admiração, não apenas por ser o maior pesquisador que já conheci, mas também por sua simplicidade e amizade;
À Fundação de Amparo à Pesquisa do estado de Minas Gerais (FAPEMIG), pela concessão da bolsa de estudos durante o período do doutorado, e à Coordenação de Aperfeiçoamento de Pessoal de Nível Superior (CAPES), pela concessão da bolsa durante o período de doutorado sanduíche;
A tantos amigos não mencionados que, de inúmeras formas, me acompanharam e incentivaram para que eu pudesse chegar até aqui;
A Deus, que esteve ao meu lado em muitos momentos difíceis e nos de maior inspiração dessa caminhada;
ÍNDICE
Resumo 1
Introdução Geral 2
Capítulo 1. Conservative species drive biomass productivity in tropical dry forests 6
Abstract 7
Introduction 9
Methos 14
Results 21
Discussion 25
Concluding remarks 32
References 32
Appendices 41
Capítulo 2. Interspecific functional traits shape size-dependent growth and
mortality rates of dry forest tree species 50
Abstract 51
Introduction 52
Methos 56
Results 62
Discussion 67
Concluding remarks 75
References 76
Appendices 82
Capítulo 3. Neighbourhood interactions mediated by functional traits determines local dominance and coexistence of species at the same time 91
Abstract 92
Introduction 93
Methos 95
Results 100
Discussion 102
References 106
Considerações Finais 110
RESUMO
Prado-Junior, Jamir Afonso; 2016. Traços funcionais de plantas direcionam o funcionamento e a dinâmica de comunidades florestais. Tese de Doutorado em Ecologia e Conservação de Recursos Naturais. Universidade Federal de Uberlândia. Uberlândia-MG. 112 p.
O objetivo desta tese foi avaliar como os traços funcionais de plantas direcionam o funcionamento e a dinâmica de florestas estacionais tropicais em diferentes níveis ecológicos: comunidades, populações e indivíduos arbóreos. Foi testado como diferentes hipóteses ecológicas (fertilidade do solo, complementariedade de nichos, distribuição dos traços funcionais ou simplesmente a quantidade de vegetação inicial) atuam simultaneamente na produtividade das florestas estacionais tropicais. Nossos resultados mostraram que a produtividade de biomassa destas florestas é impulsionada principalmente pela quantidade de vegetação inicial (sendo maior em florestas com maior biomassa inicial) e pela distribuição dos traços funcionais entre as espécies (maior produtividade em florestas com traços funcionais conservativos). Surpreendentemente, a produtividade não esteve ligada à complementariedade de nichos, e negativamente à fertilidade solo. Estes resultados realçam que, de um ponto de vista funcional, existe um paradoxo na produtividade de florestas estacionais e florestas úmidas. Também foi avaliado como o crescimento e a mortalidade das espécies é direcionada pelos seus traços funcionais, e como estas relações mudam com sua ontogenia. Foi observado que, em indivíduos de estatura menor, traços funcionais relacionados ao aumento da captura de luz, como maior área foliar e área de copa, aumentam as taxas de crescimento e/ou reduzem as taxas de mortalidade. Em indivíduos maiores, traços funcionais que aumentam a tolerância à seca, como maior densidade de madeira, reduzem as taxas de mortalidade. Finalmente, foi avaliado como as interações entre indivíduos arbóreos vizinhos, mediadas pelos seus traços funcionais, determinam o crescimento, sobrevivência e/ou recrutamento de uma determinada árvore focal. Foi encontrado que o efeito direto dos traços da árvore focal, independente de seus vizinhos, é o principal componente que influencia os processos demográficos. Mesmo assim, a influência da "quantidade" e da "qualidade" dos vizinhos também foi suportada, sendo que alguns traços funcionais aumentaram a competição e outros aumentaram a tolerância à maior concentração de árvores vizinhas. Estes resultados indicam que os traços interespecíficos podem promover simultaneamente a dominância local por um grupo de espécies com alto crescimento e sobrevivência, ao mesmo tempo em que outros traços aumentam a tolerância à competição e o recrutamento, o que permite estabilizar as diferenças entre os nichos e promover a diversidade local.
INTRODUÇÃO GERAL
As florestais tropicais sustentam grande parte do equilíbrio e produtividade dos ecossistemas globais (FAO 2015). Estima-se que mais de um bilhão de pessoas dependam diretamente de atividades relacionadas à exploração destas florestas (Kamanga et al. 2009), e são inúmeros os serviços ecossistêmicos diretos e indiretos que estas florestas provêm, como estoque e sequestro de carbono, estabilidade climática, proteção e manutenção dos regimes hídricos, abrigo e recursos para a fauna, produção de alimentos, remédios e combustíveis (Diaz et al. 2011). Compreender os padrões estruturais e os processos dinâmicos destas florestas é fundamental para o entendimento do funcionamento de todos os sistemas biológicos, além de permitir o estabelecimento de predições sobre como os ambientes naturais responderão às crescentes intervenções antrópicas (Chazdon 2014).
Embora estudos indiquem que existe um padrão na dinâmica e funcionamento das florestas tropicais (Lewis et al. 2009), a alta diversidade alfa e a baixa densidade apresentada pela maioria das espécies dificultam a compreensão e determinação destes padrões ecológicos (Gourlet-Fleury et al. 2005). Além disso, a baixa similaridade florística entre os fragmentos florestais, fortemente influenciada pela distância entre eles, restringe os estudos a uma escala regional de comparação (Nekola & White 1999; Condit et al. 2002).
classificações taxonômicas, permitem a comparação dos resultados em uma dimensão global (Pérez-Harguindeguy et al. 2013).
Grande parte do conhecimento sobre os traços funcionais em florestas tropicais provém de estudos em florestas úmidas (pluviais ou ombrófilas), sendo comum a extrapolação das informações para outra as florestas estacionais (Lohbeck et al. 2015). Estas, no entanto, apresentam processos estruturais, funcionais e sucessionais muito distintos, principalmente por estarem condicionadas à estacionalidade climática (dois a seis meses de seca) (Murphy & Lugo 1986). As florestas estacionais tropicais estão entre os ecossistemas mais fragmentados e ameaçados no mundo (Miles et al. 2006) e, esta complexidade de sua estrutura funcional, que envolvem deciduidade e restrição aos períodos de crescimento e reprodução de muitas espécies no período seco, aumentam sua suscetibilidade à perturbação (Kalacska et al. 2004). Conhecer os padrões e processos funcionais das florestas estacionais tropicais permitirá subsidiar políticas de manejo sustentável e conservação destas florestas.
REFERÊNCIAS BIBLIOGRÁFICAS
Chave, J., Réjou-Méchain, M., Búrquez, A., Chidumayo, E., Colgan, M.S., Delitti, W.B.C., Duque, A., Eid, T., Fearnside, P.M., Goodman, R.C., Henry, M., Martínez-Yrízar, A., Mugasha, W.A., Muller-Landau, H.C., Mencuccini, M., Nelson, B.W., Ngomanda, A., Nogueira, E.M., Ortiz-Malavassi, E., Pélissier, R., Ploton, P., Ryan, C.M., Saldarriaga, J.G. & Vieilledent, G. (2014) Improved allometric models to estimate the aboveground biomass of tropical trees. Global Change Biology, 20: 3177-3190.
Chazdon, R. L. (2014) Second growth: the promise of tropical forest regeneration in an age of deforestation. University of Chicago Press, Chicago, Illinois, USA.
Condit R., Pitman N., Leigh E.G., Chave J., Terborgh J., Foster R.B., Nunez P., Aguilar S., Valencia R., Villa G., Muller-Landau H.C., Losos E. & Hubbell S.P. (2002) Beta-diversity in tropical forest trees. Science 295: 666-669.
Díaz, S., Quétier, F., Cáceres, D.M., Trainor, S.F., Pérez-Harguindeguy, N., Bret-Harte, M.S., Finegan, B., Peña-Claros, M. & Poorter, L. (2011) Linking functional diversity and social actor strategies in a framework for interdisciplinary analysis of nature's benefits to society. Proceedings of the National Academy of Sciences, 108: 895-902.
FAO - Food and Agriculture Organization of The United Nations (2015) Global forest resources assessment. FAO, Rome, Italy.
Gourlet-Fleury, S.; Blanc, L.; Picard, N.; Sist, P.; Dick, J.; Nasi, R.; Swaine, M.D. & Forni, E. (2005) Grouping species for predicting mixed tropical forest dynamics: looking for a strategy. Annual Forest Science, 62: 785-796.
Kalacska M., Sanchez-Azofeifa G.A., Calvo-Alvarado J.C., Quesada M., Rivard B. and Janzen D.H. (2004) Species composition, similarity and diversity in three successional stages of a seasonally dry tropical forest. Forest Ecology and Management, 200: 227-247.
Kamanga, P., Vedeld, P., & Sjaastad, E. (2009) Forest incomes and rural livelihoods in Chiradzulu District, Malawi. Ecological Economics, 68(3), 613-624.
Lohbeck, M., Lebrija-Trejos, E., Martínez-Ramos, M., Meave, J. A., Poorter, L., & Bongers, F. (2015) Functional Trait Strategies of Trees in Dry and Wet Tropical Forests Are Similar but Differ in Their Consequences for Succession. PLoS ONE 10(4): e0123741.
Miles L., Newton A.C., DeFries R.S., Ravilious C., May I., Blyth S., Kapos V. & Gordon J.E. (2006) A global overview of the conservation status of tropical dry forests. Journal of Biogeography 33: 491-505.
Murphy P.G. & Lugo A.E. (1986) Ecology of tropical dry forest. Annual Review of Ecology and Systematics 17: 67-88.
Nekola J.C. & White P.S. (1999) The distance decay of similarity in biogeography and ecology. Journal of Biogeography 26: 867-878.
Pérez-Harguindeguy, N., Díaz, S., Garnier, E., Lavorel, S., Poorter, H., Jaureguiberry, P., Bret-Harte, M.S., Cornwell, W.K., Craine, J.M., Gurvich, D.E., Urcelay, C., Veneklaas, E.J., Reich, P.B., Poorter, L., Wright, I.J., Ray, P., Enrico, L., Pausas, J.G., de Vos, A.C., Buchmann, N., Funes, G., Quétier, F., Hodgson, J.G., Thompson, K., Morgan, H.D., ter Steege, H., van der Heijden, M.G.A., Sack, L., Blonder, B., Poschlod, P., Vaieretti, M.V., Conti, G., Staver, A.C., Aquino, S. & Cornelissen, J.H.C. (2013) New handbook for standardised measurement of plant functional traits worldwide. Australian Journal of Botany, 61: 167-234.
Poorter, L., Wright, S.J., Paz, H., Ackerly, D.D., Condit, R., Ibarra-Manríquez, G., Harms, K.E., Licona, J.C., Martínez-Ramos, M., Mazer, S.J., Muller-Landau, H.C., Peña-Claros, M., Webb, C.O. & Wright, I.J. (2008) Are functional traits good predictors of demographic rates? Evidence from five neotropical forests. Ecology, 89: 1908-1920.
CAPÍTULO 1
Conservative species drive biomass productivity in tropical dry forests1
SUMMARY
1. Forests account for a substantial part of the terrestrial biomass storage and productivity. To better understand forest productivity we need to disentangle the processes underlying net biomass change.
2. We tested how above-ground net biomass change and its underlying biomass dynamics (biomass recruitment, growth, and mortality) can be explained by four alterative and contested hypotheses; the soil fertility, biomass ratio, niche complementarity and vegetation quantity hypotheses.
3. Above-ground biomass dynamics was evaluated over a five-year period in 200 permanent sample plots in 8 tropical dry forests in Brazil, and related to soil fertility, community-weighted mean (CWM) traits that are important for carbon storage and sequestration (wood density, specific leaf area, maximum stem diameter and deciduousness), species richness, functional diversity, and initial stand biomass.
4. Initial stand biomass was the best predictor of all three processes of biomass dynamics, providing strong support for the vegetation quantity hypothesis. In these dry forests the dominance of conservative species, rather than of acquisitive species, is associated with high biomass growth and storage, probably because their low specific leaf area and high wood density allows them to keep on functioning during drought stress.
5. Paradoxically, high soil fertility (Ca) led to low biomass productivity, probably because of nutrient imbalance.
6. In contrast to what is shown for controlled experiments, we found no support for niche complementarity (in terms of functional diversity or species richness) for forest
1 Manuscript accepted in Journal of Ecology in 11/01/2016 and formatted following the instructions for
productivity. Biomass storage was favoured by low- rather than high trait diversity, as most of the biomass is concentrated in species with large stem diameter and high wood density.
7. Synthesis: Biomass dynamics is mainly shaped by vegetation quantity, and then by vegetation quality, in line with the mass ratio hypothesis. Dry forests show different
trait-productivity relationships than wet forests, as stands with “slow” trait values are “fast” in
terms of productivity. Diversity matters, but in a different way than expected; high trait diversity does not enhance productivity, but instead, does low trait diversity enhance carbon storage.
INTRODUCTION
Forests account for 70– 90% of terrestrial above and below-ground biomass (Houghton, Hall & Goetz 2009) and they present therefore a major global carbon sink (Brienen et al. 2015). To better understand forest productivity, we need to disentangle the processes underlying net biomass change. Net changes in forest above-ground biomass are the result of three processes of biomass dynamics: biomass gain from recruiting trees, biomass growth of surviving trees, and biomass loss from mortality (Brienen et al. 2015; Rozendaal & Chazdon 2015). Yet, most biomass productivity studies have focused on total biomass change over time, disregarding how the underlying processes are shaped by different drivers. Different dynamic processes are shaped by different drivers acting simultaneously, such as soil nutrient availability (Quesada et al. 2012), vegetation quantity (i.e., the initial stand biomass) and vegetation quality (i.e. species richness and their functional attributes; Finegan et al. 2015; Lohbeck et al. 2015). Furthermore, these differences can vary among vegetation types and with spatial and temporal scales (Malhi 2012).
litter decomposition (Wright et al. 2011), and high productivity in tropical forests is often found on very infertile soils (Malhi 2012).
The biomass ratio hypothesis predicts that ecosystem processes are driven by the (traits of the) most abundant species in the community (Grime 1998). If the biomass ratio hypothesis plays a role, then productivity should be closely related to the community-weighted mean trait values (CWM), a community metric that weights species trait values by the relative basal area of the species in the community (Garnier et al. 2004). Higher biomass productivity is expected for communities dominated by fast-growing acquisitive species, having higher specific leaf area resulting in higher light capture, photosynthetic rates and net carbon gain (Poorter & Bongers 2006), and also have lower wood density resulting in high stem hydraulic conductivity and photosynthetic carbon gain (Santiago et al. 2004) and lower construction costs per wood volume (Chave et al. 2009). Conversely, these trait values may also result in higher biomass mortality of the community because acquisitive species have higher respiratory rates, and suffer more from herbivory, stem breakage and pathogen attack (Reich et al. 2003; Wright et al. 2010).
Consequently, studies have found no relationship or even a negative relationship between taxonomic diversity and productivity (Vilà et al. 2003; Cavard et al. 2010). Functional traits provide a mechanistic link between species identity and ecosystem functioning, and productivity could therefore be more closely related to the variation in trait values in the community (i.e. functional trait diversity, Díaz et al. 2011) than to species richness. For example, higher functional diversity can indicate a pool of coexisting species with different life histories and ecological traits, e.g. multilayered canopies, roots at different depths and different light requirements, optimizing resources use (Vilà et al. 2013). An increasing number of studies have tested whether and how functional trait diversity contributes to productivity and many of them found no support for the contribution of niche complementarity hypothesis promoting ecosystem productivity (Conti & Díaz 2013; Finegan et al. 2015; Lohbeck et al. 2015).
The green soup hypothesis predicts that productivity is mainly driven by vegetation biomass, suggesting that vegetation “quantity” is more important than vegetation “quality”
(sensu Lohbeck et al. 2015). A tight positive relationship between productivity and vegetation biomass is especially found early in succession (Lohbeck et al. 2015), where higher leaf area index results in higher light capture and total carbon gain. Later in succession, forest stands are closed and the light availability is reduced, leading to a negative relation between productivity and vegetation biomass (Peña-Claros et al. 2008; Toledo et al. 2011; Finegan et al. 2015; Rozendaal & Chazdon 2015).
availability limits forest growth in dry forests whereas light availability does so in wet forest (Lohbeck et al. 2013). Thus, conservative trait values that enhance drought tolerance, such as dense wood (implying less hydraulic failure, Pineda-García, Paz & Meinzer 2013) and lower specific leaf area (implying less transpiration, Poorter & Bongers 2006), may enhance species performance and hence, productivity in dry forests, whereas these conservative trait values are found to reduce biomass productivity in wet forests (Malhi et al. 2004; Finegan et al. 2015). Similarly, the niche complementarity effect has been found to be stronger in more stressful environments (Paquette & Messier 2011) and should, therefore, be more apparent in dry forests compared to wet forests.
METHODS
Research sites, species and soil sampling
This study was conducted in eight seasonal tropical dry forests (18º29‟ to 19º40‟ S and 47º30‟
to 48º24‟ W), in Minas Gerais state, Southeastern Brazil (Appendix S1). The region
experiences a tropical savanna climate (Aw Megathermic climate of Köppen), characterized by rainy summers (October to March) and dry winters (April to September). Annual rainfall ranges from 1123 to 1547 mm, dry season length from four to six months of drought (with less than 100 mm rainfall during the dry season) and mean annual temperature of 21-22º C (Appendix S1). The study areas are located in conservation units or legal reserves and are surrounded by an agricultural or urban matrix (Lopes et al. 2012). The forests were slightly disturbed (up to 2004) by cattle grazing and/or very light selective logging (maximum one or two trees per hectare). Plots were established, in the core areas in each site, where we did not find any sign of tree stumps or logging. Based on the forest structure (e.g., high basal area) and the observed low growth rates, we consider the forests as mature. Since the disturbance was light or absent in our plots, we expect that it had minimal effects on our results. Soil type in studied areas is primarily red latosols that vary from moderately to strongly acidic (Embrapa 1982).
In each forest, 25 contiguous permanent sample plots (20 × 20 m) were established totaling one ha per site. In the first census, which was carried out at different time periods for each forest (t0, 2006-2009), all trees with stem diameter at breast height (DBH, 1.30 m) ≥ 5
cm were tagged, their diameter was measured, height estimated, and identified to species level. In the second census, after five years for each forest (t1, 2011–2014), all trees were
To determine soil nutrient availability, soil samples were collected from 0-20 cm soil depth at three fixed locations distributed in each plot. The three samples were pooled, sieved with a 2-mm sieve to remove roots and stones and air-dried for 24 hours. Soil analyses were conducted at the Soil Laboratory of Agricultural Sciences Institute of the Federal University of Uberlandia, Brazil for the following soil variables: pH (distilled water solution), phosphorus and potassium (Mehlich III extraction method, P and K in mg.dm-3), calcium (Ca), magnesium (Mg), aluminum (Al) and cation exchange capacity (CEC, the sum of all exchangeable cations K, Ca, Mg, Al and acidity, in KCl 1mol.L-1 solution, in cmol.dm-3). Additional information on soil nutrients values can be found in Appendix S2.We did not measure soil nitrogen, which tends to have a positive effect on forest productivity, although soil P is more often found to be limiting in tropical forests that occur on highly weathered soils (i.e. our study areas, Quesada et al 2012).
Forest structural and species diversity variables
To describe forest structure and diversity, we evaluated at t0 four structural and species
diversity variables per plot: tree density (ha-1), rarefied species richness (S, from a random sampling of 30 individuals as this number of individuals is found in most plots),
Shannon-Wiener index (H‟) and Pielou‟s index (J‟). These two last diversity measures take also the
relative abundance of each species into account, and are therefore better indicators of species diversity and species evenness than species richness. We used rarefied species richness instead of species richness to correct for the confounding positive effect of tree density in species richness. These variables were calculated in R 3.1.2 (R Development Core Team
2013), using the “vegan” package (Oksanen et al. 2014). Additional information on structural
Functional traits
We evaluated four key functional traits that are important for biomass productivity: a whole plant trait (maximum stem diameter Dmax), a stem trait (wood density WD), and two leaf traits
(specific leaf area SLA; and deciduousness Dec, whether a species is deciduous or evergreen). Traits were evaluated for most species (171 for Dmax, WD and Dec, and 106 species for SLA),
and these species covered together 89% (range 79-93%) of the initial basal area of each forest. Traits were measured according to standard measurement protocols (Dmax and SLA,
Pérez-Harguindeguy et al. 2013), obtained from the global wood density database (WD, g.cm-3, Zanne et al. 2009, available online), or obtained from previous studies in the area (Dec, Lopes et al. 2014). Species maximum stem diameter (cm) is a potential indicator of tree longevity and life history strategy, and was calculated as the upper 95-percentile stem diameter for those trees whose diameter was equal to or greater than 10% of the observed maximum diameter of a population (King, Davies & Noor 2006). We used the DBH dataset of the first census to calculate species Dmax. Specific leaf area (leaf area divided by leaf dry mass, mm2.mg-1) is an
indicator of light interception efficiency and transpiration rates (Poorter & Bongers 2006). SLA was measured from fully expanded sun and shade leaves, with no obvious symptoms of pathogen or herbivore damage. Ten leaves were collected from 5-10 (average 7.8) adult trees (with DBH near to Dmax) for each species. Wood density is an indicator of the volumetric
Community weighted mean traits and functional diversity indices
Community weighted mean (CWM) trait values and functional diversity (FD) indices were calculated per plot for the initial census.Traits were weighted by species‟ relative basal area
in the plot t0. We used species basal area as a weighting-factor because basal area reflects
relative biomass which is a better indicator of plant performance than abundance. For functional diversity we excluded deciduousness because it is a binary trait (evergreen or deciduous). We used three complementary indices to measure FD (Mason et al. 2005; Villéger, Mason & Mouillot 2008): functional richness (Fric) as the amount of
multivariate-trait space filled by the community; functional evenness (Feve) that indicates how species‟
basal area is spread over multivariate-trait space (Feve is higher when basal area distribution is
homogeneous across the multivariate-trait space); and functional divergence (Fdiv) as the
degree of divergence from the center that most dominant species occupy in multivariate-trait space (Fdiv is higher when most of basal area is concentrated in the extremes of the
multivariate-trait space). These functional diversity indices are orthogonal, i.e. there is no dependence between them a priori (Mason et al. 2005). All CWM and FD indices were
calculated using the “FD” package in R (Laliberté & Legendre 2010). Additional information
on community weighted mean (CWM) trait and functional diversity (FD) values can be found in Appendix S2.
Estimation of forest aboveground biomass components
We calculated aboveground biomass (AGB) for each tree based on tree DBH (cm), height (H,
m)and species‟ wood density (WD, g.cm-3): AGB = 0.0673×(WD×DBH2×H)0.976 (Chave et
al. 2014).
Initial biomass (AGBi, Mg.ha-1) – initial biomass of sampled trees in the first census (t0);
Biomass increment of survivors (AGBsurv, Mg.ha-1.yr-1) – annual biomass increment produced
by the growth of all trees that survived from t0 to t1;
Biomass increment of recruits (AGBrecr, Mg.ha-1.yr-1) – annual biomass increment obtained
from the trees that attained at least 5 cm DBH in t1 and that were not sampled in t0. AGBrecr
was calculated as the biomass of the recruit minus the biomass of the same individual with a DBH of 5 cm. Thus, we assume that the tree was recruited immediately after the first census and avoid biomass overestimation assuming that recruits had initial DBH of 0 cm in the initial census (Talbot et al. 2014).
Biomass mortality (AGBmort, Mg.ha-1.yr-1) – annual biomass loss obtained from the trees that
died between t0 and t1. To be able to compare biomass loss (i.e., mortality) with biomass gain
(i.e., recruitment and growth), the biomass mortality was calculated as the biomass of the tree in the initial census, minus the biomass of the same individual with a DBH of 5 cm (Talbot et al. 2014).
Net biomass change (AGBnet, Mg.ha-1.year-1) – is the net annual change in biomass during the
census period (t1– t0), calculated as AGBnet = AGBsurv + AGBrecr - AGBmort.
Statistical analyses
dynamics (AGBsurv, AGBrecr and AGBdead) to soil nutrients (pH, P, K, Ca, Mg, Al and CEC),
community weighted mean trait values (CWMdmax, CWMwd, CWMsla, CWMdec), taxonomic
diversity (S, H‟, J‟), functional diversity indices (Fric, Feve, Fdiv) and vegetation “quantity”
(initial biomass and tree density) using linear mixed models, including sites as a random effect. We used all subsets regression analysis and selected the models that had lowest Akaike Information Criterion (AIC). Models were considered to be equally supported if the difference in AIC was less than two units (Burnham & Anderson 2002). When models were equally supported, we selected the most parsimonious model (with lowest number of predictors). When necessary, data were log10 or square root-transformed prior to analysis, to meet the
assumptions of normality, homoscedasticity, reduce the effect of outliers and to account for possible nonlinear relationships between variables. We calculated the conditional (c) and marginal (m) R2 for the best model of each process following (Nakagawa & Schielzeth 2013).
R2c indicates the variance explained by both fixed and random effects, whereas R2m indicates
the variance explained by fixed effects only. When R2m value is close to R2c, then most of the
variation explained in the biomass components is caused by the predictors (fixed effects), rather than by site differences (random effect). We evaluated the relative importance of each ecological hypothesis (soil fertility, biomass ratio, niche complementarity or green soup) by comparing for each biomass component the standardized regression coefficients (β) of
predictors retained in the best multiple regression model. Mixed-effects models were
performed using the “lme4” package (Bates et al. 2011) and all subsets regression analyses
using the “MuMIn” package (Burnham & Anderson 2002). Bivariate relationships between
biomass components and tested predictors can be found in Appendix S4. To evaluate whether
predictors were associated, we provided a Kendall‟s (tau) correlation matrix between all pairs
RESULTS
Average initial biomass across plots was 246.39 Mg.ha-1 ± 13.75 (average ± standard error), net biomass change was 0.27 Mg.ha-1.yr-1 ± 0.62, biomass growth of surviving trees was 3.88 Mg.ha-1.yr-1 ± 0.17, biomass growth of recruiting trees was 0.06 Mg.ha-1.yr-1 ± 0.01, and biomass mortality was 3.67 Mg.ha-1.yr-1 ± 0.61 (Appendix S2). Multiple regression analysis indicated that net biomass change (Fig. 2, R2m = 0.93) was mostly driven by mortality
(standardized regression coefficient β = -0.88), followed by biomass growth of surviving trees
(β = 0.35). Biomass recruitment did not contribute strongly to net biomass change (β = 0.036)
and was not included in the model, probably because of its low absolute values.
Our best model for biomass growth of survivors (AGBsurv, R2m = 0.42) included the
effect of AGBi (β = 0.59), CWMsla (β = -0.18) and soil calcium (β = -0.13) (Table 1, See
Appendix S6 for scatterplots of the bivariate relationships between demographic biomass processes and drivers). This indicates that biomass growth of surviving trees is higher in plots with higher stand biomass, dominated by species with lower specific leaf area, and located on soils with lower calcium concentration. Biomass recruitment (AGBrecr, R2m=0.10) was best
predicted by AGBi (β = -0.24) and CWMdec(β = 0.21) (Table 1), indicating that communities
with lower stand biomass and dominated by deciduous species have higher biomass recruitment. Biomass mortality (AGBmort, R2m=0.05) was predicted by AGBi only (β = 0.22)
(Table 1), indicating that communities with higher stand biomass have higher biomass loss from mortality. Initial biomass itself (AGBi, R2m=0.58) was best predicted by CWMdmax (β =
0.59), CWMwd (β = 0.16), Fdiv (β = 0.16) and Feve (β = -0.20) (Table 1), indicating that
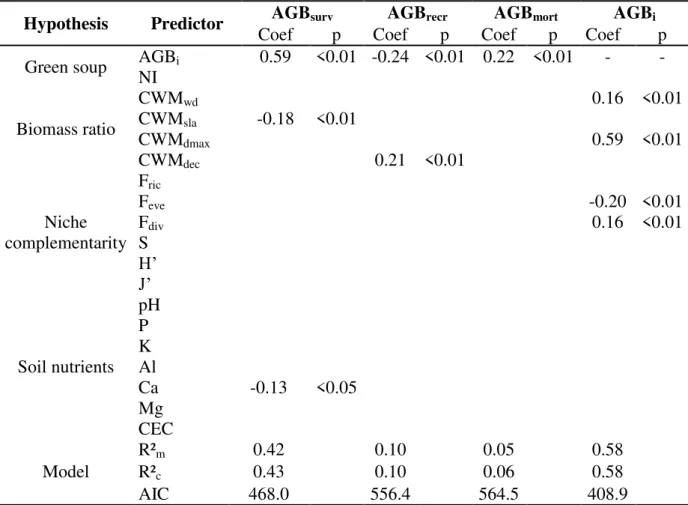
Table 1. Best models obtained from a series of multiple regression analyses for each biomass components (AGBsurv, AGBrecr AGBmort, AGBi) and 19 predictors using linear mixed models
and including sites as random effect. Standardized multiple regression coefficients (Coef), significance levels (p), conditional (c) and marginal (m) R2 (R2c = both fixed and random
effects, and R2m = fixed effects only) and Akaike Information Criterion (AIC) are given.
AGBi = stand biomass, AGBnet = net biomass change, AGBsurv = biomass growth of surviving
trees, AGBmort = biomass mortality, AGBrecr = biomass recruitment, NI = tree-density (ha-1),
CWM = community weighed mean, WD = wood density, Dmax = maximum stem diameter,
SLA = specific leaf area, Dec = deciduousness, S = rarefied species richness, H‟ = Shannon
-Wiener index, J‟ = Pielou‟s index, Fric = functional richness, Feve = functional evenness, Fdiv =
functional divergence, P = phosphorous, K = potassium, Ca = calcium, Mg = magnesium, Al = aluminum, CEC = cation exchange capacity.
Hypothesis Predictor Coef AGBsurvp Coef AGBrecrp Coef AGBmortp Coef AGBip Green soup AGBNI i 0.59 <0.01 -0.24 <0.01 0.22 <0.01 - -
Biomass ratio
CWMwd 0.16 <0.01
CWMsla -0.18 <0.01
CWMdmax 0.59 <0.01
CWMdec 0.21 <0.01
Niche complementarity
Fric
Feve -0.20 <0.01
Fdiv 0.16 <0.01
S H‟ J‟ Soil nutrients pH P K Al
Ca -0.13 <0.05
Mg CEC Model
R²m 0.42 0.10 0.05 0.58
R²c 0.43 0.10 0.06 0.58
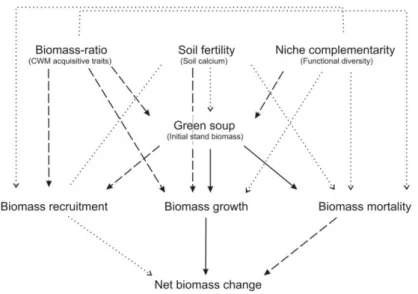
Fig. 1. Conceptual framework showing how changes in net above-ground biomass are determined by underlying dynamical processes (biomass recruitment, growth, and mortality), that are expected to be driven by soil nutrients, trait values of the dominant species (biomass ratio hypothesis), taxonomic and functional diversity (niche complementarity hypothesis) and by the stand biomass-dependent effect (green soup hypothesis). Black arrows refer to positive effects and dash arrows refer to negative effects. See text for further explanation.
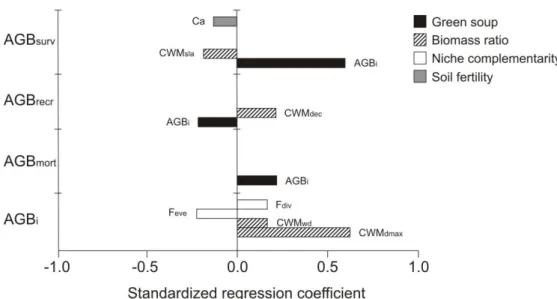
Fig. 2. Combination of the best models obtained from a series of multiple regression analyses for each biomass components (AGBsurv, AGBrecr AGBmort, AGBi) and the tested hypotheses
Fig. 3. Comparison among the effect of four ecological hypotheses (soil fertility, biomass ratio, niche complementarity and green soup) on biomass dynamics in tropical dry forests. Standardized regression coefficients can directly be compared among each other; the higher the value, the stronger the relationship observed. Only significant effects are included (see Table 1 for more information). AGBi = stand biomass, AGBnet = net biomass change, AGBsurv
= biomass growth of surviving trees, AGBmort = biomass mortality, AGBrecr = biomass
DISCUSSION
We assessed how different ecological hypotheses (soil fertility, biomass ratio, niche complementarity and green soup) shape net biomass change in tropical dry forests. To understand changes in biomass we disentangle its underlying dynamic processes (biomass recruitment, growth, and mortality) (Fig. 1 and 2). We found strong support for the green soup hypothesis for all biomass dynamic processes (Table 1). The biomass ratio hypothesis was also important for growth and recruitment, and contrary to what has been found in moist and wet forests, conservative species rather than acquisitive species were related to higher productivity and biomass storage in dry forests. We found no support for the niche complementarity and soil fertility hypotheses on net biomass change in these dry forests.
Net biomass change is mainly driven by mortality
We evaluated the role of underlying biomass dynamic processes (biomass growth, recruitment and mortality) in the net biomass change of tropical dry forests. We found that biomass mortality (AGBmort) was the major determinant of net biomass change (standardized
coefficient -0.88), with a smaller contribution of biomass growth (AGBsurv 0.35), whereas
biomass recruitment (AGBrecr 0.036) was not a strong contributing factor for our net biomass
change model (Fig. 2). This is probably due the lower absolute mean values for recruitment (0.06 Mg.ha-1.year-1) compared to growth of surviving trees (3.88 Mg.ha-1.year-1) and mortality (3.67 Mg.ha-1.year-1). Biomass gain from recruitment may be more important in early stages of forest recovery after disturbances (Carreño-Rocabado et al. 2012; Rozendaal & Chazdon 2015).
Biomass mortality was only explained by initial stand biomass. It was the process with the lowest R2m (variation explained by fixed effects only = 0.05, Table 1). Mortality is less
accurate mortality estimates (Poorter et al. 2008; Brienen et al. 2015). The importance of biomass mortality for net biomass change increases with stand age (cf. Malhi 2012) due to reduction in light availability and self-thinning (Rozendaal & Chazdon 2015). However, it is uncertain to what extent light limitation determines tree mortality in dry forests, especially for larger trees that contribute most to biomass mortality. Hence, at community-level, biomass mortality is most important for net biomass change, but it depends itself only on vegetation quantity, and not on other drivers, that are often thought to be important for ecosystem productivity (such as niche complementarity, biomass-ratio or soil nutrient availability).
Biomass recruitment is driven by the abundance and phenology of canopy trees
We predicted that biomass recruitment would decline with initial stand biomass, because the shaded conditions of closed forest provide little opportunity for regeneration in the understory due to light limitations and water competition (Finegan et al. 2015). We indeed found that biomass recruitment was higher in stands with a lower initial biomass, and also in stands dominated by deciduous species (i.e., higher CWMdec). This indicates that biomass
of canopy trees provide an ecological filter for dry forest regeneration, either by increasing competition for water or by reducing light availability.
Biomass growth is higher in forests with more biomass
We predicted that biomass growth of surviving trees is higher in forests with higher initial stand biomass, because most trees initially present survive during the census, and the more biomass they initially have, the faster they can grow (cf. Stephenson et al. 2014). We indeed found that initial stand biomass had a strong positive effect on biomass growth of survivors (Fig 3). Our results contrast with many studies in moist and wet forest studies that found no or even negative relationships between (biomass) growth rates and initial biomass, probably because of stronger light limitation and resource competition (Hughes, Kauffman & Jaramillo 1999; Peña-Claros et al. 2008; Finegan et al. 2015). Stands with higher initial biomass show therefore a higher biomass growth of survivors and higher biomass mortality, but lower biomass recruitment. These results highlight that one driver can shape the underlying demographic processes differently, and it is therefore important to disentangle how different drivers affect different processes, and hence net biomass change (Malhi 2012).
during the onset of the dry period (Baltzer et al. 2008; Klein 2014). These results suggest that biomass growth of surviving trees in dry forests productivity is limited by water availability rather than by light availability. CWMwd was not included in the best model for biomass
growth of surviving trees, but it had an indirect effect on biomass growth through its positive effect on initial stand biomass (which, in turn, had a positive effect on biomass growth) (Table 1). Higher wood density can also directly contribute to tree and stand growth, as it enables hydraulic functioning during drought (Markesteijn et al. 2011). Our study shows that the acquisitive-conservative trait spectrum has different consequences for wet and dry forests (cf. Lohbeck et al. 2013); although conservative trait values lead to lower biomass productivity in wet forests (Malhi et al. 2004; Finegan et al. 2015), they may increase species performance and productivity in dry forests.
The paradox of low productivity on soils with high nutrient availability
In temperate regions, forest productivity is often limited by nitrogen (Martinelli et al. 1999) (which was not measured in our study), whereas in tropical regions like our study site, forest productivity is often limited by phosphorus, because the soils are highly weathered due to a warm and wet climate (i.e. our study sites, Quesada et al 2012). We predicted that soil nutrient availability would increase biomass growth, but we found instead that soil calcium had a negative effect (cf. Wullaert et al. 2013; Quintero-Vallejo et al. 2015). In high pH soils, calcium can react with inorganic phosphorus and form mineral insoluble calcium phosphate, which makes phosphorus unavailable for most plants (Tyler 1996). Higher concentration of calcium in plants tissues can also result in nutrient imbalance and calcium toxicity that inhibits growth and causes mortality (Jefferies & Willis 1964; Quintero-Vallejo et al. 2015). Finally, species with conservative trait values (high wood density and low specific leaf area)
N=200) because these traits enhance nutrient residence time in the plants (Reich et al. 2003; Baraloto et al. 2011; Unger, Homeier & Leuschner 2012). In our dry forest, the same conservative trait values are important to deal with drought, and may enhance productivity. Therefore, our results suggest that in dry forests, soil water availability may be a stronger driver of biomass productivity than soil fertility.
High stand biomass in forests with low trait diversity and dominated by conservative species
Forests dominated by species with large potential adult stature (high maximum stem diameter) and conservative trait values (higher wood density) had higher stand biomass. Large species have a large stem volume, and species with dense wood have a higher biomass per unit stem volume (Chave et al. 2009), thus leading to higher stand biomass (cf. Slik et al. 2010). Moreover, life-history theory predicts that large species have lower inherent mortality and turnover (Pianka 1970; Poorter et al. 2008), and dense wood enhances resistance to stem breakage (van Gelder, Poorter & Sterck 2006; Chave et al. 2009) and hydraulic failure especially in dry environments (Poorter & Markesteijn 2008). In combination these adaptations may lead to less biomass turnover, and hence, a larger standing biomass over time (Malhi et al. 2006; Malhi 2012; Conti & Díaz 2013).
Stand biomass was positively affected by functional divergence and negatively affected by functional evenness (Table 1). High functional divergence indicates that basal area is concentrated in the extremes of multivariate-trait space while low functional evenness indicates that basal area is concentrated in a restricted part of this same multivariate-trait space (Villéger, Mason & Mouillot 2008). In combination, low trait diversity (high functional divergence and low functional evenness) and high CWM for wood density and Dmax suggest
Stands dominated by mostly tall and dense wooded species with a narrow range of trait values have, therefore, higher standing biomass (cf. Conti & Díaz 2013). This is in agreement with other studies that show that biomass storage is better explained by the biomass ratio hypothesis than by the niche complementarity hypothesis (Conti & Díaz 2013; Finegan et al. 2015; Lohbeck et al. 2015).
Green soup and biomass ratio hypotheses better explain demographic drivers of biomass change than do the niche complementarity and soil fertility hypotheses
We assessed how different ecological hypotheses (soil fertility, biomass ratio, niche complementarity and green soup) shape net biomass change in tropical dry forests. We predicted that there would be higher biomass growth, recruitment and mortality on fertile soils and for communities that are dominated by fast-growing acquisitive species, that niche complementarity increases recruitment and growth and reduces mortality, and that higher stand biomass reduces recruitment and increases growth and mortality (Fig. 1). Initial stand biomass was the best predictor of all three demographic biomass processes (Table 1, Fig. 3), providing strong support for the green soup hypothesis that vegetation biomass shapes ecosystem processes (Lohbeck et al. 2015). The biomass ratio hypothesis was supported for biomass growth (CWMsla) for biomass recruitment (CWMdec) and for initial biomass
(CWMdmax and CWMwd). The soil fertility hypothesis (Ca for biomass growth) and the niche
complementarity hypothesis (Feve and Fdiv for initial biomass) had a limited effect on forest
that interspecific trait-mediated and trait-hierarchy plays a major role in species performance (Uriarte et al. 2010; Lasky et al. 2014) instead of trait dissimilarity (niche complementarity). In this way, an increase in dominance of certain trait species (in our study conservative traits) may enhance stand productivity since they are better able to face environmental filtering (Lasky et al. 2014). We also found no or even negative effect of soil nutrients on biomass processes. Since dry forest species may be strongly constrained by water availability, soil nutrient availability may be less important, as plants cannot show their full potential response to increases in soil fertility. The productivity of dry forests is therefore shaped by species with conservative trait values that are better competitors under dry and infertile conditions.
CONCLUDING REMARKS
Our study can be summarized in three main results. First, biomass dynamic processes were mostly driven by the vegetation quantity and biomass ratio hypotheses, while we found no or even negative effects of soil fertility and niche complementarity. Second, different drivers affect different biomass dynamic processes. To understand changes in forests productivity, it is therefore important to disentangle the processes underlying net biomass change. Third, from a functional point of view, dry forests show different trait-productivity relationships than what has been shown for wet forests. In dry forests, the dominance of conservative species, rather than of acquisitive species, is associated with high biomass growth and storage, probably because these conservative species perform better in drought-stressed systems. Our results suggest that the lack of globally consistent effects of functional traits on forest productivity (cf. Paine et al. 2015) is caused by different traits becoming important in different environments (Lohbeck et al. 2013). This study advances understanding of dry forest biomass productivity, and can help predicting how tropical forests will respond to future increases in drought stress (Brienen et al. 2015), changing the overall trait-productivity relationships in worldwide traits economic spectrum.
REFERENCES
Baltzer, J.L., Davies, S.J., Bunyavejchewin, S. & Noor, N.S.M. (2008) The role of desiccation tolerance in determining tree species distributions along the Malay–Thai Peninsula. Functional Ecology, 22, 221-231.
Baraloto, C., Rabaud, S., Molto, Q., Blanc, L., Fortunel, C., Hérault, B., Dávila, N., Mesones, I., Rios, M., Valderrama, E. & Fine, P.V.A. (2011) Disentangling stand and environmental correlates of aboveground biomass in Amazonian forests. Global Change Biology, 17, 2677-2688.
Alexiades, M., Alvarez Davila, E., Alvarez-Loayza, P., Andrade, A., Aragao, L.E.O.C., Araujo-Murakami, A., Arets, E.J.M.M., Arroyo, L., Aymard C, G.A., Banki, O.S., Baraloto, C., Barroso, J., Bonal, D., Boot, R.G.A., Camargo, J.L.C., Castilho, C.V., Chama, V., Chao, K.J., Chave, J., Comiskey, J.A., Cornejo Valverde, F., da Costa, L., de Oliveira, E.A., Di Fiore, A., Erwin, T.L., Fauset, S., Forsthofer, M., Galbraith, D.R., Grahame, E.S., Groot, N., Herault, B., Higuchi, N., Honorio Coronado, E.N., Keeling, H., Killeen, T.J., Laurance, W.F., Laurance, S., Licona, J., Magnussen, W.E., Marimon, B.S., Marimon-Junior, B.H., Mendoza, C., Neill, D.A., Nogueira, E.M., Nunez, P., Pallqui Camacho, N.C., Parada, A., Pardo-Molina, G., Peacock, J., Pena-Claros, M., Pickavance, G.C., Pitman, N.C.A., Poorter, L., Prieto, A., Quesada, C.A., Ramirez, F., Ramirez-Angulo, H., Restrepo, Z., Roopsind, A., Rudas, A., Salomao, R.P., Schwarz, M., Silva, N., Silva-Espejo, J.E., Silveira, M., Stropp, J., Talbot, J., ter Steege, H., Teran-Aguilar, J., Terborgh, J., Thomas-Caesar, R., Toledo, M., Torello-Raventos, M., Umetsu, R.K., van der Heijden, G.M.F., van der Hout, P., Guimaraes Vieira, I.C., Vieira, S.A., Vilanova, E., Vos, V.A. & Zagt, R.J. (2015) Long-term decline of the Amazon carbon sink. Nature, 519, 344-348.
Carreño-Rocabado, G., Peña-Claros, M., Bongers, F., Alarcón, A., Licona, J.-C. & Poorter, L. (2012) Effects of disturbance intensity on species and functional diversity in a tropical forest. Journal of Ecology, 100, 1453-1463.
Cavard, X., Bergeron, Y., Chen, H.Y.H. & Paré, D. (2010) Mixed-species effect on tree aboveground carbon pools in the east-central boreal forests. Canadian Journal of Forest Research, 40, 37-47.
Chave, J., Coomes, D., Jansen, S., Lewis, S.L., Swenson, N.G. & Zanne, A.E. (2009) Towards a worldwide wood economics spectrum. Ecol Lett, 12, 351-366.
Chave, J., Réjou-Méchain, M., Búrquez, A., Chidumayo, E., Colgan, M.S., Delitti, W.B.C., Duque, A., Eid, T., Fearnside, P.M., Goodman, R.C., Henry, M., Martínez-Yrízar, A., Mugasha, W.A., Muller-Landau, H.C., Mencuccini, M., Nelson, B.W., Ngomanda, A., Nogueira, E.M., Ortiz-Malavassi, E., Pélissier, R., Ploton, P., Ryan, C.M., Saldarriaga, J.G. & Vieilledent, G. (2014) Improved allometric models to estimate the aboveground biomass of tropical trees. Global Change Biology, 20, 3177-3190.
Díaz, S., Quétier, F., Cáceres, D.M., Trainor, S.F., Pérez-Harguindeguy, N., Bret-Harte, M.S., Finegan, B., Peña-Claros, M. & Poorter, L. (2011) Linking functional diversity and social actor strategies in a framework for interdisciplinary analysis of nature's benefits to society. Proceedings of the National Academy of Sciences, 108, 895-902.
Finegan, B., Peña-Claros, M., de Oliveira, A., Ascarrunz, N., Bret-Harte, M.S., Carreño-Rocabado, G., Casanoves, F., Díaz, S., Eguiguren Velepucha, P., Fernandez, F., Licona, J.C., Lorenzo, L., Salgado Negret, B., Vaz, M. & Poorter, L. (2015) Does functional trait diversity predict above-ground biomass and productivity of tropical forests? Testing three alternative hypotheses. Journal of Ecology, 103, 191-201.
Garnier, E., Cortez, J., Billes, G., Navas, M.L., Roumet, C., Debussche, M., Laurent, G., Blanchard, A., Aubry, D., Bellmann, A., Neill, C. & Toussaint, J.P. (2004) Plant functional markers capture ecosystem properties during secondary succession. Ecology, 85, 2630-2637. Grime, J.P. (1998) Benefits of plant diversity to ecosystems: immediate, filter and founder effects. Journal of Ecology, 86, 902-910.
Houghton, R.A., Hall, F. & Goetz, S.J. (2009) Importance of biomass in the global carbon cycle. Journal of Geophysical Research: Biogeosciences, 114, n/a-n/a.
Hughes, R.F., Kauffman, J.B. & Jaramillo, V.J. (1999) Biomass, Carbon, and Nutrient Dynamics of Secondary Forests in a Humid Tropical Region of MÉxico. Ecology, 80, 1892-1907.
Jefferies, R.L. & Willis, A.J. (1964) Studies on the Calcicole-Calcifuge Habit: II. The Influence of Calcium on the Growth and Establishment of Four Species in Soil and Sand Cultures. Journal of Ecology, 52, 691-707.
Kato, S. & Komiyama, A. (2002) Spatial and seasonal heterogeneity in understory light conditions caused by differential leaf flushing of deciduous overstory trees. Ecological Research, 17, 687-693.
Klein, T. (2014) The variability of stomatal sensitivity to leaf water potential across tree species indicates a continuum between isohydric and anisohydric behaviours. Functional Ecology, 28, 1313-1320.
Komiyama, A., Kato, S. & Teranishi, M. (2001) Differential overstory leaf flushing contributes to the formation of a patchy understory. Journal of Forest Research, 6, 163-171. Lasky, J.R., Uriarte, M., Boukili, V.K. & Chazdon, R.L. (2014) Trait-mediated assembly processes predict successional changes in community diversity of tropical forests. Proceedings of the National Academy of Sciences, 111, 5616-5621.
Lebrija-Trejos, E., Bongers, F., Pérez-García, E.A. & Meave, J.A. (2008) Successional Change and Resilience of a Very Dry Tropical Deciduous Forest Following Shifting Agriculture. Biotropica, 40, 422-431.
Lohbeck, M., Poorter, L., Lebrija-Trejos, E., Martínez-Ramos, M., Meave, J.A., Paz, H., Pérez-García, E.A., Romero-Pérez, I.E., Tauro, A. & Bongers, F. (2013) Successional changes in functional composition contrast for dry and wet tropical forest. Ecology, 94, 1211-1216. Lohbeck, M., Poorter, L., Martínez-Ramos, M. & Bongers, F. (2015) Biomass is the main driver of changes in ecosystem process rates during tropical forest succession. Ecology, 96, 1242-1252.
Lopes, S.F., Schiavini, I., Oliveira, A.P. & Vale, V.S. (2012) An Ecological Comparison of Floristic Composition in Seasonal Semideciduous Forest in Southeast Brazil: Implications for Conservation. International Journal of Forestry Research, 2012, 1-14.
Lopes, S.F., Vale, V.S., Schiavini, I., Prado-Junior, J.A., Oliveira, A.P. & Arantes, C.S. (2014) Canopy stratification in tropical seasonal forests: how the functional traits of community change among the layers. Bioscience Journal, 30, 1551-1562.
Malhi, Y. (2012) The productivity, metabolism and carbon cycle of tropical forest vegetation. Journal of Ecology, 100, 65-75.
Terborgh, J., Vinceti, B. & Lloyd, J. (2004) The above-ground coarse wood productivity of 104 Neotropical forest plots. Global Change Biology, 10, 563-591.
Malhi, Y., Wood, D., Baker, T.R., Wright, J., Phillips, O.L., Cochrane, T., Meir, P., Chave, J., Almeida, S., Arroyo, L., Higuchi, N., Killeen, T.J., Laurance, S.G., Laurance, W.F., Lewis, S.L., Monteagudo, A., Neill, D.A., Vargas, P.N., Pitman, N.C.A., Quesada, C.A., SalomÃO, R., Silva, J.N.M., Lezama, A.T., Terborgh, J., MartÍNez, R.V. & Vinceti, B. (2006) The regional variation of aboveground live biomass in old-growth Amazonian forests. Global Change Biology, 12, 1107-1138.
Markesteijn, L., Poorter, L., Paz, H., Sack, L. & Bongers, F. (2011) Ecological differentiation in xylem cavitation resistance is associated with stem and leaf structural traits. Plant Cell Environ, 34, 137-148.
Martinelli, L.A., Piccolo, M.C., Townsend, A.R., Vitousek, P.M., Cuevas, E., McDowell, W., Robertson, G.P., Santos, O.C. & Treseder, K. (1999) Nitrogen stable isotopic composition of leaves and soil: Tropical versus temperate forests. New Perspectives on Nitrogen Cycling in the Temperate and Tropical Americas (ed. A. Townsend), pp. 45-65. Springer Netherlands. Mason, N.W.H., Mouillot, D., Lee, W.G. & Wilson, J.B. (2005) Functional richness, functional evenness and functional divergence: the primary components of functional diversity. Oikos, 111, 112-118.
Nakagawa, S. & Schielzeth, H. (2013) A general and simple method for obtaining R2 from generalized linear mixed-effects models. Methods in Ecology and Evolution, 4, 133-142. Paine, C.E.T., Amissah, L., Auge, H., Baraloto, C., Baruffol, M., Bourland, N., Bruelheide, H., Daïnou, K., de Gouvenain, R.C., Doucet, J.-L., Doust, S., Fine, P.V.A., Fortunel, C., Haase, J., Holl, K.D., Jactel, H., Li, X., Kitajima, K., Koricheva, J., Martínez-Garza, C., Messier, C., Paquette, A., Philipson, C., Piotto, D., Poorter, L., Posada, J.M., Potvin, C., Rainio, K., Russo, S.E., Ruiz-Jaen, M., Scherer-Lorenzen, M., Webb, C.O., Wright, S.J., Zahawi, R.A. & Hector, A. (2015) Globally, functional traits are weak predictors of juvenile tree growth, and we do not know why. Journal of Ecology, 103, 978-989.
Pastor, J., Aber, J.D., McClaugherty, C.A. & Melillo, J.M. (1984) Aboveground Production and N and P Cycling Along a Nitrogen Mineralization Gradient on Blackhawk Island, Wisconsin. Ecology, 65, 256-268.
Peña-Claros, M., Fredericksen, T.S., Alarcón, A., Blate, G.M., Choque, U., Leaño, C., Licona, J.C., Mostacedo, B., Pariona, W., Villegas, Z. & Putz, F.E. (2008) Beyond reduced-impact logging: Silvicultural treatments to increase growth rates of tropical trees. Forest Ecology and Management, 256, 1458-1467.
Pérez-Harguindeguy, N., Díaz, S., Garnier, E., Lavorel, S., Poorter, H., Jaureguiberry, P., Bret-Harte, M.S., Cornwell, W.K., Craine, J.M., Gurvich, D.E., Urcelay, C., Veneklaas, E.J., Reich, P.B., Poorter, L., Wright, I.J., Ray, P., Enrico, L., Pausas, J.G., de Vos, A.C., Buchmann, N., Funes, G., Quétier, F., Hodgson, J.G., Thompson, K., Morgan, H.D., ter Steege, H., van der Heijden, M.G.A., Sack, L., Blonder, B., Poschlod, P., Vaieretti, M.V., Conti, G., Staver, A.C., Aquino, S. & Cornelissen, J.H.C. (2013) New handbook for standardised measurement of plant functional traits worldwide. Australian Journal of Botany, 61, 167-234.
Pianka, E.R. (1970) On r- and K-Selection. The American Naturalist, 104, 592-597.
Pineda-García, F., Paz, H. & Meinzer, F.C. (2013) Drought resistance in early and late secondary successional species from a tropical dry forest: the interplay between xylem resistance to embolism, sapwood water storage and leaf shedding. Plant Cell Environ, 36, 405-418.
Poorter, L. & Bongers, F. (2006) Leaf traits are good predictors of plant performance across 53 rain forest species. Ecology, 87, 1733-1743.
Poorter, L. & Markesteijn, L. (2008) Seedling Traits Determine Drought Tolerance of Tropical Tree Species. Biotropica, 40, 321-331.
Poorter, L., Wright, S.J., Paz, H., Ackerly, D.D., Condit, R., Ibarra-Manríquez, G., Harms, K.E., Licona, J.C., Martínez-Ramos, M., Mazer, S.J., Muller-Landau, H.C., Peña-Claros, M., Webb, C.O. & Wright, I.J. (2008) Are functional traits good predictors of demographic rates? Evidence from five neotropical forests. Ecology, 89, 1908-1920.
Chao, K.J., Dezzeo, N., Erwin, T., di Fiore, A., Higuchi, N., Honorio Coronado, E., Jimenez, E.M., Killeen, T., Lezama, A.T., Lloyd, G., López-González, G., Luizão, F.J., Malhi, Y., Monteagudo, A., Neill, D.A., Núñez Vargas, P., Paiva, R., Peacock, J., Peñuela, M.C., Peña Cruz, A., Pitman, N., Priante Filho, N., Prieto, A., Ramírez, H., Rudas, A., Salomão, R., Santos, A.J.B., Schmerler, J., Silva, N., Silveira, M., Vásquez, R., Vieira, I., Terborgh, J. & Lloyd, J. (2012) Basin-wide variations in Amazon forest structure and function are mediated by both soils and climate.
Reich, P.B., Wright, I.J., Cavender‐Bares, J., Craine, J.M., Oleksyn, J., Westoby, M. & Walters, M.B. (2003) The Evolution of Plant Functional Variation: Traits, Spectra, and Strategies. International Journal of Plant Sciences, 164, S143-S164.
Rozendaal, D.M.A. & Chazdon, R.L. (2015) Demographic drivers of tree biomass change during secondary succession in northeastern Costa Rica. Ecological Applications, 25, 506-516.
Rozendaal, D.M.A., Hurtado, V.H. & Poorter, L. (2006) Plasticity in leaf traits of 38 tropical tree species in response to light; relationships with light demand and adult stature. Functional Ecology, 20, 207-216.
Santiago, L.S., Goldstein, G., Meinzer, F.C., Fisher, J.B., Machado, K., Woodruff, D. & Jones, T. (2004) Leaf photosynthetic traits scale with hydraulic conductivity and wood density in Panamanian forest canopy trees. Oecologia, 140, 543-550.
Schnitzer, S.A., Klironomos, J.N., HilleRisLambers, J., Kinkel, L.L., Reich, P.B., Xiao, K., Rillig, M.C., Sikes, B.A., Callaway, R.M., Mangan, S.A., van Nes, E.H. & Scheffer, M. (2011) Soil microbes drive the classic plant diversity–productivity pattern. Ecology, 92, 296-303.
Slik, J.W.F., Aiba, S.-I., Brearley, F.Q., Cannon, C.H., Forshed, O., Kitayama, K., Nagamasu, H., Nilus, R., Payne, J., Paoli, G., Poulsen, A.D., Raes, N., Sheil, D., Sidiyasa, K., Suzuki, E. & van Valkenburg, J.L.C.H. (2010) Environmental correlates of tree biomass, basal area, wood specific gravity and stem density gradients in Borneo's tropical forests. Global Ecology and Biogeography, 19, 50-60.
Chuyong, G., Davies, S.J., Duque, A., Ewango, C.N., Flores, O., Franklin, J.F., Grau, H.R., Hao, Z., Harmon, M.E., Hubbell, S.P., Kenfack, D., Lin, Y., Makana, J.R., Malizia, A., Malizia, L.R., Pabst, R.J., Pongpattananurak, N., Su, S.H., Sun, I.F., Tan, S., Thomas, D., van Mantgem, P.J., Wang, X., Wiser, S.K. & Zavala, M.A. (2014) Rate of tree carbon accumulation increases continuously with tree size. Nature, 507, 90-93.
Sterck, F., Markesteijn, L., Schieving, F. & Poorter, L. (2011) Functional traits determine trade-offs and niches in a tropical forest community. Proceedings of the National Academy of Sciences, 108, 20627-20632.
Talbot, J., Lewis, S.L., Lopez-Gonzalez, G., Brienen, R.J.W., Monteagudo, A., Baker, T.R., Feldpausch, T.R., Malhi, Y., Vanderwel, M., Araujo Murakami, A., Arroyo, L.P., Chao, K.-J., Erwin, T., van der Heijden, G., Keeling, H., Killeen, T., Neill, D., Núñez Vargas, P., Parada Gutierrez, G.A., Pitman, N., Quesada, C.A., Silveira, M., Stropp, J. & Phillips, O.L. (2014) Methods to estimate aboveground wood productivity from long-term forest inventory plots. Forest Ecology and Management, 320, 30-38.
Tilman, D. (1999) The ecological consequences of changes in biodiversity: A search for general principles. Ecology, 80, 1455-1474.
Toledo, M., Poorter, L., Peña-Claros, M., Alarcón, A., Balcázar, J., Leaño, C., Licona, J.C., Llanque, O., Vroomans, V., Zuidema, P. & Bongers, F. (2011) Climate is a stronger driver of tree and forest growth rates than soil and disturbance. Journal of Ecology, 99, 254-264.
Tyler, G. (1996) Mineral Nutrient Limitations of Calcifuge Plants in Phosphate Sufficient Limestone Soil. Ann Bot, 77, 649-656.
Uemura, S. (1994) Patterns of leaf phenology in forest understory. Canadian Journal of Botany, 72, 409-414.
Unger, M., Homeier, J. & Leuschner, C. (2012) Effects of soil chemistry on tropical forest biomass and productivity at different elevations in the equatorial Andes. Oecologia, 170, 263-274.
Vieira, S., de Camargo, P., Selhorst, D., da Silva, R., Hutyra, L., Chambers, J., Brown, I.F., Higuchi, N., dos Santos, J., Wofsy, S., Trumbore, S. & Martinelli, L. (2004) Forest structure and carbon dynamics in Amazonian tropical rain forests. Oecologia, 140, 468-479.
Vilà, M., Carrillo-Gavilán, A., Vayreda, J., Bugmann, H., Fridman, J., Grodzki, W., Haase, J., Kunstler, G., Schelhaas, M. & Trasobares, A. (2013) Disentangling Biodiversity and Climatic Determinants of Wood Production. PLoS One, 8, e53530.
Vilà, M., Vayreda, J., Gracia, C. & Ibáñez, J. (2003) Does tree diversity increase wood production in pine forests? Oecologia, 135, 299-303.
Villéger, S., Mason, N.W.H. & Mouillot, D. (2008) New multidimensional functional diversity indices for a multifaceted framework in functional ecology. Ecology, 89, 2290-2301. Walker, B.H. (1992) Biodiversity and Ecological Redundancy. Conservation Biology, 6, 18-23.
Wright, S.J., Kitajima, K., Kraft, N.J.B., Reich, P.B., Wright, I.J., Bunker, D.E., Condit, R., Dalling, J.W., Davies, S.J., Díaz, S., Engelbrecht, B.M.J., Harms, K.E., Hubbell, S.P., Marks, C.O., Ruiz-Jaen, M.C., Salvador, C.M. & Zanne, A.E. (2010) Functional traits and the growth–mortality trade-off in tropical trees. Ecology, 91, 3664-3674.
Wright, S.J., Yavitt, J.B., Wurzburger, N., Turner, B.L., Tanner, E.V.J., Sayer, E.J., Santiago, L.S., Kaspari, M., Hedin, L.O., Harms, K.E., Garcia, M.N. & Corre, M.D. (2011) Potassium, phosphorus, or nitrogen limit root allocation, tree growth, or litter production in a lowland tropical forest. Ecology, 92, 1616-1625.
Wullaert, H., Bigalke, M., Homeier, J., Cumbicus, N., Valarezo, C. & Wilcke, W. (2013) Short-term response of the Ca cycle of a montane forest in Ecuador to low experimental CaCl2 additions. Journal of Plant Nutrition and Soil Science, 176, 892-903.
Zanne, A.E., Lopez-Gonzalez, G., Coomes, D.A., Ilic, J., Jansen, S., Lewis, S.L., Miller, R.B., Swenson, N.G., Wiemann, M.C. & Chave, J. (2009) Data from: Towards a worldwide wood economics spectrum. Dryad Data Repository.

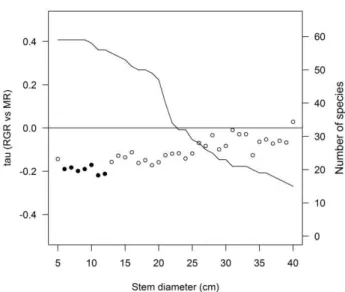
![Fig. 3. Size-dependent changes in partial correlation coefficients (Kendall‟s tau) between demographic rates (RGR and MR) and tree architectural variables (height [H], first branch height [FBH] and crown wide [CW]), leaf traits (le](https://thumb-eu.123doks.com/thumbv2/123dok_br/15965194.685614/70.892.105.529.110.1102/dependent-changes-correlation-coefficients-kendall-demographic-architectural-variables.webp)