BGD
12, 14739–14772, 2015
Modelling above-ground carbon
dynamics using multi-temporal
airborne lidar
W. Simonson et al.
Title Page
Abstract Introduction
Conclusions References
Tables Figures
◭ ◮
◭ ◮
Back Close
Full Screen / Esc
Printer-friendly Version
Interactive Discussion
Discussion
P
a
per
|
Discussion
P
a
per
|
Discussion
P
a
per
|
Discussion
P
a
per
|
Biogeosciences Discuss., 12, 14739–14772, 2015 www.biogeosciences-discuss.net/12/14739/2015/ doi:10.5194/bgd-12-14739-2015
© Author(s) 2015. CC Attribution 3.0 License.
This discussion paper is/has been under review for the journal Biogeosciences (BG). Please refer to the corresponding final paper in BG if available.
Modelling above-ground carbon dynamics
using multi-temporal airborne lidar:
insights from a Mediterranean woodland
W. Simonson1, P. Ruiz-Benito2,3, F. Valladares4,5, and D. Coomes1
1
Forest Ecology and Conservation Group, Department of Plant Sciences, University of Cambridge, Cambridge, CB2 3EA, UK
2
Biological and Environmental Sciences, School of Natural Sciences, University of Stirling, Stirling, FK9 4LA, UK
3
Forest Ecology and Restoration Group, Department of Life Sciences, University of Alcala, Science Building, Campus Universitario, 28871 Alcalá de Henares, Madrid, Spain
4
Museo Nacional de Ciencias Naturales, CSIC, Serrano 115 dpdo, E28006 Madrid, Spain
5
Departamento de Ciencias, Universidad Rey Juan Carlos, Mostoles, Madrid, Spain
Received: 21 July 2015 – Accepted: 1 August 2015 – Published: 7 September 2015
Correspondence to: W. Simonson ([email protected])
Published by Copernicus Publications on behalf of the European Geosciences Union.
BGD
12, 14739–14772, 2015
Modelling above-ground carbon
dynamics using multi-temporal
airborne lidar
W. Simonson et al.
Title Page
Abstract Introduction
Conclusions References
Tables Figures
◭ ◮
◭ ◮
Back Close
Full Screen / Esc
Printer-friendly Version
Interactive Discussion
Discussion
P
a
per
|
Discussion
P
a
per
|
Discussion
P
a
per
|
Discussion
P
a
per
|
Abstract
Woodlands represent highly significant carbon sinks globally, though could lose this function under future climatic change. Effective large-scale monitoring of these
wood-lands has a critical role to play in mitigating for, and adapting to, climate change. Mediterranean woodlands have low carbon densities, but represent important global 5
carbon stocks due to their extensiveness and are particularly vulnerable because the region is predicted to become much hotter and drier over the coming century. Airborne lidar is already recognized as an excellent approach for high-fidelity car-bon mapping, but few studies have used multi-temporal lidar surveys to measure carbon fluxes in forests and none have worked with Mediterranean woodlands. We 10
use a multi-temporal (five year interval) airborne lidar dataset for a region of central Spain to estimate above-ground biomass (AGB) and carbon dynamics in typical mixed broadleaved/coniferous Mediterranean woodlands. Field calibration of the lidar data en-abled the generation of grid-based maps of AGB for 2006 and 2011, and the resulting AGB change were estimated. There was a close agreement between the lidar-based 15
AGB growth estimate (1.22 Mg ha−1year−1) and those derived from two independent sources: the Spanish National Forest Inventory, and a tree-ring based analysis (1.19 and 1.13 Mg ha−1year−1, respectively). We parameterised a simple simulator of for-est dynamics using the lidar carbon flux measurements, and used it to explore four scenarios of fire occurrence. Under undisturbed conditions (no fire occurrence) an ac-20
celerating accumulation of biomass and carbon is evident over the next 100 years with an average carbon sequestration rate of 1.95 Mg C ha−1year−1. This rate reduces by almost a third when fire probability is increased to 0.01, as has been predicted under climate change. Our work shows the power of multi-temporal lidar surveying to map woodland carbon fluxes and provide parameters for carbon dynamics models. Space 25
BGD
12, 14739–14772, 2015
Modelling above-ground carbon
dynamics using multi-temporal
airborne lidar
W. Simonson et al.
Title Page
Abstract Introduction
Conclusions References
Tables Figures
◭ ◮
◭ ◮
Back Close
Full Screen / Esc
Printer-friendly Version
Interactive Discussion
Discussion
P
a
per
|
Discussion
P
a
per
|
Discussion
P
a
per
|
Discussion
P
a
per
|
1 Introduction
The world’s forests are currently acting as an important carbon sink, in 2000–2007 taking up 2.3±0.5 Pg C each year compared with anthropogenic emissions of 8.7±
0.8 Pg C (Pan et al., 2011). For this reason, the international community recognises that forest protection could play a significant role in climate change abatement and 5
that the feedback between climate and the terrestrial carbon cycle will be a key de-terminant of the dynamics of the Earth System (Purves et al., 2007). However, there is major uncertainty over forest responses to anthropogenic global change, and con-cerns that the world’s forests may switch from being a sink to a source within the next few decades (Nabuurs et al., 2013; Ruiz-Benito et al., 2014b), through gradual 10
effects on regeneration, growth and mortality, as well as climate-change related
distur-bance (Frank et al., 2015). For instance, severe droughts in many parts of the world are causing rapid change, killing trees directly through heat-stress and indirectly by fire (Allen et al., 2010). Disturbance events can cause major perturbations to regional carbon fluxes (Chambers et al., 2013; Vanderwel et al., 2013). A major goal in biogeo-15
sciences, therefore, is to improve understanding of the terrestrial vegetation carbon cycle to enable better constrained projections (Smith et al., 2012).
In this context, remote sensing methods for modelling above ground storage of car-bon in biomass have received much recent attention, with airborne light detection and ranging (lidar) showing the most potential for accurate and large-scale applications. 20
Lidar metrics of canopy structure are highly correlated with field-based estimates of above ground biomass (AGB) and carbon (AGC) (Drake et al., 2003; Lefsky et al., 2002). With such relationships being repeatedly demonstrated, it has been possible to develop a conceptual and technical approach linking plot-based carbon density es-timates with lidar top-canopy heights using regional inputs on basal area and wood 25
density (Asner and Mascaro, 2014). With the increasing availability of multi-temporal (repeat survey) lidar datasets, including some of national coverage, a few researchers have started to lidar in large-scale studies of vegetation productivity and carbon
BGD
12, 14739–14772, 2015
Modelling above-ground carbon
dynamics using multi-temporal
airborne lidar
W. Simonson et al.
Title Page
Abstract Introduction
Conclusions References
Tables Figures
◭ ◮
◭ ◮
Back Close
Full Screen / Esc
Printer-friendly Version
Interactive Discussion
Discussion
P
a
per
|
Discussion
P
a
per
|
Discussion
P
a
per
|
Discussion
P
a
per
|
namics (Englhart et al., 2013; Hudak et al., 2012) as well as forest disturbance and gap dynamics (Blackburn et al., 2014; Kellner and Asner, 2014; Vepakomma et al., 2008, 2010, 2011). As such, lidar is transitioning from research to practical application, notably in supporting baseline surveys and monitoring of carbon stocks required for the implementation of the REDD+mechanism (Reducing Emissions from
Deforesta-5
tion and Forest Degradation) (Asner et al., 2013). However, monitoring carbon fluxes using multi-temporal lidar is technically challenging because instrument and flight spec-ifications vary over time (Réjou-Méchain et al., 2014).
The applications of airborne lidar for modelling AGB and AGC have largely been tested in cool temperate and tropical forest systems (see Zolkos et al., 2013). Less 10
attention has been given to the effectiveness of the technology for the modelling of
biomass and carbon in sub-tropical and Mediterranean climate zones dominated by dry woodlands. These woodlands have lower carbon densities, but represent impor-tant global carbon stocks due to their extensiveness and also vulnerability in the face of climate change (Ruiz-Benito et al., 2014b). As elsewhere in Europe, carbon stocks in 15
such woodlands have been increasing in recent decades (Nabuurs et al., 2003, 2010; Vayreda et al., 2012), as woodland management for charcoal and timber has declined in profitability. However, with Earth System models predicting some of the most se-vere warming and drying trends of anywhere in the world (Giorgi and Lionello, 2008; Valladares et al., 2014), abrupt shifts in increasing fire frequency and intensity may 20
reverse such trends across the Mediterranean region (Pausas et al., 2008). Lidar has been used to measure carbon stocks in some Mediterranean woodlands (García et al., 2010) but, to our knowledge, not for measuring carbon dynamics.
In this study we demonstrate the potential to build a patchwork dynamics simulator for the biomass and carbon dynamics in Mediterranean woodlands based on multi-25
BGD
12, 14739–14772, 2015
Modelling above-ground carbon
dynamics using multi-temporal
airborne lidar
W. Simonson et al.
Title Page
Abstract Introduction
Conclusions References
Tables Figures
◭ ◮
◭ ◮
Back Close
Full Screen / Esc
Printer-friendly Version
Interactive Discussion
Discussion
P
a
per
|
Discussion
P
a
per
|
Discussion
P
a
per
|
Discussion
P
a
per
|
two independent datasets: the Spanish National Forest Inventory (SFI) and tree-ring measurements, before parameterising a simulation model to explore the dynamics of carbon change over a 100 year period. In doing so, we explore sensitivity of the long-term carbon sequestration potential of the regional landscape to increasing forest fire frequency, as is to be expected under future climate change.
5
2 Methods
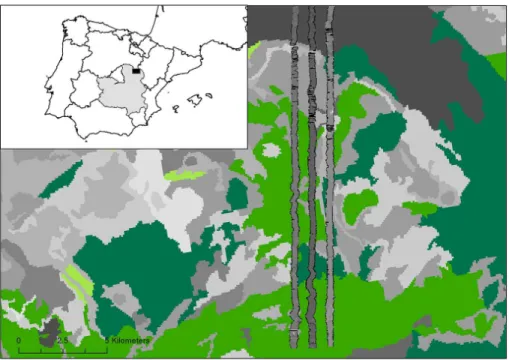
2.1 Study area
Alto Tajo (40◦47′N, 2◦14′W) is a Natural Park (32 375 ha) situated in the Guadalajara province of Central Spain. The dominant woody vegetation is Mediterranean mixed woodland, comprising Pinus sylvestris, P. nigra, Quercus faginea, Q. ilex, Juniperus
10
oxycedrusandJ. thurifera. The region has a complex topography ranging from 960 to 1400 m a.s.l. The mean annual temperature here is 10.2◦C, with mean annual rainfall of 499 mm.
Contained within the Park is one of the six Exploratory platform sites contributing to FunDivEurope: Functional Significance of Biodiversity in European Forests (Baeten 15
et al., 2013). Field data used in the current study were taken from plots surveyed as part of this programme. The landscape-level analysis focused on a belt overlapping this areas and running 20 km north–south and 3 km east–west (Fig. 2).
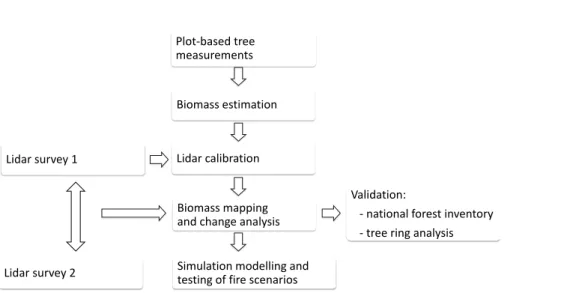
2.2 Plot-based tree measurements and allometric biomass modelling
Field measurement of plots was undertaken in March 2012. Each plot was of dimen-20
sion 30 m×30 m and was carefully geo-located, recording GPS corner coordinates and orientation using a Trimble GeoXT – Geoexplorer 2008. For each tree and shrub (diameter at breast height, DBH>7.5 cm), the following were measured and recorded: position within plot, species, height, height of lowest branch, DBH (at 1.3 m), and crown
BGD
12, 14739–14772, 2015
Modelling above-ground carbon
dynamics using multi-temporal
airborne lidar
W. Simonson et al.
Title Page
Abstract Introduction
Conclusions References
Tables Figures
◭ ◮
◭ ◮
Back Close
Full Screen / Esc
Printer-friendly Version
Interactive Discussion
Discussion
P
a
per
|
Discussion
P
a
per
|
Discussion
P
a
per
|
Discussion
P
a
per
|
diameter (two orthogonal measurements). A vertex hypsometer was used for the crown dimensions.
The above ground biomass of individual trees was estimated according to published allometries, and summed to arrive at plot and hectare totals. The allometric equa-tions of Ruiz-Peinado et al. (2011, 2012) were used for softwood species (Juniperus
5
andPinus) and hardwood species (Quercus), respectively (Appendix). The equations were developed from tree samples across Spain including sites close to the Alto Tajo study area. The equations for Juniperus thurifera were applied to the other two ju-nipers (J. oxycedrus and J. phoenicia) as well as box (Buxus sempervirens). In all cases, the equations compartmented the biomass into trunks and large, medium and 10
fine branches/leaves, using DBH and tree height data.
2.3 Lidar surveys, calibration and above-ground biomass and carbon change
analysis
The lidar surveys were undertaken by the NERC Airborne Research and Survey Facility (ARSF) and took place on 16 May 2006 (project WM06_04; García et al., 2011, 2010) 15
and 21 May 2011 (project CAM11_03). A Dornier 228 aircraft was employed for both, but lidar instruments differed between years: Optech ALTM-3033 in 2006 and Leica
ALS050 in 2011. Instrument and flight parameters are given in Table 1. Simultaneous GPS measurement was carried out on the ground allowing for differential correction
during post-processing. 20
We assumed accurate georeferencing of the 2006 and 2011 datasets during post-processing, and did no further co-registration. We performed initial modelling of terrain and canopy heights from the 2006 and 2011 lidar datasets using “Tiffs” 8.0: Toolbox
for Lidar Data Filtering and Forest Studies, which employs a computationally efficient,
grid-based morphological filtering method described by Chen et al. (2007). Outputs 25
BGD
12, 14739–14772, 2015
Modelling above-ground carbon
dynamics using multi-temporal
airborne lidar
W. Simonson et al.
Title Page
Abstract Introduction
Conclusions References
Tables Figures
◭ ◮
◭ ◮
Back Close
Full Screen / Esc
Printer-friendly Version
Interactive Discussion
Discussion
P
a
per
|
Discussion
P
a
per
|
Discussion
P
a
per
|
Discussion
P
a
per
|
below were undertaken in ArcInfo 10.0 (ESRI 2013) and R 2.13.1 (R Development Core Team, 2011), respectively.
Spatially overlaying the lidar dataset with land cover information derived from the 2006 CORINE map (EEA, 1995), indicated the local presence of two main forest types: coniferous and mixed (oak-juniper-pine) woodland. For the purposes of calibrating the 5
lidar height models based on field-estimated biomass, only the latter forest type was ad-equately sampled (13 plots), so subsequent analysis and modelling focused on these mixed woodland systems. We predicted biomass as a function of top of canopy heights, which has been found to be a good predictor (Asner et al., 2013). Digitised plot bound-aries for the 13 FunDiv plots of square 30 m×30 m were used to extract mean top-10
of-canopy height values from the lidar CHM (TCHL). Reassuringly, these values were remarkably similar to the mean canopy height estimated from plot data (TCHP), cal-culated from height and crown area of each tree obtained by allometric formulae (see Kent et al., 2015); there was almost a 1 : 1 relationship between the two estimates of height: TCHG=1.79+0.999×TCH
L (R2=0.88). Field-estimated AGB was modelled 15
on the basis of lidar mean height by linear regression of log transformed variables. Our selected model (log(AGB)=3.02+0.89·log(TCH
L),R 2=
0.53, RMSE=0.28) was
transformed and multiplied by a correction factor (CF) to account for the back-transformation of the regression error (Baskerville, 1972); the correction factor is given by CF=eMSE/2, where MSE is the mean square error of the regression model.
20
We used the regression model and lidar dataset to map biomass and biomass change. We aggregated canopy heights at 1 m resolution to mean values per 30 m×
30 m grid cell, to reduce mismatches with the field inventory plots (Réjou-Méchain et al., 2014). The aggregation was also effective in dealing with gappiness noted in the 2006
dataset due to uneven distribution of scan lines and lower point density (Table 1). Neg-25
ative values caused by occasional inaccuracies evident in the DTM models, especially for 2006, were removed from the dataset to avoid anomalies. For each grid cell along the three north–south transects, we were able use the mean height–AGB regression
BGD
12, 14739–14772, 2015
Modelling above-ground carbon
dynamics using multi-temporal
airborne lidar
W. Simonson et al.
Title Page
Abstract Introduction
Conclusions References
Tables Figures
◭ ◮
◭ ◮
Back Close
Full Screen / Esc
Printer-friendly Version
Interactive Discussion
Discussion
P
a
per
|
Discussion
P
a
per
|
Discussion
P
a
per
|
Discussion
P
a
per
|
relationship to generate estimates of AGB in 2006 and 2011, and AGB change 2006– 2011.
2.4 Validation
We validated the lidar-modelled AGB estimates using two different datasets. Firstly,
equivalent estimates of AGB and AGB change were developed using detailed tree 5
measurements from the Spanish National Forest Inventory (SFI). The SFI covers the forested areas of the country on a 1 km2 grid (Villanueva, 2004). A subset of 234 SFI plots surrounding the study area and of comparable topography and climate were se-lected, and the data extracted for the second and third surveys (2SFI, 1992–94 and 3SFI, 2003–2006; i.e. an 11 year interval for this region). For each, plot-level AGB was 10
calculated by applying the allometric equations of Ruiz-Peinado et al. (2011, 2012; Ap-pendix) to individual tree height and stem diameter measurements and summing these up to the plot level. Information on topoclimate (altitude, rainfall, temperature; Gonzalo, 2008) and management/fire disturbance were also available per plot, although areas significantly burned after the first inventory were removed from the dataset.
15
Secondly, plot-level above-ground wood productivity values were calculated from tree-ring measurements from the same FunDiv plots used to calibrate the lidar data, according to a four-step procedure described in Jucker et al. (2014): measuring growth increments from wood cores, converting diameter increments into biomass growth, modelling individual tree biomass growth, and scaling up to plot level. In this approach, 20
plot level estimates were based on the growth of trees present in 2011 and did not account for the growth of trees that died between 1992 and 2011.
2.5 Biomass growth estimation and simulation modelling
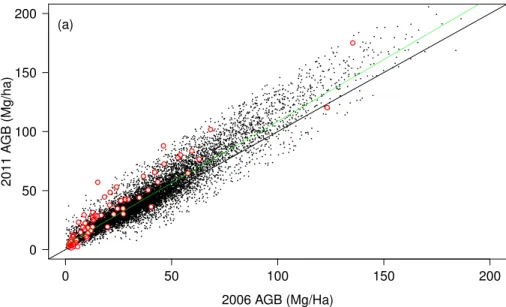
Plotting the 30 m×30 m pixel-level AGB estimates from 2006 vs. 2011 revealed a small number of outliers of AGB change that may have resulted from anomalies in the DTM 25
BGD
12, 14739–14772, 2015
Modelling above-ground carbon
dynamics using multi-temporal
airborne lidar
W. Simonson et al.
Title Page
Abstract Introduction
Conclusions References
Tables Figures
◭ ◮
◭ ◮
Back Close
Full Screen / Esc
Printer-friendly Version
Interactive Discussion
Discussion
P
a
per
|
Discussion
P
a
per
|
Discussion
P
a
per
|
Discussion
P
a
per
|
these outliers in order to obtain reliable estimates of mean growth and its uncertainty. This was performed with the rlm command in the MASS package of R, which uses iterative re-weighted least squares (M-estimation) (Venables and Ripley, 2002). Robust regression assigns lower weights to outliers than to points close to the regression line (in our case, using a bisquare weighting function), and then uses these weights to 5
downplay the importance of these outliers in the linear regression. On inspection of the weights, we observed that all the obvious outliers had been assigned a weight of zero, so were easily filtered out. Some 3.3 % of the data were trimmed in this way. The residuals of the remaining dataset were close to normally distributed. Change in AGB was calculated for each plot in the trimmed dataset as (AGB2011−AGB2006)/5, and the 10
mean and standard deviation estimated. There was significant spatial auto-correlation of AGB2006 values (Moran’s I=0.138, p <0.001) and also AGB change (Moran’s
I=0.038, p <0.001). However, following the conclusion of Hawkins et al. (2007) that
regression estimates are not significantly affected by spatial autocorrelation, we
con-sidered it unnecessary to subsample the gridded dataset to avoid it. 15
The trimmed dataset was used to model AGB growth as a function of biomass, using Bayesian inference, and to create a woodland dynamics simulator. The growth model was:
AGB2011=a+b×AGB
2006+εwhereε∼N (0,c+d×AGB2006) (1)
wherea,b,canddare parameters calculated using STAN (STAN Development Team, 20
2014), a Bayesian inference package. We used uninformative prior and a burn-in of 5000 iterations (well in excess of that needed for convergence), then took 100 samples from the posterior distribution. We also fitted a model containing a quadratic biomass term, but the 95 % confidence intervals of the quadratic term overlapped with zero, indicating no support for its inclusion.
25
Parameter values drawn from the posterior distribution were fed into a simple simu-lation model. We created a 5000 cell “landscape” with starting biomass sampled ran-domly from AGB2006. For each cell the annual biomass increments were estimated by
BGD
12, 14739–14772, 2015
Modelling above-ground carbon
dynamics using multi-temporal
airborne lidar
W. Simonson et al.
Title Page
Abstract Introduction
Conclusions References
Tables Figures
◭ ◮
◭ ◮
Back Close
Full Screen / Esc
Printer-friendly Version
Interactive Discussion
Discussion
P
a
per
|
Discussion
P
a
per
|
Discussion
P
a
per
|
Discussion
P
a
per
|
drawing parameters randomly from the posterior distribution
∆AGB=(a+(b−1)×AGB+ε)/5 (2)
whereεwas drawn at random fromN (0,c+d×AGB). The biomass of each cell was
then altered by ∆AGB and the iterative process continued for 100 years. Mean AGB
values for the landscape each year were recorded and plotted with 95 % confidence 5
intervals.
We also included the effect of various fire scenarios on mean biomass change and
carbon dynamics in a simplistic way. We assumed that the probability of a cell be-ing destroyed by fire, p, did not depend on that cell’s AGB and did not vary among years. For each time step and pixel, we decided whether a fire event had occurred in 10
a cell by drawing random numbers from the binomial distribution, with the AGB being reset to zero as a result of a fire event. An annual probability of fire occurrence for the region of Guadalajara, based on areas burned each year 1991–2010 (Ministerio de Agricultura, 2002, 2012) isp=0.002, whilst that from a model parameterized from
topoclimatic data from southern Spain isp=0.004 (Purves et al., 2007). A five-fold
15
increase in area burned as a result of a high emission climate scenario is predicted for similar forest types in Portugal (see Carvalho et al., 2009). Thus, as well as the no-fire scenario, we tested the three fire probabilities ofp=0.002, 0.004 and 0.01 to look at
the sensitivity of carbon accumulation in the mixed woodlands to a realistic range of fire frequencies. Carbon sequestration potential (mean carbon storage in biomass over the 20
simulation period, Mg ha−1) was calculated using the IPCC default 0.47 carbon fraction (McGroddy, M.E., Daufresne and Hedin, 2004), and scaled up to a total value of carbon (and CO2 equivalent, 3.67 x C, Mt) for all mixed woodland in the autonomous commu-nity of Castilla La Mancha (181 000 ha) under the no-fire and three fire scenarios. We acknowledge that the simulation model is basic, and since it is not spatially explicit it 25
BGD
12, 14739–14772, 2015
Modelling above-ground carbon
dynamics using multi-temporal
airborne lidar
W. Simonson et al.
Title Page
Abstract Introduction
Conclusions References
Tables Figures
◭ ◮
◭ ◮
Back Close
Full Screen / Esc
Printer-friendly Version
Interactive Discussion
Discussion
P
a
per
|
Discussion
P
a
per
|
Discussion
P
a
per
|
Discussion
P
a
per
|
3 Results
Lidar estimated mean AGB of mixed woodlands was 41.8 Mg ha−1 in 2006
and 47.9 Mg ha−1 in 2011. Mean biomass change in this five-year period was 1.22 Mg ha−1year−1, with a considerable degree of variation around this estimate (SD=1.92 Mg ha−1) and a large number of pixels losing biomass (Fig. 3), presumably
5
as a result of disturbance. There was very good agreement between above-ground biomass estimated from the lidar modelling and Spanish National Inventory plots for mixed oak-juniper-pine woodland (Table 2). The lidar-based estimate is also in rea-sonable agreement with that calculated from the 2006 dataset in an earlier analysis: 44.7 Mg ha−1 for holm oak woodland (García et al., 2010). AGB change as modelled 10
by the lidar approach was also close to estimates derived from the SFI and the Fundiv tree ring data (Table 2). The standard deviation of the lidar based AGB change es-timate is relatively high, probably as a result of lidar sampling/processing errors that are greater than measurement errors associated with plots and tree rings. From the lidar dataset, there was a statistically significant but minor effect on AGB change of
15
altitude (range 908–1322 m; ∆AGB=21.17−0.01×altitude, R2=0.0180, p <0.001)
and aspect (calculated as folded aspect |aspect–180|; ∆AGB=3.31−0.03×aspect, R2=0.0057,p <0.001).
Biomass change was modelled according to the relationship:
AGB2011=3.98+1.05×AGB
2006+εwhereε∼N (0, 4.32+1.10×AGB2006) (3) 20
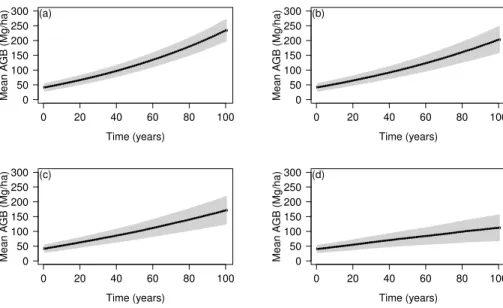
Because b >1, (i.e. b=1.05) the woodlands are accumulating biomass over time,
and although the variance term is large so some cells are losing biomass (Fig. 3). The disturbance-free simulation model showed a strong increase in accumulated AGB over the whole 100 year period (Fig. 4a). The mean AGB rose from 42.6 (±5.6) to 236.9 (±18.5) Mg ha−1, which equates to a mean carbon flux of 1.95 Mg C ha−1year−1. 25
By modelling the occurrence of fire at probabilities of p=0.002, 0.004 and 0.01, we
BGD
12, 14739–14772, 2015
Modelling above-ground carbon
dynamics using multi-temporal
airborne lidar
W. Simonson et al.
Title Page
Abstract Introduction
Conclusions References
Tables Figures
◭ ◮
◭ ◮
Back Close
Full Screen / Esc
Printer-friendly Version
Interactive Discussion
Discussion
P
a
per
|
Discussion
P
a
per
|
Discussion
P
a
per
|
Discussion
P
a
per
|
Table 3). Mean (and standard deviation) values for AGB after 100 years were 200.6 (±21.1), 174.2 (±22.7), and 114.1 (±21.5) Mg ha−1for a fire probability of 0.002, 0.004 and 0.01 respectively. The effects of increasing fire occurrence also have dramatic
ef-fects on the carbon sequestration potential of the mixed woodlands considered at a re-gional level (i.e. Castilla la Mancha, Table 3), with the most severe fire regime reducing 5
that potential by almost a half.
4 Discussion
Here we provide a demonstration of the potential of lidar remote sensing to de-liver large-scale high-fidelity maps of above-ground biomass and carbon dynam-ics. Our lidar based biomass growth model, estimating a mean annual growth of 10
1.22 Mg C ha−1year−1 is in excellent agreement with the estimate independently de-rived from the Spanish National Forest Inventory (1.19 Mg C ha−1year−1). Even though there is a large standard deviation around our estimate, the enormous sample size (9136 pixels) means that standard errors become miniscule, so our landscape level projections are delivered with high precision and reliability (Coomes et al., 2002). 15
In the Anthropocene era of rapid climate and environmental change, there is an urgent need for reliable large-scale monitoring of above-ground biomass and carbon stocks in forests and woodlands (Henry et al., 2015), and developing our understand-ing of how carbon stocks will change in the future. Forests serve the critical function of sequestering atmospheric carbon and reducing the potential rate of climate change. 20
However, they also provide other highly important services, including provision of tim-ber, food and other non-timber products, regulation of water cycle and habitat for biodi-versity (Gamfeldt et al., 2013; Ojea et al., 2012; WRI, 2005). The amount of biomass in forest is a metric relevant to all of these functions, with an especially close relationship with sequestered and stored carbon (Boisvenue and Running, 2006). In the context of 25
ro-BGD
12, 14739–14772, 2015
Modelling above-ground carbon
dynamics using multi-temporal
airborne lidar
W. Simonson et al.
Title Page
Abstract Introduction
Conclusions References
Tables Figures
◭ ◮
◭ ◮
Back Close
Full Screen / Esc
Printer-friendly Version
Interactive Discussion
Discussion
P
a
per
|
Discussion
P
a
per
|
Discussion
P
a
per
|
Discussion
P
a
per
|
bust methodologies are needed for the regular assessment of carbon stocks in forests (Gibbs et al., 2007).
Our work demonstrates one such robust approach that has delivered a credible model of landscape-level carbon stocks and fluxes based on a five-year interval repeat-survey lidar dataset. The methodology involved identifying and discarding a small num-5
ber of outliers in the AGB estimates, and it is worth reflecting on their origin. One of the challenges of multi-temporal lidar analyses are when different instruments and
specifi-cations are used in the surveys. In our case, the 2006 lidar survey had a much lower point density than for 2011, and inspection of the resulting point cloud indicated a con-siderably uneven distribution of the scan lines. The accuracy of the resulting terrain and 10
canopy models will therefore be lower, potentially giving rise to some of the anomalies in our results. We sought to quantify the source of this error by performing a compar-ison of top canopy height (TCH) models from crossing flight-lines (data not given) for both years at the 30 m grid scale, for which the standard deviation for 2006 was more than double that for 2011. TCH is known to be quite robust across different instruments
15
(Asner and Mascaro, 2014), being less susceptible to differences in laser canopy
pen-etration than mean canopy height (MCH) (Næsset, 2009). However, our plots are quite small and this means that in comparison with larger plots: (1) errors caused by spatial misalignment of plots and lidar data are greater (Asner et al., 2009), (2) integrating measurements provides a less representative average (Zolkos et al., 2013); and (3) 20
disagreement in protocol between lidar and field observations is greater (influenced by the effects of bisecting tree crowns in lidar data vs. calling a tree “in” or “out” of the plot
in field data; Mascaro et al., 2011). With regard to the latter issue, the potential error is affected by the average crown size relative to plot dimensions, such that it will be less
in our situation (as it also is for boreal forest, Næsset et al., 2011), than it would be for 25
tropical forests.
At the extensive spatial scales required, remote sensing methodologies offer the
only practicable approach to the challenge of forest monitoring, with lidar being the remote sensing instrument of choice given its potential to characterise the three
BGD
12, 14739–14772, 2015
Modelling above-ground carbon
dynamics using multi-temporal
airborne lidar
W. Simonson et al.
Title Page
Abstract Introduction
Conclusions References
Tables Figures
◭ ◮
◭ ◮
Back Close
Full Screen / Esc
Printer-friendly Version
Interactive Discussion
Discussion
P
a
per
|
Discussion
P
a
per
|
Discussion
P
a
per
|
Discussion
P
a
per
|
mensional structure of canopies and understories to a high degree of accuracy and resolution. Whilst spatial and temporal coverage of the terrestrial and wooded surface of the planet is still limited, this is improving continuously. A number of national surveys have been undertaken or commissioned, and building on the experience of the GLAS (Geoscience Laser Altimetry System) instrument on ICESAT (2003–2010), the GEDI 5
Lidar space-borne facility is planned for deployment in 2019 (Dubayah et al., 2014). With these advancements, it is an important time to develop proof of principle of lidar monitoring of forest biomass and carbon stocks and fluxes. In this respect, a num-ber of important multi-temporal lidar studies have emerged. Typical of these are an analysis of AGB dynamics, tree growth and peat subsidence in peat swamp forests of 10
Central Kalimantan, Indonesia 2007–2011 (Boehm et al., 2013; Englhart et al., 2013), biomass changes in conifer forests of northern Idaho 2003–2009 at the pixel, plot and landscape level and looking at the impacts of logging (Hudak et al., 2012), studies of canopy gap dynamics (Blackburn et al., 2014; Vepakomma et al., 2008, 2010, 2011), and treefall rates and spatial patterns in a savanna landscape 2008–2010 (Levick and 15
Asner, 2013). A study employing four lidar surveys between 2000–2005 established an optimum interval (3 years) for measuring tree growth in red pine forests at an accept-able level of uncertainty (Hopkinson et al., 2008).
Our study makes an important additional contribution to this literature. It demon-strates how a relatively low-intensive field sampling campaign can effectively
cali-20
brate a lidar dataset to scale up credible estimates of AGB and AGC at the land-scape level. It is also novel in studying these dynamics within a Mediterranean en-vironment. Much focus of lidar-based biomass modelling has been on tropical for-est systems, given their importance to the global carbon cycle. Mediterranean wood-lands hold a much lower carbon density, yet are valuable carbon stores given their 25
extensive nature not just in the Mediterranean Basin but also other similar climate re-gions in the world. Furthermore, the potential effects of climate change in
BGD
12, 14739–14772, 2015
Modelling above-ground carbon
dynamics using multi-temporal
airborne lidar
W. Simonson et al.
Title Page
Abstract Introduction
Conclusions References
Tables Figures
◭ ◮
◭ ◮
Back Close
Full Screen / Esc
Printer-friendly Version
Interactive Discussion
Discussion
P
a
per
|
Discussion
P
a
per
|
Discussion
P
a
per
|
Discussion
P
a
per
|
suggests a significant AGB increase from 42.6 to 236.9 Mg ha−1 over a 100 year pe-riod (equivalent to 1.94 Mg C ha−1year−1). Pan et al. (2011) estimates an annual in-crease of 1.68 Mg C ha−1year−1 in European temperate forests in 2000–2007, whilst the annual carbon sink in Mediterranean pine plantations range between 1.06– 2.99 Mg C ha−1year−1 depending on species and silvicultural treatment (Bravo et al., 5
2008). Estimates provided by Ruiz-Benito et al. (2014) range from 0.55 (sclerophyllous vegetation) to 0.73 (natural pine forest) and 1.45 (pine plantation). Our own estimate of carbon sequestration potential equates to a regional carbon sequestration potential of over 10 M kg (19 kt CO2 equivalent) for mixed woodlands in Castilla la Mancha. Such a figure can be set in the context of national level commitments to the reduction of 10
greenhouse gas emissions of 10 % against the Kyoto base year value of 289.8 Mt CO2 equivalent (EEA, 2014). Under Spain’s “Socioeconomic Plan of Forest Activation”, land use, land use change and forestry (LULUCF) is projected to absorb 20–30 Mt CO2 equivalent per year.
The contribution of Mediterranean forests to the greenhouse gas balance sheet is 15
vulnerable to the effects of climate change, for which the Mediterranean is a hotspot
region (Giorgi and Lionello, 2008; Lindner et al., 2010). One of the mediating drivers is forest fire risk. We found that an increase in fire probability from 0.002 to 0.01 dramat-ically altered the carbon sequestration potential of the landscape, with carbon stocks much reduced after 100 years with the highest fire probability scenario. It is worth noting 20
in this respect that our modelled range of fire probabilities are conservative compared to estimates used in other simulations for similar regions (e.g. 0.01–0.2 for Catalonia, Lloret et al., 2003). However, it is also necessary to note that our simplistic modelling of fire, using a set probability of a burn irrespective of factors such as landscape position and temporal variability, mean that our results can only be treated as indicative of the 25
scale of effect of different scenarios on the landscape carbon dynamics. For example,
our modelling does not account for the way in which small changes in temperature and rainfall regimes could lead to tipping points of much higher risk and frequency, if
BGD
12, 14739–14772, 2015
Modelling above-ground carbon
dynamics using multi-temporal
airborne lidar
W. Simonson et al.
Title Page
Abstract Introduction
Conclusions References
Tables Figures
◭ ◮
◭ ◮
Back Close
Full Screen / Esc
Printer-friendly Version
Interactive Discussion
Discussion
P
a
per
|
Discussion
P
a
per
|
Discussion
P
a
per
|
Discussion
P
a
per
|
not severity, of burns (Moritz et al., 2012), and dramatically different carbon dynamics
outcomes.
Our modelling is neither able to account for ecophysiological factors. Tree physiology is responsive to changing temperature and soil water availability, influencing rates of regeneration, growth and mortality (Choat and Way, 2013; Choat et al., 2012; Frank 5
et al., 2015; Williams et al., 2012). One study of low productivity forests (including Alto Tajo as a continental Mediterranean study area) showed how leaf respiration rates, and their ability to acclimate to seasonal changes in the environment, have a profound effect on whether trees can maintain productivity – and continue to act as carbon sinks
– in dryland areas (Zaragoza-Castells et al., 2008). 10
Nevertheless, our modelling approach shows considerable promise for understand-ing the effects of different drivers on vegetation dynamics and making informative
fu-ture predictions (Chambers et al., 2013; Coomes and Allen, 2007; Espírito-Santo et al., 2014). We compared no-fire with three different fire scenarios, but it would be equally
possible to develop our approach further to consider other environmental and ecologi-15
cal drivers of the AGB and AGC dynamics, including tree diversity (Jucker et al., 2014; Ruiz-Benito et al., 2014a) and competition effects (Ruiz-Benito et al., 2014a, b; Vayreda
et al., 2012). With regard to understanding the landscape-level carbon dynamics of Spanish forests, in further work we propose coverage of a full range of different
for-est types and the development of more sophisticated climate change scenarios using 20
models based on meteorological data, environmental parameters and different IPCC
projections. More widely, the further development and testing of these methods is criti-cal for exploring the prospects for, and contribution of, forests in the global carbon cycle under future environmental change.
Appendix A
25
BGD
12, 14739–14772, 2015
Modelling above-ground carbon
dynamics using multi-temporal
airborne lidar
W. Simonson et al.
Title Page
Abstract Introduction
Conclusions References
Tables Figures
◭ ◮
◭ ◮
Back Close
Full Screen / Esc
Printer-friendly Version
Interactive Discussion
Discussion
P
a
per
|
Discussion
P
a
per
|
Discussion
P
a
per
|
Discussion
P
a
per
|
Pinus nigraArn.
StemWs= 0.0403·d1.838·h0.945
Thick branchesWb2–7= If d≤32.5 cm thenZ =0; Ifd >32.5 cm then Z=1;
[0.228·(d−32.5)2]·Z
Medium branchesWb2–7= 0.0521·d2
5
Thin branches+needles W
b2+n= 0.0720·d2
RootsWr= 0.0189·d2.445
Pinus sylvestrisL.
StemWs= 0.0154·d2·h
Thick branchesWb2–7= If d≤37.5 cm thenZ =0; Ifd >37.5 cm then Z=1;
10
[0.540·(d−37.5)2−0.0119·(d−37.5)2·h]·Z
Medium branchesWb2–7= 0.0295·d2.742·h−0.899 Thin branches+needles W
b2+n= 0.530·d2.199·h−1.153
RootsWr= 0.130·d2
Juniperus thuriferaL. (applied for allJuniperus) 15
StemWs= 0.0132·d2·h+0.217·d·h
Thick branchesWb2–7= If d≤22.5 cm thenZ =0; Ifd >22.5 cm thenZ=1;
[0.107·(d−22.5)2]·Z
Medium branchesWb2–7= 0.00792·d2·h
Thin branches+needles W
b2+n= 0.273·d·h 20
RootsWr= 0.0767·d2
BGD
12, 14739–14772, 2015
Modelling above-ground carbon
dynamics using multi-temporal
airborne lidar
W. Simonson et al.
Title Page
Abstract Introduction
Conclusions References
Tables Figures
◭ ◮
◭ ◮
Back Close
Full Screen / Esc
Printer-friendly Version
Interactive Discussion
Discussion
P
a
per
|
Discussion
P
a
per
|
Discussion
P
a
per
|
Discussion
P
a
per
|
Quercus faginea
StemWs= 0.154·d2
Thick branchesWb2–7= 0.0861·d2
Medium branchesWb2–7= 0.127·d2−0.00598·d2·h
Thin branches+leavesW
b2+l= 0.0726·d2−0.00275·d2·h 5
RootsWr= 0.169·d2
Quercus ilex
StemWs= 0.143·d2
Thick branchesWb2–7= Ifd≤12.5 cm then Z=0; Ifd >12.5 cm thenZ=1; [0.0684·(d−12.5)2·h]·Z
10
Medium branchesWb2–7= 0.0898·d2
Thin branches+leavesW
b2+l= 0.0824·d2
RootsWr= 0.254·d2
Notes:
Ws: Biomass weight of the stem fraction (kg); 15
Wb7: Biomass weight of the thick branches fraction (diameter larger than 7 cm) (kg);
Wb2–7: Biomass weight of medium branches fraction (diameter between 2 and 7 cm) (kg);
Wb2+l: Biomass weight of thin branches fraction (diameter smaller than 2 cm) with leaves (kg);
20
Wr: Biomass weight of the belowground fraction (kg);
d: diameter at breast height (cm);
BGD
12, 14739–14772, 2015
Modelling above-ground carbon
dynamics using multi-temporal
airborne lidar
W. Simonson et al.
Title Page
Abstract Introduction
Conclusions References
Tables Figures
◭ ◮
◭ ◮
Back Close
Full Screen / Esc
Printer-friendly Version
Interactive Discussion
Discussion
P
a
per
|
Discussion
P
a
per
|
Discussion
P
a
per
|
Discussion
P
a
per
|
Author contributions. The project was conceived by D. Coomes and W. Simonson. Lidar anal-ysis and first manuscript drafting was undertaken by W. Simonson. D. Coomes designed the statistical approach, and P. Ruiz-Benito provided the independent validation data and analysis based on the Spanish National Forest Inventory. F. Valladares oversaw field data collection, and with all authors contributed to the finalisation of the manuscript.
5
Acknowledgements. Field data were collected by T. Jucker and partners from University Stefan cel Mare of Suceava (Romania) and National Museum of Natural Sciences, Madrid (Spain). Biomass estimates were calculated by T. Jucker. The authors would like to acknowledge the personnel of the Airborne Research and Survey Facility (NERC). We thank the MAGRAMA for granting access to the Spanish Forest Inventory. WS was funded by FunDivEurope and the 10
Isaac Newton Trust. P. Ruiz-Benito was supported by The International Post doc Fellowship Programme in Plant Sciences (PLANT FELLOWS).
References
Allen, C. D., Macalady, A. K., Chenchouni, H., Bachelet, D., McDowell, N., Vennetier, M., Kitzberger, T., Rigling, A., Breshears, D. D., Hogg, E. H. (Ted), Gonzalez, P., Fen-15
sham, R., Zhang, Z., Castro, J., Demidova, N., Lim, J.-H., Allard, G., Running, S. W., Semerci, A., and Cobb, N.: A global overview of drought and heat-induced tree mortal-ity reveals emerging climate change risks for forests, Forest Ecol. Manag., 259, 660–684, doi:10.1016/j.foreco.2009.09.001, 2010.
Asner, G. P. and Mascaro, J.: Mapping tropical forest carbon: Calibrating plot estimates to a sim-20
ple LiDAR metric, Remote Sens. Environ., 140, 614–624, doi:10.1016/j.rse.2013.09.023, 2014.
Asner, G. P., Flint Hughes, R., Varga, T. A., Knapp, D. E., and Kennedy-Bowdoin, T.: Environ-mental and Biotic Controls over Aboveground Biomass Throughout a Tropical Rain Forest, Ecosystems, 12, 261–278, doi:10.1007/s10021-008-9221-5, 2009.
25
Asner, G. P., Mascaro, J., Anderson, C., Knapp, D. E., Martin, R. E., Kennedy-Bowdoin, T., van Breugel, M., Davies, S., Hall, J. S., Muller-Landau, H. C., Potvin, C., Sousa, W., Wright, J., and Bermingham, E.: High-fidelity national carbon mapping for resource management and REDD+, Carbon Balance Manag., 8, 7, doi:10.1186/1750-0680-8-7, 2013.
BGD
12, 14739–14772, 2015
Modelling above-ground carbon
dynamics using multi-temporal
airborne lidar
W. Simonson et al.
Title Page
Abstract Introduction
Conclusions References
Tables Figures
◭ ◮
◭ ◮
Back Close
Full Screen / Esc
Printer-friendly Version
Interactive Discussion
Discussion
P
a
per
|
Discussion
P
a
per
|
Discussion
P
a
per
|
Discussion
P
a
per
|
Baeten, L., Verheyen, K., Wirth, C., Bruelheide, H., Bussotti, F., Finér, L., Jaroszewicz, B., Selvi, F., Valladares, F., Allan, E., Ampoorter, E., Auge, H., Avăcăriei, D., Barbaro, L.,
Bărnoaiea, I., Bastias, C. C., Bauhus, J., Beinhoff, C., Benavides, R., Benneter, A., Berger, S.,
Berthold, F., Boberg, J., Bonal, D., Brüggemann, W., Carnol, M., Castagneyrol, B., Char-bonnier, Y., Chećko, E., Coomes, D., Coppi, A., Dalmaris, E., Dănilă, G., Dawud, S. M.,
5
de Vries, W., De Wandeler, H., Deconchat, M., Domisch, T., Duduman, G., Fischer, M., Fotelli, M., Gessler, A., Gimeno, T. E., Granier, A., Grossiord, C., Guyot, V., Hantsch, L., Hät-tenschwiler, S., Hector, A., Hermy, M., Holland, V., Jactel, H., Joly, F.-X., Jucker, T., Kolb, S., Koricheva, J., Lexer, M. J., Liebergesell, M., Milligan, H., Müller, S., Muys, B., Nguyen, D., Nichiforel, L., Pollastrini, M., Proulx, R., Rabasa, S., Radoglou, K., Ratcliffe, S.,
Raulund-10
Rasmussen, K., Seiferling, I., Stenlid, J., Vesterdal, L., von Wilpert, K., Zavala, M. A., Zielin-ski, D., and Scherer-Lorenzen, M.: A novel comparative research platform designed to deter-mine the functional significance of tree species diversity in European forests, Perspect. Plant Ecol., 15, 281–291, doi:10.1016/j.ppees.2013.07.002, 2013.
Baskerville, G. L.: Regression in the estimation of plant biomass, Can. J. Forest Res., 2, 49–53, 15
1972.
Benito-Garzón, M., Ruiz-Benito, P., and Zavala, M. A.: Interspecific differences in tree growth
and mortality responses to environmental drivers determine potential species distributional limits in Iberian forests, Global Ecol. Biogeogr., 22, 1141–1151, doi:10.1111/geb.12075, 2013.
20
Blackburn, G. A., Abd Latif, Z., and Boyd, D. S.: Forest disturbance and regeneration: a mosaic of discrete gap dynamics and open matrix regimes?, edited by: Nakashizuka, T., J. Veg. Sci., 25, 1341–1354, doi:10.1111/jvs.12201, 2014.
Boehm, H.-D. V., Liesenberg, V., and Limin, S. H.: Multi-temporal airborne LiDAR-survey and field measurements of tropical peat swamp forest to monitor changes, IEEE J. Sel. Top. Appl., 25
6, 1524–1530, doi:10.1109/JSTARS.2013.2258895, 2013.
Boisvenue, C. and Running, S. W.: Impacts of climate change on natural forest productiv-ity – evidence since the middle of the 20th century, Global Change Biol., 12, 862–882, doi:10.1111/j.1365-2486.2006.01134.x, 2006.
Bravo, F., Bravo-Oviedo, A., and Diaz-Balteiro, L.: Carbon sequestration in Spanish Mediter-30
BGD
12, 14739–14772, 2015
Modelling above-ground carbon
dynamics using multi-temporal
airborne lidar
W. Simonson et al.
Title Page
Abstract Introduction
Conclusions References
Tables Figures
◭ ◮
◭ ◮
Back Close
Full Screen / Esc
Printer-friendly Version
Interactive Discussion
Discussion
P
a
per
|
Discussion
P
a
per
|
Discussion
P
a
per
|
Discussion
P
a
per
|
Carvalho, A., Flannigan, M. D., Logan, K. A., Gowman, L. M., Miranda, A. I., and Borrego, C.: The impact of spatial resolution on area burned and fire occurrence projections in Portugal under climate change, Clim. Change, 98, 177–197, doi:10.1007/s10584-009-9667-2, 2009. Chambers, J. Q., Negron-Juarez, R. I., Marra, D. M., Di Vittorio, A., Tews, J., Roberts, D.,
Ribeiro, G. H. P. M., Trumbore, S. E., and Higuchi, N.: The steady-state mosaic of disturbance 5
and succession across an old-growth Central Amazon forest landscape., P. Natl. Acad. Sci. USA, 110, 3949–54, doi:10.1073/pnas.1202894110, 2013.
Chen, Q., Gong, P., Baldocchi, D., and Xie, G.: Filtering airborne laser scanning data with morphological methods, Photogramm. Eng. Rem. S., 73, 175–185, 2007.
Choat, B. and Way, D.: Predicting thresholds of drought-induced mortality in woody plant 10
species, Tree Physiol., 33, 669–671, doi:10.1093/treephys/tpt046, 2013.
Choat, B., Jansen, S., Brodribb, T. J., Cochard, H., Delzon, S., Bhaskar, R., Bucci, S. J., Feild, T. S., Gleason, S. M., Hacke, U. G., Jacobsen, A. L., Lens, F., Maherali, H., Martínez-Vilalta, J., Mayr, S., Mencuccini, M., Mitchell, P. J., Nardini, A., Pittermann, J., Pratt, R. B., Sperry, J. S., Westoby, M., Wright, I. J., and Zanne, A. E.: Global convergence in the vulner-15
ability of forests to drought, Nature, 491, 752–755, doi:10.1038/nature11688, 2012.
Coomes, D. A., and Allen, R. B.: Effects of size, competition and altitude on tree growth, J.
Ecol., 95, 1084–1097, doi:10.1111/j.1365-2745.2007.01280.x, 2007.
Coomes, D. A., Allen, R. B., Scott, N. A., Goulding, C., and Beets, P.: Designing systems to monitor carbon stocks in forests and shrublands, Forest Ecol. Manag., 164, 89–108, 20
doi:10.1016/S0378-1127(01)00592-8, 2002.
Drake, J. B., Knox, R. G., Dubayah, R. O., Clark, D. B., Condit, R., Blair, J. B., and Hofton, M.: Above-ground biomass estimation in closed canopy Neotropical forests using lidar remote sensing: factors, Global Ecol. Biogeogr., 12, 147–159, 2003.
Dubayah, R., Goetz, S. J., Blair, J. B., Fatoyinbo, T. E., Hansen, M., Healey, S. P., Hofton, M. A., 25
Hurtt, G. C., Kellner, J., Luthcke, S. B., and Swatantran, A.: The global ecosystem dynamics investigation, in: Proceedings of the American Geophysical Union, U14A-07, 2014.
EEA: CORINE Land Cover Project, Copenhagen, 1995.
EEA: Annual European Union greenhouse gas inventory 1990–2012 and inventory report 2014 – EEA Technical Report No, 9/2014, European Environment Agency, 2014.
30
Englhart, S., Jubanski, J., and Siegert, F.: Quantifying dynamics in tropical peat swamp forest biomass with multi-temporal LiDAR datasets, Remote Sens., 5, 2368–2388, doi:10.3390/rs5052368, 2013.
BGD
12, 14739–14772, 2015
Modelling above-ground carbon
dynamics using multi-temporal
airborne lidar
W. Simonson et al.
Title Page
Abstract Introduction
Conclusions References
Tables Figures
◭ ◮
◭ ◮
Back Close
Full Screen / Esc
Printer-friendly Version
Interactive Discussion
Discussion
P
a
per
|
Discussion
P
a
per
|
Discussion
P
a
per
|
Discussion
P
a
per
|
Espírito-Santo, F. D. B., Gloor, M., Keller, M., Malhi, Y., Saatchi, S., Nelson, B., Junior, R. C. O., Pereira, C., Lloyd, J., Frolking, S., Palace, M., Shimabukuro, Y. E., Duarte, V., Mendoza, A. M., López-González, G., Baker, T. R., Feldpausch, T. R., Brienen, R. J. W., Asner, G. P., Boyd, D. S., and Phillips, O. L.: Size and frequency of natural forest disturbances and the Amazon forest carbon balance, Nat. Commun., 5, 3434, doi:10.1038/ncomms4434, 2014. 5
Frank, D., Reichstein, M., Bahn, M., Frank, D., Mahecha, M. D., Smith, P., Thonicke, K., van der Velde, M., Vicca, S., Babst, F., Beer, C., Buchmann, N., Canadell, J. G., Ciais, P., Cramer, W., Ibrom, A., Miglietta, F., Poulter, B., Rammig, A., Seneviratne, S. I., Walz, A., Wattenbach, M., Zavala, M. A. and Zscheischler, J.: Effects of climate extremes on the terrestrial carbon
cy-cle: concepts, processes and potential future impacts, Glob. Change Biol., 21, 2861–2880, 10
12916, doi:10.1111/gcb.12916, 2015.
Gamfeldt, L., Snäll, T., Bagchi, R., Jonsson, M., Gustafsson, L., Kjellander, P., Ruiz-Jaen, M. C., Fröberg, M., Stendahl, J., Philipson, C. D., Mikusiński, G., Andersson, E., Westerlund, B.,
Andrén, H., Moberg, F., Moen, J., and Bengtsson, J.: Higher levels of multiple ecosys-tem services are found in forests with more tree species., Nat. Commun., 4, 2328, 15
doi:10.1038/ncomms2328, 2013.
García, M., Riaño, D., Chuvieco, E., and Danson, F. M.: Estimating Biomass Carbon Stocks for a Mediterranean Forest in Central Spain Using LiDAR Height and Intensity Data, Elsevier Inc., 2010.
García, M., Riaño, D., Chuvieco, E., Salas, J., and Danson, F. M.: Multispectral and LiDAR data 20
fusion for fuel type mapping using Support Vector Machine and decision rules, Remote Sens. Environ., 115, 1369–1379, doi:10.1016/j.rse.2011.01.017, 2011.
Gibbs, H. K., Brown, S., Niles, J. O., and Foley, J. A.: Monitoring and estimating tropical forest carbon stocks: making REDD a reality, Environ. Res. Lett., 2, 045023, doi:10.1088/1748-9326/2/4/045023, 2007.
25
Giorgi, F. and Lionello, P.: Climate change projections for the Mediterranean region, Global Planet. Change, 63, 90–104, doi:10.1016/j.gloplacha.2007.09.005, 2008.
Gonzalo, J.: Diagnosis fitoclimática de la España peninsular. Actualización y análisis geoes-tadístico aplicado, Silvopascicultura, Madrid, 2008.
Hawkins, B. A., Diniz-Filho, J. A. F., Mauricio Bini, L., De Marco, P., and Blackburn, T. M.: Red 30
BGD
12, 14739–14772, 2015
Modelling above-ground carbon
dynamics using multi-temporal
airborne lidar
W. Simonson et al.
Title Page
Abstract Introduction
Conclusions References
Tables Figures
◭ ◮
◭ ◮
Back Close
Full Screen / Esc
Printer-friendly Version
Interactive Discussion
Discussion
P
a
per
|
Discussion
P
a
per
|
Discussion
P
a
per
|
Discussion
P
a
per
|
Henry, M., Réjou-Méchain, M., Jara, M. C., Wayson, C., Piotto, D., Westfall, J., Fuentes, J. M. M., Guier, F. A., Lombis, H. C., López, E. C., Lara, R. C., Rojas, K. C., Del Águila Pasquel, J., Montoya, Á. D., Vega, J. F., Galo, A. J., López, O. R., Marklund, L. G., Milla, F., de Jesús Návar Cahidez, J., Malavassi, E. O., Pérez, J., Zea, C. R., García, L. R., Pons, R. R., Sanquetta, C., Scott, C., Zapata-Cuartas, M., and Saint-André, L.: An overview 5
of existing and promising technologies for national forest monitoring, Ann. For. Sci., 72, 779– 788, doi:10.1007/s13595-015-0463-z, 2015.
Hopkinson, C., Chasmer, L., and Hall, R. J.: The uncertainty in conifer plantation growth prediction from multi-temporal lidar datasets, Remote Sens. Environ., 112, 1168–1180, doi:10.1016/j.rse.2007.07.020, 2008.
10
Hudak, A. T., Strand, E. K., Vierling, L. A., Byrne, J. C., Eitel, J. U. H., Martinuzzi, S., and Falkowski, M. J.: Quantifying aboveground forest carbon pools and fluxes from repeat LiDAR surveys, Remote Sens. Environ., 123, 25–40, doi:10.1016/j.rse.2012.02.023, 2012.
Jucker, T., Bouriaud, O., Avacaritei, D., and Coomes, D. A.: Stabilizing effects of diversity on
aboveground wood production in forest ecosystems: linking patterns and processes, Ecol. 15
Lett., 17, 1560–1569, doi:10.1111/ele.12382, 2014.
Kellner, J. R. and Asner, G. P.: Winners and losers in the competition for space in tropical forest canopies, Ecol. Lett., 17, 556–562, doi:10.1111/ele.12256, 2014.
Lefsky, M. A., Cohen, W. B., Harding, D. J., Parker, G. G., Acker, S. A., and Gower, S. T.: Lidar remote sensing of above-ground biomass in three biomes, Global Ecol. Biogeogr., 11, 20
393–399, 2002.
Levick, S. R. and Asner, G. P.: The rate and spatial pattern of treefall in a savanna landscape, Biol. Conserv., 157, 121–127, doi:10.1016/j.biocon.2012.07.009, 2013.
Lindner, M., Maroschek, M., Netherer, S., Kremer, A., Barbati, A., Garcia-Gonzalo, J., Seidl, R., Delzon, S., Corona, P., and Kolström, M.: Climate change impacts, adaptive capacity, 25
and vulnerability of European forest ecosystems, Forest Ecol. Manag., 259, 698–709, doi:10.1016/j.foreco.2009.09.023, 2010.
Lloret, F., Pausas, J. G., and Vila, M.: Responses of mediterranean plant species to different
fire frequencies in Garraf Natural Park (Catalonia, Spain): field observations and modelling predictions, Plant Ecol., 167, 223–235, 2003.
30
Mascaro, J., Asner, G. P., Muller-Landau, H. C., van Breugel, M., Hall, J., and Dahlin, K.: Con-trols over aboveground forest carbon density on Barro Colorado Island, Panama, Biogeo-sciences, 8, 1615–1629, doi:10.5194/bg-8-1615-2011, 2011.
BGD
12, 14739–14772, 2015
Modelling above-ground carbon
dynamics using multi-temporal
airborne lidar
W. Simonson et al.
Title Page
Abstract Introduction
Conclusions References
Tables Figures
◭ ◮
◭ ◮
Back Close
Full Screen / Esc
Printer-friendly Version
Interactive Discussion
Discussion
P
a
per
|
Discussion
P
a
per
|
Discussion
P
a
per
|
Discussion
P
a
per
|
McGroddy, M. E., Daufresne, T., and Hedin, L. O.: Scaling of C : N : P stoichiometry in forests worldwide: implications of terrestrial redfield-type ratios, Ecology, 85, 2390–2401, 2004. Ministerio de Agricultura, A. y M. A.: Los Incendios Forestales en España Decenio 1991–2000,
2002.
Ministerio de Agricultura, A. y M. A.: Los Incendios Forestales en España Decenio 2001–2010, 5
2012.
Moritz, M. A., Parisien, M.-A., Batllori, E., Krawchuk, M. A., Van Dorn, J., Ganz, D. J., and Hayhoe, K.: Climate change and disruptions to global fire activity, Ecosphere, 3, art49, doi:10.1890/ES11-00345.1, 2012.
Nabuurs, G. J., Schelhaas, M. J., Mohren, G. M. J., and Field, C. B.: Temporal evolution of 10
the European forest sector carbon sink from 1959 to 1999, Glob. Change Biol., 9, 152–160, 2003.
Nabuurs, G. J., Hengeveld, G. M., van der Werf, D. C., and Heidema, A. H.: European for-est carbon balance assessed with inventory based methods – an introduction to a special section, Forest Ecol. Manag., 260, 239–240, doi:10.1016/j.foreco.2009.11.024, 2010. 15
Nabuurs, G.-J., Lindner, M., Verkerk, P. J., Gunia, K., Deda, P., Michalak, R., and Grassi, G.: First signs of carbon sink saturation in European forest biomass, Nat. Clim. Chang., 3, 792– 796, doi:10.1038/nclimate1853, 2013.
Næsset, E.: Effects of different sensors, flying altitudes, and pulse repetition frequencies on
forest canopy metrics and biophysical stand properties derived from small-footprint airborne 20
laser data, Remote Sens. Environ., 113, 148–159, doi:10.1016/j.rse.2008.09.001, 2009. Næsset, E., Gobakken, T., Solberg, S., Gregoire, T. G., Nelson, R., Ståhl, G., and Weydahl, D.:
Model-assisted regional forest biomass estimation using LiDAR and InSAR as auxiliary data: a case study from a boreal forest area, Remote Sens. Environ., 115, 3599–3614, doi:10.1016/j.rse.2011.08.021, 2011.
25
Ojea, E., Ruiz-Benito, P., Markandya, A., and Zavala, M. A.: Wood provisioning in Mediter-ranean forests: A bottom-up spatial valuation approach, For. Policy Econ., 20, 78–88, doi:10.1016/j.forpol.2012.03.003, 2012.
Pan, Y., Birdsey, R. A., Fang, J., Houghton, R., Kauppi, P. E., Kurz, W. A., Phillips, O. L., Shvidenko, A., Lewis, S. L., Canadell, J. G., Ciais, P., Jackson, R. B., Pacala, S. W., 30
BGD
12, 14739–14772, 2015
Modelling above-ground carbon
dynamics using multi-temporal
airborne lidar
W. Simonson et al.
Title Page
Abstract Introduction
Conclusions References
Tables Figures
◭ ◮
◭ ◮
Back Close
Full Screen / Esc
Printer-friendly Version
Interactive Discussion
Discussion
P
a
per
|
Discussion
P
a
per
|
Discussion
P
a
per
|
Discussion
P
a
per
|
Pausas, J. G., Llovet, J., Anselm, R., and Vallejo, R.: Are wildfires a disaster in the Mediter-ranean basin? – a review vegetation changes shrublands dominated by resprouting species, Int. J. Wildland Fire, 17, 713–723, 2008.
Purves, D. W., Zavala, M. A., Ogle, K., Prieto, F., and Rey Benayas, J. M.: Environmental het-erogeneity, bird-mediated directed dispersal, and oak woodland dynamics in Mediterranean 5
Spain, Ecol. Monogr., 77, 77–97, doi:10.1890/05-1923, 2007.
Réjou-Méchain, M., Muller-Landau, H. C., Detto, M., Thomas, S. C., Le Toan, T., Saatchi, S. S., Barreto-Silva, J. S., Bourg, N. A., Bunyavejchewin, S., Butt, N., Brockelman, W. Y., Cao, M., Cárdenas, D., Chiang, J.-M., Chuyong, G. B., Clay, K., Condit, R., Dattaraja, H. S., Davies, S. J., Duque, A., Esufali, S., Ewango, C., Fernando, R. H. S., Fletcher, C. D., Gu-10
natilleke, I. A. U. N., Hao, Z., Harms, K. E., Hart, T. B., Hérault, B., Howe, R. W., Hubbell, S. P., Johnson, D. J., Kenfack, D., Larson, A. J., Lin, L., Lin, Y., Lutz, J. A., Makana, J.-R., Malhi, Y., Marthews, T. R., McEwan, R. W., McMahon, S. M., McShea, W. J., Muscarella, R., Natha-lang, A., Noor, N. S. M., Nytch, C. J., Oliveira, A. A., Phillips, R. P., Pongpattananurak, N., Punchi-Manage, R., Salim, R., Schurman, J., Sukumar, R., Suresh, H. S., Suwanvecho, U., 15
Thomas, D. W., Thompson, J., Uríarte, M., Valencia, R., Vicentini, A., Wolf, A. T., Yap, S., Yuan, Z., Zartman, C. E., Zimmerman, J. K., and Chave, J.: Local spatial structure of forest biomass and its consequences for remote sensing of carbon stocks, Biogeosciences, 11, 6827–6840, doi:10.5194/bg-11-6827-2014, 2014.
Ruiz-Benito, P., Gómez-Aparicio, L., Paquette, A., Messier, C., Kattge, J., and Zavala, M. A.: 20
Diversity increases carbon storage and tree productivity in Spanish forests, Global Ecol. Biogeogr., 23, 311–322, doi:10.1111/geb.12126, 2014a.
Ruiz-Benito, P., Madrigal-González, J., Ratcliffe, S., Coomes, D. A., Kändler, G., Lehtonen, A.,
Wirth, C., and Zavala, M. A.: Stand structure and recent climate change constrain stand basal area change in European forests: a comparison across boreal, temperate, and mediter-25
ranean biomes, Ecosystems, 17, 1439–1454, doi:10.1007/s10021-014-9806-0, 2014b. Ruiz-Peinado, R., del Rio, M., and Montero, G.: New models for estimating the carbon sink
capacity of Spanish softwood species, For. Syst., 20, 176–188, 2011.
Ruiz-Peinado, R., Montero, G., and del Rio, M.: Biomass models to estimate carbon stocks for hardwood tree species, For. Syst., 21, 42–52, 2012.
30
Smith, M. J., Purves, D. W., Vanderwel, M. C., Lyutsarev, V., and Emmott, S.: The climate dependence of the terrestrial carbon cycle, including parameter and structural uncertainties, Biogeosciences, 10, 583–606, doi:10.5194/bg-10-583-2013, 2013.