www.atmos-chem-phys.net/16/3145/2016/ doi:10.5194/acp-16-3145-2016
© Author(s) 2016. CC Attribution 3.0 License.
Aerosol dynamics within and above forest in relation to turbulent
transport and dry deposition
Üllar Rannik1, Luxi Zhou1, Putian Zhou1, Rosa Gierens1, Ivan Mammarella1, Andrey Sogachev2, and Michael Boy1 1Department of Physics, University of Helsinki, P.O. Box 48, 00014 Helsinki, Finland
2Department of Wind Energy, Technical University of Denmark, 4000 Roskilde, Denmark Correspondence to:Üllar Rannik ([email protected])
Received: 7 June 2015 – Published in Atmos. Chem. Phys. Discuss.: 16 July 2015 Revised: 2 January 2016 – Accepted: 19 February 2016 – Published: 9 March 2016
Abstract.A 1-D atmospheric boundary layer (ABL) model coupled with a detailed atmospheric chemistry and aerosol dynamical model, the model SOSAA, was used to predict the ABL and detailed aerosol population (characterized by the number size distribution) time evolution. The model was applied over a period of 10 days in May 2013 to a pine for-est site in southern Finland. The period was characterized by frequent new particle formation events and simultaneous in-tensive aerosol transformation. The aim of the study was to analyze and quantify the role of aerosol and ABL dynamics in the vertical transport of aerosols. It was of particular inter-est to what extent the fluxes above the canopy deviate from the particle dry deposition on the canopy foliage due to the above-mentioned processes. The model simulations revealed that the particle concentration change due to aerosol dynam-ics frequently exceeded the effect of particle deposition by even an order of magnitude or more. The impact was, how-ever, strongly dependent on particle size and time. In spite of the fact that the timescale of turbulent transfer inside the canopy is much smaller than the timescales of aerosol dy-namics and dry deposition, leading us to assume well-mixed properties of air, the fluxes at the canopy top frequently devi-ated from deposition inside the forest. This was due to trans-formation of aerosol concentration throughout the ABL and resulting complicated pattern of vertical transport. Therefore we argue that the comparison of timescales of aerosol dy-namics and deposition defined for the processes below the flux measurement level do not unambiguously describe the importance of aerosol dynamics for vertical transport above the canopy. We conclude that under dynamical conditions re-ported in the current study the micrometeorological particle flux measurements can significantly deviate from the dry
de-position into the canopy. The deviation can be systematic for certain size ranges so that the time-averaged particle fluxes can be also biased with respect to deposition sink.
1 Introduction
during the transport pathway between the EC measurement level and the collecting surfaces. Depending on the particle size and the prevailing conditions, i.e., the nucleation rate, the availability of condensing vapors determining the con-densational growth and the shape of the particle size spec-trum, the aerosol dynamical terms can vary significantly. The timescale of aerosol dynamical processes varies typi-cally between 103 and 105s (Pryor and Binkowski, 2004; Pryor et al., 2013), i.e., being on the hourly timescale and more. This is a sufficient time to allow well-mixed conditions to establish within the unstable daytime atmospheric bound-ary layer (ABL), where the mixing timescale is estimated to be around 10 min (e.g., Stull, 1988). Under near-neutral and stable conditions such efficient mixing throughout atmo-spheric column cannot be assumed. Instead the characteristic timescales of turbulent transfer within and above forests have been estimated by different approaches (e.g., Zelger et al., 1997; Rinne et al., 2000, 2012; Rannik et al., 2009b). Such timescales of turbulent transfer depend on the observation conditions but typically remain on the order from a few tens of seconds to a few hundreds of seconds. In spite of different definitions used and large variation range of the timescales characterizing the scalar transport between the observation level and the collecting surfaces within forest, the turbulent transfer can be expected to occur much faster than the aerosol dynamical processes.
The aerosol particle dry deposition is strongly size de-pendent as different mechanisms operate at different particle sizes. The timescale of dry deposition depends on particle size and exhibits its maximum at around 100 nm. For small particles with a few nanometers in diameter this dry depo-sition timescale can be orders of magnitudes smaller due to efficient removal mechanism by Brownian diffusion. At par-ticle sizes larger than 100 nm the parpar-ticle collection is again enhanced due to interception and inertial impaction mech-anisms (Petroff et al., 2008) and the respective timescale of dry deposition is smaller. In general, the dry deposition timescale has been frequently estimated to be in the same order of magnitude as the timescale for aerosol dynamics, leading to a conclusion that flux divergence may occur dur-ing transport due to aerosol dynamics (Pryor and Binkowski, 2004; Pryor et al., 2013).
The timescales of turbulent transfer and the timescale of dry deposition embed essentially different definitions and can lead also to different conclusions about the signifi-cance of aerosol dynamical terms during the transport be-tween the underlying surfaces and the measurement level. The timescale of turbulent transfer is the characteristic time of the transfer within turbulent air layer. Dry deposition in-cludes in addition the transport pathway within the laminar air layer surrounding the collecting surfaces. In the resis-tances framework (e.g., Monteith and Unsworth, 1990), the dry deposition includes the aerodynamic (corresponding to turbulent transport) as well as the leaf laminar sublayer resis-tances and under most conditions the dry deposition is
lim-ited by the laminar boundary layer transfer (e.g., Petroff and Zhang, 2010). Therefore comparison of the timescales of tur-bulent transport and dry deposition with that of aerosol dy-namics leads us to the assumptions that (i) turbulent trans-port within and above forest is relatively fast and no signif-icant transformation of aerosol population occurs within the respective timescale and (ii) depending on particle size the removal of aerosols via dry deposition occurs at the compara-ble timescale with aerosol dynamics and therefore the aerosol population can be modified during the removal process. Such modification occurs on hourly timescales and therefore is ex-pected to occur throughout the ABL, where aerosol dynami-cal processes can depend strongly on height within the ABL via vertical profiles of condensing vapors.
The purpose of this study is to analyze the magnitude of different terms in the particle number conservation equation and to evaluate the timescales of particle turbulent transfer, aerosol dynamical processes and dry deposition over a wide range of particle sizes. Further, we evaluate the effect of these terms on inferring particle deposition velocities from flux measurements by micrometeorological techniques, in partic-ular the influence on estimation of functional dependencies as well as systematic biasing effects. The study relies on the simulations by the model to Simulate the concentration of Organic vapors, Sulphuric Acid and Aerosols (SOSAA) and the measurements were used only to initialize the model (see Sect. 2.2 and Appendix B) or for evaluation of model out-puts in terms of predicted particle size distributions and me-teorological variables such as heat fluxes above canopy (see Sect. 3 below). Non-stationary conditions will be considered by simulating detailed ABL and aerosol dynamics inside and above the forest canopy during a period of 10 days, which includes highly dynamical conditions with new particle for-mation.
2 Materials and methods
The model was set up for a pine forest site in southern Fin-land and initialized with available measurements performed at the SMEAR II station. For description of the site and ini-tialization of the model see Appendices A and B, respec-tively. The analysis relies on evaluation of the significance of different terms of the particle conservation equation. 2.1 Conservation equation for aerosol size distribution In horizontally homogeneous conditions, when neglecting molecular diffusivity and applying the first-order closure to turbulent flux,
w′n′= −D t
∂n
∂z, (1)
the conservation equation for time-averaged particle number densityn=dlogdN
∂n ∂t +
∂ ∂z
−Dt(z) ∂n ∂z−wsn
= −a(z) vcn+Sad, (2)
whereNis the average particle number concentration,Dpthe particle diameter,Dtthe particle turbulent diffusivity,wsthe settling velocity,vc the particle collection velocity by vege-tation and a the all-sided leaf area density. The source/sink term Sad incorporates all aerosol dynamical terms, consist-ing of nucleation Snucl, condensational growth Scond and coagulation Scoag terms. If the condensational growth rate is considered asIcond(log10Dp)=dlogd10tDp, then the respec-tive source/sink term in Eq. (2) is expressed as Scond=
h
∂n ∂t
i
cond= − ∂(Icondn)
∂log10Dp. For particle size range up to a few
mi-crometersDtcan be assumed to be equal to the eddy viscos-ity of the flow. The settling velocviscos-itywsis given as
ws=
CcgρpD2p
18η , (3)
wheregis the acceleration due to the gravity,ηthe dynamic viscosity of air,ρpthe particle density andCcthe Cunning-ham slip correction factor (e.g., Hinds, 1982).
For the comparison of the significance of different terms of the conservation equation, the Eq. (2) was re-written so that the sum of all terms equaled 0, and the transport due to settling was merged with the particle collection by vegetation as −∂n ∂t + ∂ ∂z
Dt(z) ∂n ∂z (4) +
−a(z) vcn+ ∂
∂z(wsn)
+[Sad]=0,
where the terms were called the storage, (vertical) transport, particle deposition and aerosol dynamical terms. Further, in-tegration of Eq. (4) from the forest floor surface up to the canopy top h was used to define the change velocities in analogy to deposition velocity. The change velocity due to particle deposition was defined as
Vdep= 1
n(h)
h
Z
0
−a(z) vcn+ ∂
∂z(wsn)
dz (5)
and the change velocity due to aerosol dynamics as
Vad= 1
n(h)
h
Z
0
Saddz. (6)
In particular, for the transport term the respective change ve-locity was defined as
Vtransp= 1 n(h) h Z 0 ∂ ∂z
−w′n′dz (7)
= −w
′n′(h)−w′n′(0)
n(h) .
Note that in the modeling approach the vertical flux at the canopy top was obtained from the gradient diffusion approx-imation (Eq. 1) and the flux at the surface was defined by the ground deposition parameterization, which was applied as the sink term in the lowest model layer. Therefore in our model calculations w′n′(0)=0 and the transport velocity
equaled to the exchange velocity defined at the canopy top by
Ve= − F (h)
n(h). (8)
The timescales of the processes affecting the particle concen-tration inside the canopy were defined by
τ= h
V, (9)
with the change velocities Vdep, Vad and Ve defining the timescales for depositionτdep, aerosol dynamicsτadand ex-change τe, respectively. These timescales were calculated based on the numerical modeling results by SOSAA. 2.2 Simulation of aerosol transport and dynamics by
model SOSAA
The model SOSAA is a 1.5-order RANS (Reynolds-averaged Navier–Stokes) model SCADIS (SCAlar DIStribution, 1-D version; Sogachev et al., 2002, 2012) coupled with de-tailed biogenic emissions, chemistry and aerosol dynam-ics. SCADIS describes the exchange between the vegeta-tive canopy and atmosphere by considering the vegetation as a multi-layer medium and implementing parameterizations for radiation transfer, drag forces on leaves and stomatal conductance. The particle deposition processes in SOSAA are treated in the same manner as in the study by Lauros et al. (2011) based on the parameterization by Petroff et al. (2008). The parameterization considers Brownian diffu-sion and takes into account the influence of leaves on particle interception, impaction and settling. The model has been ap-plied extensively in different forest sites for various studies concerning biogenic emissions, chemistry and aerosol for-mation (e.g., Kúrten et al., 2011; Boy et al., 2013; Smolan-der et al., 2014; Mogensen et al., 2015; Zhou et al., 2015). Detailed model description is presented by Boy et al. (2011) and Zhou et al. (2014).
mechanism was employed in aerosol dynamics simulation (Weber et al., 1997; see also Sect. S2 in the Supplement). Zhou et al. (2014) presented the ability of SOSAA to recon-struct new particle formation events at Hyytiälä, which was the same site as in this study. The model was initialized with vertical profiles describing the initial atmospheric state (see Appendix B) and aerosol size spectrum observed at the sur-face and run for a 10-day time period similarly to Lauros et al. (2011). The aerosol size distribution was initialized each day at 00:00 LT based on the measurements at 2 m height. The first day the concentration profile was assumed constant (the same as at 2 m height) up to determined nighttime sta-ble boundary layer (SBL) height (320 m) and 10 % of the concentration values within the SBL above this level. Dur-ing the next days the concentration profile was taken con-stant as per measurements at 2 m level up to the maximum ABL height occurring during the previous day and 10 % of the within SBL values above that level. The initialization dur-ing the first day corresponded to the conditions of horizontal advection with very different properties of the air above the SBL, whereas during the other days the nighttime residual layer was assumed to retain the same properties as the SBL. The implications of these two contrasting assumptions for ABL mixing and vertical transport of aerosols will be dis-cussed in Sect. 3.4. For meteorology simulations 10 sec time step was used along with the explicit forward in time integra-tion method. The aerosol dynamics was simulated with 60 s time step.
2.3 Lagrangian estimation of turbulent transfer time The Lagrangian stochastic (LS) simulations were used to es-timate the turbulent transfer time. The conventional approach of using a LS model is to release particles at the surface point source and track their trajectories towards the point of inter-est forward in time (e.g., Wilson and Sawford, 1996). In case of horizontally homogeneous and stationary turbulence, the mean Lagrangian turbulent transfer time at the canopy top due to a sustained source located at height z0 (near forest floor) can be described as
τL(z)= 1 N
N
X
i=1
τi, (10)
where τi denotes the travel time of trajectoryi at the mo-ment of intersection with observation height. For LS mod-eling the turbulence statistics such as the turbulent kinetic energy (TKE) and the vertical eddy diffusivity obtained from SOSAA were used to define the turbulent profiles of the dis-sipation rate of TKE and variances of the wind speed com-ponents.
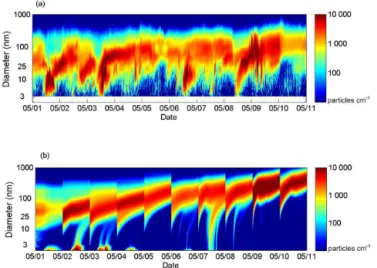
Figure 1.Aerosol size distribution at 2 m height during a 10-day pe-riod in May 2013 as(a)measured by the DMPS system and(b) pre-dicted by the model SOSAA.
3 Results
The selected time period consisted of 10 days in May 2013, days of year (DOYs) 121 (1 May) to 130 (10 May). On sev-eral days clear particle formation patterns were observed at the smallest particle sizes around midday, with subsequent growth to larger particle sizes (Fig. 1). In all days signifi-cant aerosol dynamics was taking place in terms of particle growth. The model simulations reproduced the observed par-ticle size distributions qualitatively; however, it was unable to reproduce the exact particle size distribution patterns. In par-ticular, during days with new particle formation the observed nucleation modes were not as clear; the particle growth was also overestimated, which can be observed clearly during the second half of the period. With respect to condensational growth of aerosols and resulting patterns of aerosol particle distributions a sensitivity analysis was performed (Fig. S2). The results of the sensitivity analysis are summarized in the end of Sect. 3.
Figure 2.General meteorology:(a)TKE and ABL height,(b)latent heat flux LE and(c)sensible heat fluxH during a 10-day period in May 2013. SMEAR refers to measurements at the station.
3.1 Aerosol dynamics and transport inside and above forest
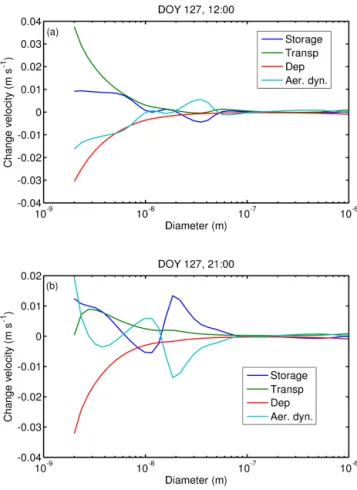
The particle conservation terms were evaluated inside the forest on 7 May (DOY 127) at 12:00 and 21:00 LT (UTC+2). At noon the particle size spectrum was bi-modal, with nucle-ation and larger particle modes, by evening the nuclenucle-ation mode had grown and almost merged into a single mode at around 200 nm (Fig. 3a). The rate of change by each term (as defined by the terms in Eq. 4) showed large particle sink due to deposition, which was compensated by the transport term at noon (Fig. 3b). The aerosol dynamical term was dominated by the condensational growth term, except at sizes smaller than a few tens of nanometers where coagulation was also important and at smallest sizes were particles due to nucle-ation appeared. The aerosol dynamics reduced the particle number of small particles less than about 10 nm in diameter, adding particle counts at larger sizes. The aerosol dynami-cal terms were reflected in relatively similar pattern in parti-cle storage change (defined by the first term of Eq. 4). The positive value of the storage term implies a decrease of
par-Figure 3. (a)Aerosol size distributions and the conservation terms on 7 May at(b)12:00 LT (the values for nucleation and condensa-tion terms at 2 nm are out of scale, being in absolute values about 1.3×10⁶particles m3s−1 but opposite in sign) and(c)21:00 LT as a function of particle size at 10 m height. The storage change (Change), (vertical) transport (Transp), particle deposition (Dep) and aerosol dynamical (Aer. Dyn.) terms are also used in Eq. (4). The aerosol dynamical term is the sum of the nucleation (Nucl), condensation growth (Cond) and coagulation (Coag) terms.
ticle concentration and a negative value an increase. In the evening at 21:00 LT the change rates of small particles (less than 20 nm) were small due to low particle counts in this part of the size spectrum (Fig. 3a). The similarity (in magnitude, but opposite in sign) of aerosol deposition vs. transport and aerosol dynamical vs. storage change terms held also in the evening, leading us to conclude that particle loss due to de-position was mainly compensated by vertical transport and aerosol dynamical processes modified the concentration in time.
Figure 4. Vertical profiles of aerosol (a) number concentration (particles m−3)and conservation terms: (b)storage change (par-ticles m−3s−1), (c) transport (in particles m−3s−1), (d) deposi-tion (in particles m−3s−1) and (e) aerosol dynamical (in parti-cles m−3s−1)on 7 May at 12:00 LT for particle size range from 2 nm to 1 µm.
When integrating the terms of the conservation equation (Eq. 4) from the surface up to the canopy top and normal-izing with the concentration at the canopy top, one obtains change velocities as defined in Sect. 2.1. Such change veloc-ities are comparable with the deposition velocity or the ex-change velocity, which can be experimentally obtained from the flux measurements above the canopy. In terms of change velocities the deposition velocity (defined by Eq. 5) and the transport velocity (defined by Eq. 7 and equivalent to the ex-change velocity in Eq. 8) appeared near symmetric for all particle sizes at noon (Fig. 5a). However, the correspondence was not exact, meaning that the flux defined at the canopy top did not correspond exactly to particle deposition. This was due to aerosol dynamics being responsible for additional sink inside the canopy for sizes up to 10 nm, creating con-centration decrease as well as additional downward particle transport to compensate for the loss. Much larger differences in the respective patterns were observed in the evening at 21:00 LT, especially at small particle sizes (Fig. 5b). This
im-Figure 5.Integrated up to the canopy top conservation equation (Eq. 4) terms for the same periods as in Fig. 3a and b, normalized with the concentration at the canopy top.
plied a more complex relationship between particle source sink/terms (deposition and aerosol dynamics) and vertical mixing.
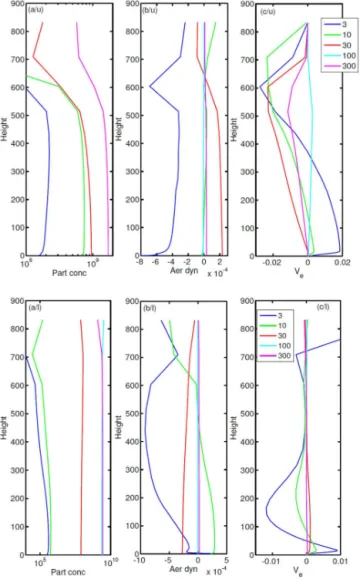
Figure 6. Vertical profiles of the (a)particle concentration (par-ticles m−3), (b) change rate due to aerosol dynamics (s−1), and (c)vertical exchange velocity defined to be positive for downward transport (m s−1)for selected particle sizes on 7 May at 12:00 LT (upper panels denoted by “/u”) and 21:00 LT (lower panels denoted by “/l”). For panels(b)and(c)normalization with local concentra-tions was used.
with the exchange velocities. In the evening, when the ver-tical transport was more limited due to moderately stable conditions (the Obukhov length defined by the fluxes at the canopy top beingL= +130 m), the vertical profiles showed
even more complex pattern (Fig. 6, lower panels). Particles with 3 and 10 nm in diameter were transported downward up to about 50–100 m height (to compensate for the loss in-side the canopy), whereas above these heights up to about 500 m upward flux occurred to compensate for aerosol dy-namical loss in the higher part of the atmospheric column. Note, however, that the concentration of small particles was very low in the evening (Fig. 6a/l). The larger particle sizes (300 nm) were little affected by the aerosol dynamics in the evening and downward transport occurred (in contrast to
noon). Figure 6 illustrates complex dynamics between the aerosol sources and sinks and transport in the atmospheric column, leading to aerosol dynamical term and vertical ex-change that can differ in sign as a function of height for a certain particle size (for example for 10 nm particles at 12:00 and 21:00 LT).
3.2 Timescales of processes
The importance of aerosol dynamics for particle exchange measurements has been frequently assessed by comparing the timescales of aerosol dynamical and transport processes. Figure 7 presents the timescales defined in Sect. 2.1 and com-pares those with the Lagrangian turbulent transfer timescale determined according to Sect. 2.3. The time of turbulent transfer within forest (simulated as the time for an air par-cel to travel between the surface and the forest height) was mostly much shorter than the timescales of deposition and aerosol dynamics. Only at smallest particle sizes and stable conditions did the turbulent timescale become comparable to the timescales of particle deposition and aerosol dynam-ics (Fig. 7b). The transport timescale, defined by Eqs. (9) and (7), accounts also for the effect of sources and sinks in-side the canopy and is therefore very different from the tur-bulent transfer timescaleτL. The transport timescale was de-termined mainly by deposition and modified by the impact of aerosol dynamics, reflecting the fact that particle vertical transport is mostly controlled by the sources and sinks and not limited by turbulent transfer speed.
The timescale of particle deposition strongly depended on particle size (resulting of respective dependence of par-ticle collection on parpar-ticle size), whereas the timescale of aerosol dynamics was occasionally shorter than the deposi-tion timescale (even an order of magnitude, depending on particle size). Even though the turbulent transfer timescale
τL was much shorter than the other timescales, the flux at the canopy top deviated from the deposition to vegetation elements (can be inferred from the comparison of the de-position and the transport timescales). Note that even the sign of the flux at the canopy top differed for particles of about 100–300 nm in diameter; see the sign of the transport timescale in Fig. 7a. Although very short turbulent transfer time would suggest fast and efficient mixing (and therefore correspondence of flux to deposition), the difference can be explained by the importance of the aerosol dynamics which affect the concentrations throughout the atmospheric column and therefore drive the vertical redistribution of particles via vertical transport.
Figure 7.The timescales of deposition, aerosol dynamics and trans-port (equivalent to vertical exchange) as defined by Eq. (9) together with Eqs. (5), (6) and (7) at(a)12:00 LT (the values for the trans-port term are out of scale at about 200 and 450 nm, being about +3.7×10⁶and−1.05×10⁶s, respectively) and (b)21:00 LT on 7 May 2013. In addition the Lagrangian timescale for turbulent transfer (corresponding to aerodynamic resistance only) as simu-lated according to Eq. (10), is presented as the median air parcel travel time between the forest floor and the canopy top with upper and lower quartiles. The “+” sign reflects the positive sign of the re-spective term (the source), whereas no such sign infers the negative (sink) term.
fluxes. Figure 8 compares the change velocities defined in Sect. 2.1 to the respective deposition change velocities dur-ing the first day of the simulations, 1 May (DOY 121), and the following nucleation day, 2 May 2013 (DOY 122). These two days differ in terms of initialization of vertical aerosol profiles at midnight (see Sect. 2.2). During the first day the aerosol dynamics barely affected the particle concentrations inside the forest, but 100 and 300 nm sizes were affected strongly by vertical transport occurring during the mixed layer (ML) growth period prior to noon. The initial concen-tration profile during this day corresponded to the conditions of horizontal advection. During the second day the aerosol dynamical term exceeded the deposition term several times (Fig. 8c). The storage change varied in approximately the
Figure 8. (a)Particle size spectrum and the change velocities (pre-sented as the ratios to the absolute value of the deposition term) for selected particle sizes for(b)storage,(c)aerosol dynamics and (d)vertical exchange during 1 and 2 May (DOY 121 and 122) 2013.
ex-change velocity. Therefore the relatively large downward flux during the second day (DOY 122) was mainly driven by the aerosol dynamics occurring at night, whereas the growth of the ML initiated strong vertical mixing.
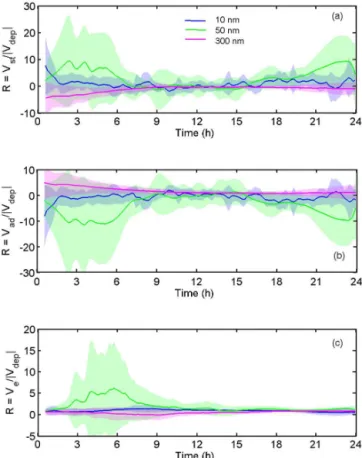
In order to understand overall trends and variability in aerosol dynamics and transport, the diurnal patterns of the averages together with the range of variation were presented in Fig. 9 for three particle sizes characterizing the nucleation (10 nm), Aitken (50 nm) and accumulation (300 nm) modes. For 50 nm particles the aerosol dynamics were a sink at night, whereas the condensational growth served as the source of 300 nm particles round the clock. The variation range of the aerosol dynamical term can be very large, indicating the role of ABL development during different days. Whereas the vari-ation range of the aerosol dynamics and storage was large generally at night, the vertical exchange deviated from de-position mainly during the early morning SBL and further ABL growth period until noon (Fig. 9c). During this period the 50 nm particle fluxes were larger than induced by depo-sition, and during the ABL growth the 300 nm particle fluxes were lower than would have corresponded to deposition on average.
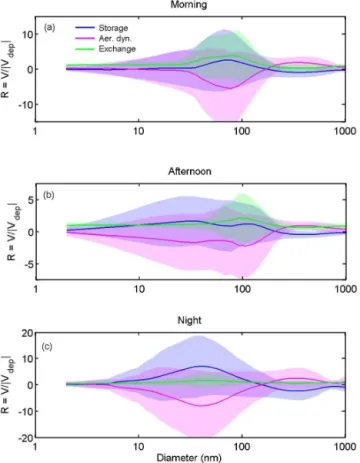
We further looked how different particle sizes were af-fected during different stages of the ABL state. At night the aerosol dynamics affected a wide range of particles and on average performed as the sink for particles less than 100 nm and the source for larger particles (Fig. 10c). The aerosol dynamical sink/source led primarily to particle concentra-tion change. During the morning hours from sunrise until noon the ABL growth induced enhanced downward trans-port of about 30–200 nm particles, whereas vertical down-ward transport of larger particles was less than deposition sink (Fig. 10a). During the afternoon all the change veloci-ties exhibited less variation compared to morning and night hours. Consequently deposition was also the best represented by the averages fluxes at the canopy top in the afternoon, with biggest deviation coinciding with the minimum in deposition velocity at around 100 nm (Fig. 10b). Figures 8, 9 and 10 (see also Fig. S3) illustrate that both the aerosol dynamics and ABL growth can strongly affect the vertical transport of aerosols and the fluxes above the canopy can deviate signifi-cantly from the deposition occurring within the canopy.
Due to instrumental limitations or by intention (frequently to obtain statistically significant particle counts in order to reduce particle flux random errors), a certain size interval of particles is measured. Figure 11 presents the vertical ex-change velocity size-integrated values to represent the nu-cleation (3–30 nm), Aitken (30–100 nm) and accumulation (100–1000 nm) mode particles. During the first day with as-sumed conditions of horizontal advection the size-integrated particle fluxes showed clear upward transport during the morning hours for 30–100 and 100–1000 nm size ranges. The same has also been observed from the measurements and in-terpreted as the upward transport due to ABL growth and resulting dilution of relatively particle-rich air within forest
Figure 9. Diurnal variation of change velocity for (a) storage, (b)aerosol dynamics and(c)vertical exchange for selected particle sizes. The lines present the ratios of the average change velocities to the average deposition term according to hVi
Vdep
obtained from model simulations for each 10 min period and the shaded areas the variation range as± σV
Vdep
around the averages.
with the particle-poor air transported down from aloft (e.g., Nilsson et al., 2001). The days with very large (both positive and negative) values of the exchange velocities compared to deposition velocities corresponded to the days with preced-ing very low ABL heights at nights (DOY 127, 129, 130). Therefore the ABL development can be identified as one of the main reasons for the large variation in vertical transport of particles. In case of experimental flux measurements the statistical uncertainty as well as natural variation originating from spatial heterogeneity and horizontal advection can ad-ditionally contribute to the variance of the calculated fluxes, leading to flux patterns with large variation, that are often difficult to interpret.
devia-Table 1.Statistics of the ratio of the flux at the canopy top to deposition sink integrated over the canopy over a 10-day period in May 2013. The average statisticshVeiand
Vdep
were averaged over the simulation period first and then the ratio was found, whereas the percentile statistics apply for the ratios Ve
Vdep
obtained from model simulations for each 10 min period.
Particle size (nm) 3 10 30 100 300 850 3–30 30–100 100–1000
hVei
Vdep
0.90 0.99 1.36 2.09 0.53 0.82 1.11 1.99 0.66 Q5 −0.24 −0.18 −0.32 0.15 −1.30 0.20 0.33 0.70 −0.76
Q25 0.77 0.87 0.93 0.82 0.32 0.73 0.97 0.95 0.56
Median 0.97 1.00 1.06 0.94 0.85 0.92 1.06 1.04 0.86
Q75 1.15 1.09 1.31 1.34 0.92 0.96 1.20 1.57 0.92
Q95 1.81 1.70 3.36 9.59 1.01 1.00 2.12 10.5 0.98
Table 2.Statistics of the ratio of the flux at the canopy top to deposition sink integrated over the canopy over a 10-day period in May 2013. For more details see Table 1. Morning refers to the time period from sunrise until noon, afternoon from noon until sunset and night from sunset until sunrise.
Time Morning Afternoon Night
Particle size (nm) 3–30 30–100 100–1000 3–30 30–100 100–1000 3–30 30–100 100–1000
hVei
Vdep
1.25 2.92 0.48 1.12 1.67 0.73 0.84 1.19 0.81
Q5 0.68 0.20 −1.36 0.77 0.70 0.07 −0.27 0.87 −0.16
Q25 1.04 0.94 0.33 0.97 0.94 0.56 0.92 0.96 0.77
Median 1.17 1.17 0.84 1.03 1.03 0.84 1.03 1.01 0.86
Q75 1.46 2.96 0.91 1.13 1.40 0.91 1.11 1.17 0.93
Q95 2.21 29.6 0.98 1.69 7.21 0.99 3.85 3.04 0.96
tions of the particle fluxes from dry deposition sink occurred during the morning period when most intensive aerosol dy-namics and ABL development took place (Table 2). Consis-tently with Fig. 10b at that time 30–100 nm downward parti-cle fluxes exceeded dry deposition and in the size range 100– 1000 nm the downward fluxes accounted for approximately half of the deposition sink.
Finally, we performed sensitivity analysis of our simula-tions with respect to saturation concentration of condensing vapors, which affects the condensational growth of aerosols. Two additional cases with low-saturation vapor concentra-tion (equivalent to more condensaconcentra-tion) and high-saturaconcentra-tion vapor concentration (equivalent to less condensation) were tested (Sect. S2). Whereas the high-saturation vapor concen-tration case led to less apparent nucleation mode in the parti-cle size spectrum, the low-saturation vapor concentration led to more pronounced and clear particle growth patterns dur-ing the nucleation days (Fig. S2). The storage change, aerosol dynamics and exchange velocities were studied for given sce-narios (Figs. S3–S5). The main difference observed was that in case of high-saturation vapor concentration due to slower growth of particles, the effect of aerosol dynamics persisted longer in the morning and affected the Aitken mode parti-cles as represented by 50 nm (Fig. S4c) along with similar impact on exchange velocity that overestimated dry deposi-tion for given particle size (Fig. S5c). However, as revealed
by the sensitivity analysis of different scenarios, the overall qualitative behavior was not significantly different.
3.4 Discussion of results
3.4.1 Aerosol dynamics and deposition
Figure 10. Variation of change velocities with particle size for (a)morning (from sunrise until noon), (b) afternoon (from noon until sunset) and(c) night (sun below horizon) periods: the blue line indicates the storage, magenta the aerosol dynamics and green the vertical exchange velocities. The lines present the ratios of the average change velocities to the average deposition term according to hVi
Vdep
obtained from model simulations for each 10 min period and the shaded areas are the variation range as± σV
Vdep
around the averages.
Figure 11.The exchange velocityVeat the canopy top for selected particle size intervals during a 10-day period in May 2013 normal-ized with the absolute value of the deposition velocity|Vdep|. Peak values for the size range 30–100 nm at DOYs 129 and 130 were about 30–35.
The timescales of turbulent transfer and vertical trans-port were determined to be essentially different. The verti-cal transport of aerosols was limited by the deposition and aerosol dynamical processes and only at stable conditions
could the turbulent transfer become limiting to vertical trans-port of particles. The turbulent transfer timescales estimated in the current study by using the LS trajectory simulations were on the order of minutes during the daytime and could be up to a few tens of minutes under SBL conditions. Some other definitions of the timescales have been used in the anal-ysis of the significance of chemical transformation of reac-tive scalars during transport pathway between the measure-ment level and sources or sinks located primarily at leaf sur-face. Rinne et al. (2000, 2012) used the ratio of the obser-vation height to the friction velocity as the estimate for the mixing timescale. Zelger et al. (1997) used the definitions of Eulerian and Lagrangian turbulent timescales to character-ize the turbulent transfer within and above forest. Holzinger et al. (2005) instead used the estimate of the residence time and obtained the value about 1.5 min for daytime condi-tions. The Lagrangian turbulent transfer times obtained in this study were consistent with the previous studies including the timescales obtained by the same approach by Rannik et al. (2009b).
3.4.2 Dynamics within ABL
The timescales of aerosol deposition and dynamics are much longer than the turbulent transfer times within the forest canopy. Therefore, one would expect a minor impact of aerosol dynamics on particle population during the vertical transfer within forest under most of the observation condi-tions and a relatively good vertical mixing of aerosols within and above forest. Nevertheless, we have seen in the current study that the vertical fluxes at the canopy top can deviate significantly from what would be expected from dry deposi-tion only. From current model simuladeposi-tions we have seen that the aerosol dynamics is an important mechanism of aerosol transformation throughout the ABL, whereas the aerosol de-position occurs only inside the forest canopy. In addition, the impact of aerosol dynamics is height dependent. Within the canopy the emissions of the precursor gases for particle con-densational growth (the volatile organic compounds) occur. The dominant condensing compounds are the OH oxidation products of monoterpenes, which form during the transport pathway from inside the forest to higher levels in the ABL. The concentrations of the condensing compounds are there-fore larger within and immediately above the canopy and de-crease with height. Such height dependence of the conden-sational growth of particles can lead to modification of con-centration gradient and vertical flux profile. Even though the atmospheric mixing is fast compared to the above-discussed processes, we believe it is the extensive source/sink term by aerosol dynamics that operates throughout the atmospheric column (compared to the impact of deposition inside the canopy only) and can thus create significant vertical flux di-vergence and even upward particle transport.
stor-age term and commonly accounted for in estimation of the net ecosystem exchange of carbon dioxide from the EC flux measurements (e.g., Foken et al., 2012). Such an approach inherently assumes that the storage change results from the source/sink activity below the observation level. Rannik et al. (2009a) studied the relevance of the storage term in es-timation of the dry deposition from particle flux measure-ments. They concluded that in the case of aerosol particles the relevance of the storage term could not be established be-cause of the different physical reasons for the concentration change during different phases of diurnal development of the ABL. This study supports the conclusion with the observa-tion that the particle concentraobserva-tion change is primarily in correlation with the aerosol dynamics and the change occurs throughout the ABL. Therefore the particle storage change (which corresponds to accumulation or depletion) is not in general the sole component of the particle conservation equa-tion that could help to improve particle deposiequa-tion estimaequa-tion from the flux measurements carried out above forest. 3.4.3 Upward particle fluxes
Particle fluxes determined by the micrometeorological tech-niques show typically large variability in magnitude as well as in sign. Occurrence of upward particle fluxes has been fre-quently reported in the literature (Pryor et al., 2007; Grön-holm et al., 2007; Whitehead et al., 2010; Pryor et al., 2013). Even after careful classification of observations according to wind direction in order to remove the cases possibly af-fected by anthropogenic emissions, flux observation analyses by Pryor et al. (2008) revealed significant fraction of obser-vations indicating emission. The upward particle flux values can be the result of large random uncertainty or caused by upward particle transport due to physical processes. Random flux errors of particle fluxes are due to stochastic nature of turbulence, instrumental noise and (limited) counting statis-tics of aerosol particles. The major source of the random un-certainty of particle flux estimates is the non-stationarity of particle concentration as well as its flux (for flux random un-certainties see Fairall, 1984). The particle fluxes have typi-cally large statistical uncertainty, on the order of 100 % and more (Pryor et al., 2008; Rannik et al., 2003); therefore, it is frequently difficult to determine whether the calculated up-ward particle occurrence reflects the true transport or was ob-tained by chance. Pryor et al. (2008) investigated thoroughly the distribution and significance of upward fluxes as well as the relevance of several physical mechanisms that cause them by taking into account the error estimates of fluxes. They came to the conclusion that several possible physical mecha-nisms were responsible for upward particle transport includ-ing the entrainment of particle-free air from above durinclud-ing the intensive ABL growth periods. Whitehead et al. (2010) ob-served similar systematic pattern over a tropical rainforest in case of supermicron particles. Upward particle fluxes were also observed on seasonal average diurnal patterns by
Ran-nik et al. (2009a) in the statistical analysis of long-term parti-cle flux measurements over a pine forest, confirming that the phenomenon is common over a long period of time.
Nilsson et al. (2001) also associated the occurrence of up-ward particle fluxes to the solar radiation increase and bound-ary layer development. In addition, they studied the evolution of the Aitken and accumulation mode particle concentrations in the ML during the ABL growth and inferred the particle concentrations being entrained by using a simple ML growth model based on thermodynamical considerations. The model explained well the ML height as well as the particle concen-tration evolution. The entrained particle concenconcen-trations were determined to be virtually from 0 to 40 % of the close-to-surface values, indicating that nighttime horizontal advection was a dominating process at the site affecting the vertical profiles of aerosols above the SBL. The initialization of the aerosol concentration profiles during the first day of simu-lations in the current study represent such advective condi-tions and resulted in strong upward particle transport during the early morning ML growth. Whereas the nighttime advec-tion can be typical to SMEAR II site, it is certainly a site-specific phenomenon and therefore for the rest of the period we intended to use the initialization of profiles with uniform particle concentration up to the residual layer height. There-fore our simulation results for the first day represent the con-ditions characteristic to strong horizontal advection and are during the rest of the days expected to underestimate the ver-tical transport due to ML growth.
Gordon et al. (2011) observed major fraction (60 %) of upward particle fluxes for size interval 18–450 nm above a mixed forest in Ontario, Canada, using the EC technique. The upward particle flux rate was highest for 75 nm particles. One of the mechanisms for upward fluxes was the entrainment of clean air from aloft as discussed previously. As an additional mechanism, the authors proposed the slowest growth rate of this particle size, suggesting that the authors referred to the aerosol dynamics as one of the reasons.
3.4.4 Fluxes of above 100 nm particles
Our results have shown that the aerosol and ABL dynam-ics can introduce significant systematic deviation of the ex-change velocities above the canopy from dry deposition on the average. For around 100 nm particles the fluxes above the canopy exceeded the dry deposition sink and for larger than 100 nm the deposition was poorly characterized by the fluxes above the canopy (see Table 1). The range of the flux to deposition ratio varied from negative to positive values, be-ing especially large for particles about 100 nm, which coin-cides with the minimum of the particle deposition rate at this size. The median values presented in Table 1 were closer to unity than the averages. This implies that the averages are af-fected by extreme values corresponding to certain dynamical conditions occurring in the ABL. Such conditions certainly can take place in the real atmosphere. The fact that the me-dian exchange velocities represent better deposition than the time average indicates that the median values are more ro-bust statistics than the averages and should be perhaps used in representing the particle exchange instead of averages.
We note that the results based on model simulations were free of statistical uncertainty introduced by random errors to experimentally determined fluxes. Rannik et al. (2003) used a semi-empirical model to explain the size-integrated parti-cle flux measurements performed at the same site with our model simulations. The model appeared to explain well the flux observation with particle population mainly consisting of below 100 nm particles. Deposition velocities for above 100 nm sizes were very uncertain. The authors proposed sev-eral reasons why the model was not able to explain the obser-vations: presence of a mechanism controlling deposition of above 100 nm particles not described by the semi-empirical model as well as several other reasons such as temporary pol-lution sources in the measurement source area. The possible reasons of meteorological origin were suggested to be hor-izontal advection of particle concentration, boundary layer growth and concentration dilution, and roll circulation in the ABL (e.g., Buzorius et al., 2001). This study has shown that such apparent uncertainty in deposition pattern of above 100 nm particles could be the case even in horizontally ho-mogeneous conditions due to aerosol dynamical and ABL development processes.
4 Conclusions
Simulations performed by the model SOSAA coupling turbulent exchange within the ABL with detailed atmo-spheric chemistry and aerosol dynamics indicated that the aerosol dynamics is strongly size dependent but a signifi-cant source/sink term to aerosol concentration throughout the atmospheric column. Whereas the vertical transport mostly compensates for particle loss inside the canopy due to the deposition, the aerosol dynamics leads to the concentration changes in the whole ABL. However, during the periods of intensive aerosol dynamics when new particle formation fre-quently occurs, the particle deposition and aerosol dynamics together with ABL development leads to complicated verti-cal transport patterns. For small particles (up to a few tens of nanometers) the deposition sink is relatively strong (com-pared to the aerosol dynamics) and the downward fluxes were predicted in the lower ABL. However, for some particle size ranges, depending on the aerosol dynamical processes, the stronger aerosol dynamical source inside and above forest (compared to higher ABL) can lead to upward particle trans-port such that the vertical fluxes above the canopy might not be coherent with dry deposition under such conditions. We have also observed that the ABL dynamics occasionally lead to upward particle transport which can be interpreted as the transport due to dilution of relatively particle-rich air within forest with the particle-poor air transported down from aloft during the active ABL growth phase.
The simulated turbulent transfer timescales inside the for-est were much shorter than the timescales of deposition and aerosol dynamics for all sizes except the smallest at around 3 nm. In spite of efficient mixing inside the canopy, the par-ticle fluxes at the canopy top can deviate from the deposi-tion rates inside forest. This is due to the transformadeposi-tion of aerosol concentration throughout the atmospheric column re-sulting in the complicated pattern of particle vertical trans-port. Therefore, the within-canopy deposition and transfor-mation processes do not determine solely the particle verti-cal transport within and above the canopy and the respective timescales are not sufficient to determine whether the aerosol dynamics can cause significant particle flux divergence be-low the measurement level.
Appendix A: Description of measurements at SMEAR II
The SMEAR II (Station for Measuring Forest Ecosystem-Atmosphere Relations) field measurement station is lo-cated in Hyytiälä, Southern Finland (61◦51′N, 24◦17′E;
181 m a.s.l.). The station is located in the area covered mainly by pine-dominated forests. The dominant height of the stand near the measurement tower was about 20 m in 2013. The main canopy at the site is characterized by the total leaf area index (LAI)∼6.5 m2m−2and stand density 1400 ha−1 (Launiainen et al., 2011). The forest floor vegetation is rela-tively low (mean height∼0.2–0.3 m) but dense (total LAI∼
1.5 m2m−2). However, in model setup a beta distribution of
LAD was used that matched to observed turbulence statistics in and above the canopy and the forest floor vegetation as a separate layer was neglected (Boy et al., 2011). A more de-tailed description of the station and the measurements can be found in Hari and Kulmala (2005).
Turbulent fluxes of momentum, heat, CO2and H2O were measured by means of the EC technique. The system, located at 23 m height above the ground on the top of a scaffolding tower, included an ultrasonic anemometer (Solent Research HS1199, Gill Ltd., Lymington, Hampshire, England) to mea-sure the three wind velocity components and the sonic tem-perature, a closed-path infrared gas analyzer (LI-6262, LiCor Inc., Lincoln, NE, USA) that measured the CO2 and H2O concentrations. The data were sampled at 21 Hz, and a 2-D rotation of sonic anemometer wind components and filter-ing to eliminate spikes were performed accordfilter-ing to standard methods (e.g., Aubinet et al., 2000). The high-frequency flux attenuation was corrected by using empirical transfer func-tions and co-spectral transfer characteristics (Mammarella et al., 2009).
Aerosol size distribution (from 3 nm to 1 µm) measure-ments were performed using a differential mobility particle sizer (DMPS) system. The aerosol was sampled from inside the forest at 2 m height. Details of the DMPS measurement system are presented in Aalto et al. (2001).
Appendix B: Initialization of model SOSAA
The chemistry scheme employed by the model for this study included the relevant Master Chemical Mechanism (MCM) chemical paths (Jenkins et al., 1997, 2003; Saun-ders et al., 2003) for the following parent molecules: methane, methanol, formaldehyde, acetone, acetaldehyde, MBO, isoprene, α-pinene, β-pinene, limonene and beta-caryophyllene. For other emitted organic compounds in-cluding myrcene, sabinene, 3-carene, ocimene, cineole and “other” monoterpenes, and farnesene and “other” sesquiter-penes, the MCM chemistry paths are not available and we thus included their first-order oxidations with OH, O3 and NO3. For the reactions of the stabilized Criegee intermedi-ates (sCI) fromα- andβ-pinene and limonene, we used the
rates from Mauldin III et al. (2012), similar to “Scenario C” in Boy et al. (2013). For the sCI from isoprene, we used the rates from Welz et al. (2012) as done in “Scenario D” in Boy et al. (2013). Sulfuric acid and nitric acid were re-moved from the gas phase based on the condensation sinks calculated from background aerosol loading.
There was no specific initialization of chemistry state for the model (all variables were initialized as 0 while created). Exceptions were the passive tracer concentrations (CO2, NO, NO2, SO2 and O3), which were initialized with measure-ments. The concentrations of these five passive tracers were always read in from measurements during the simulation. The time resolution of input data was half an hour and the data were linearly interpolated for each time step in the model run. The vertical profiles of the particle concentrations were initialized each night as described in Sect. 2.2.
Global short-wave radiation, top boundary temperature, humidity and wind speed were fixed to inputs throughout simulation. The global short-wave radiation was measured at SMEAR II. Temperature, humidity and wind speed at the top boundary were based on ECMWF reanalysis data.
The initial temperature profile was assumed linear, using the input top border temperature and input temperature gradi-ent. The wind profile was set using the logarithmic wind law, the roughness and wind speed at the top boundary. Initial hu-midity was taken constant throughout the ABL and the heat fluxes and TKE were set to 0. Mixing length was initialized asl=0.40 z+z0
1+0.016z.
At the lower boundary, soil humidity for the uppermost layer was set to 0.2 kg kg−1. Soil temperature was set to−2◦
The Supplement related to this article is available online at doi:10.5194/acp-16-3145-2016-supplement.
Acknowledgements. This work was supported by the Academy of Finland (project No. 118780 and 127456). ICOS (271878), ICOS-Finland (281255) and ICOS-ERIC (281250), and Nordic Center of Excellence, CRAICC, are gratefully acknowledged for funding this work. This work was also supported by institutional research funding (IUT20-11) of the Estonian Ministry of Education and Research. We further thank Helsinki University Centre for Environment (HENVI) and the Academy of Finland Centre of Excellence program (project no. 1118615). The CSC-IT center, Finland, is acknowledged for providing the computing service.
Edited by: R. MacKenzie
References
Aalto, P., Hämeri, K., Becker, E., Weber, R., Salm, J., Mäkelä, J. M., Hoell, C., O’Dowd, C. D., Karlsson, H., Hansson, H.-C., Väkevä, M., Koponen, I. K., Buzorius, G., and Kulmala, M.: Physical characterization of aerosol particles during nucleation events, Tellus, 53B, 344–358, 2001.
Aubinet, M., Grelle, A., Ibrom, A., Rannik, Ü., Moncrieff, J., Fo-ken T., Kowalski, A. S., Martin, P. H., Berbigier, P., Bernhofer, Ch., Clement, R., Elbers, J., Granier, A., Grünwald, T., Morgen-stern, K., Pilegaard, K., Rebmann, C., Snijders, W., Valentini, R., and Vesala, T.: Estimates of the annual net carbon and water ex-change of European forests: the EUROFLUX methodology, Adv. Ecol. Res., 30, 113–175, 2000.
Boy, M., Sogachev, A., Lauros, J., Zhou, L., Guenther, A., and Smolander, S.: SOSA – a new model to simulate the concen-trations of organic vapours and sulphuric acid inside the ABL – Part 1: Model description and initial evaluation, Atmos. Chem. Phys., 11, 43–51, doi:10.5194/acp-11-43-2011, 2011.
Boy, M., Mogensen, D., Smolander, S., Zhou, L., Nieminen, T., Paa-sonen, P., Plass-Dülmer, C., Sipilä, M., Petäjä, T., Mauldin, L., Berresheim, H., and Kulmala, M.: Oxidation of SO2 by stabi-lized Criegee intermediate (sCI) radicals as a crucial source for atmospheric sulfuric acid concentrations, Atmos. Chem. Phys., 13, 3865–3879, doi:10.5194/acp-13-3865-2013, 2013.
Buzorius, G., Rannik, Ü., Nilsson, D., and Kulmala, M.: Vertical fluxes and micrometeorology during aerosol particle formation events, Tellus B, 53, 394–405, 2001.
Fairall, C. W.: Interpretation of eddy-correlation measurements of particulate deposition and aerosol flux, Atmos. Environ., 18, 1329–1337, 1984.
Foken, T., Aubinet, M., and Leuning, R.: The Eddy Covariance Method, in: Eddy Covariance – A Practical Guide to Measure-ment and Data Analysis, edited by: Aubinet, M., Vesala, T., and Papale, D., Springer, doi:10.1007/978-94-007-2351-1, 2012. Gordon, M., Staebler, R. M., Liggio, J., Vlasenko, A., Li, S.-M.,
and Hayden, K.: Aerosol flux measurements above a mixed for-est at Borden, Ontario, Atmos. Chem. Phys., 11, 6773–6786, doi:10.5194/acp-11-6773-2011, 2011.
Grönholm, T., Aalto, P. P., Hiltunen, V., Rannik, Ü., Rinne, J., Laakso, L., Hyvönen, S., Vesala, T., and Kulmala, M.: Mea-surements of aerosol particle dry deposition velocity using the relaxed eddy accumulation technique, Tellus B, 59, 381–386, doi:10.1111/j.1600-0889.2007.00268.x, 2007.
Hari, P. and Kulmala, M.: Station for measuring ecosystem-atmosphere relations (SMEAR II), Boreal Environment Res., 10, 315–322, 2005.
Hinds, W. C.: Aerosol Technology: Properties, Behavior, and Mea-surement of Airborne Particles, John Wiley and Sons, New York, 1982.
Holzinger, R., Lee, A., Paw, K. T., and Goldstein, U. A. H.: Ob-servations of oxidation products above a forest imply biogenic emissions of very reactive compounds, Atmos. Chem. Phys., 5, 67–75, doi:10.5194/acp-5-67-2005, 2005.
Jenkin, M. E., Saunders, S. M., and Pilling, M. J.: The tropospheric degradation of volatile organic compounds: a protocol for mech-anism development, Atmos. Environ., 31, 81–104, 1997. Jenkin, M. E., Saunders, S. M., Wagner, V., and Pilling, M. J.:
Protocol for the development of the Master Chemical Mecha-nism, MCM v3 (Part B): tropospheric degradation of aromatic volatile organic compounds, Atmos. Chem. Phys., 3, 181–193, doi:10.5194/acp-3-181-2003, 2003.
Kurtén, T., Zhou, L., Makkonen, R., Merikanto, J., Räisänen, P., Boy, M., Richards, N., Rap, A., Smolander, S., Sogachev, A., Guenther, A., Mann, G. W., Carslaw, K., and Kulmala, M.: Large methane releases lead to strong aerosol forcing and reduced cloudiness, Atmos. Chem. Phys., 11, 6961–6969, doi:10.5194/acp-11-6961-2011, 2011.
Launiainen, S., Katul, G. G., Kolari, P., Vesala, T., Hari, P.: Em-pirical and optimal stomatal controls on leaf and ecosystem level CO2and H2O exchange rates, Agr. Forest Meteorol., 151, 1672– 1689, doi:10.1016/j.agrformet.2011.07.001, 2011.
Lauros, J., Sogachev, A., Smolander, S., Vuollekoski, H., Sihto, S.-L., Mammarella, I., Laakso, S.-L., Rannik, Ü., and Boy, M.: Particle concentration and flux dynamics in the atmospheric boundary layer as the indicator of formation mechanism, Atmos. Chem. Phys., 11, 5591–5601, doi:10.5194/acp-11-5591-2011, 2011. Mammarella, I., Launiainen, S., Gronholm, T., Keronen, P.,
Pumpa-nen, J., Rannik, Ü., and Vesala, T.: Relative humidity effect on the high frequency attenuation of water vapour flux measured by a closed-path eddy covariance system, J. Atmos. Ocean. Tech., 26, 1856–1866, 2009.
Mauldin III, R. L., Berndt, T., Sipilä, M., Paasonen, P., Petäjä, T., Kim, S., Kurtén, T., Stratmann, F., Kerminen, V.-M., and Kul-mala, M.: A new atmospherically relevant oxidant, Nature, 488, 193–196, doi:10.1038/nature11278, 2012.
Mogensen, D., Gierens, R., Crowley, J. N., Keronen, P., Smolan-der, S., Sogachev, A., Nölscher, A. C., Zhou, L., Kulmala, M., Tang, M. J., Williams, J., and Boy, M.: Simulations of atmo-spheric OH, O3and NO3reactivities within and above the boreal forest, Atmos. Chem. Phys., 15, 3909–3932, doi:10.5194/acp-15-3909-2015, 2015.
Monteith, J. L. and Unsworth, M. H.: Principles of Environmental Physics, Edward Arnold, London, 1990.
Petroff, A. and Zhang, L.: Development and validation of a size-resolved particle dry deposition scheme for application in aerosol transport models, Geosci. Model Dev., 3, 753–769, doi:10.5194/gmd-3-753-2010, 2010.
Petroff, A., Mailliat, A., Amielh, M., and Anselmet, F.: Aerosol dry deposition on vegetative canopies. Part II: A new modelling ap-proach and applications, Atmos. Environ., 42, 3654–3683, 2008. Pryor, S. C. and Binkowski, F. S.: An analysis of the time scales as-sociated with aerosol processes during dry deposition, Aerosol Sci. Tech., 38, 1091–1098, doi:10.1080/027868290885827, 2004.
Pryor, S. C., Larsen, S. E., Sørensen, L. L., Barthelmie, R. J., Grönholm, T., Kulmala, M., Launiainen, S., Rannik, Ü., and Vesala, T.: Particle fluxes over forests: analyses of flux meth-ods and functional dependencies, J. Geophys Res., 112, D07205, doi:10.1029/2006JD008066, 2007.
Pryor, S. C., Barthelmie, R. J., Sørense, L. L., Larsen, S. E., Sem-previva, A. M., Grönholm, T., Rannik, Ü., Kulmala, M., and Vesala, T.: Upward fluxes of particles over forests: when, where, why?, Tellus B, 60, 372–380, 2008.
Pryor, S. C., Barthelmie, R. J., and Hornsby, K. E.: Size-resolved particle fluxes and vertical gradients over and in a sparse pine forest, Aerosol Sci. Tech., 47, 1248–1257, doi:10.1080/02786826.2013.831974, 2013.
Rannik, Ü., Aalto, P., Keronen, P., Vesala, T., and Kulmala, M.: Interpretation of aerosol particle fluxes over a pine forest: dry deposition and random errors, J. Geophys Res., 108, AAC 3.1– AAC3.11, 2003.
Rannik, Ü., Mammarella, I., Aalto, P., Keronen, P., Vesala, T., and Kulmala, M.: Long-term particle flux observations Part I: Uncer-tainties and time-average statistics, Atmos. Environ., 43, 3431– 3439, 2009a.
Rannik, Ü., Mammarella, I., Keronen, P., and Vesala, T.: Vertical advection and nocturnal deposition of ozone over a boreal pine forest, Atmos. Chem. Phys., 9, 2089–2095, doi:10.5194/acp-9-2089-2009, 2009b.
Rinne, J., Hakola, H., Laurila, T., and Rannik, Ü.: Canopy scale monoterpene emissions of Pinus sylvestris dominated forests, Atmos. Environ., 34, 1099–1107, 2000.
Rinne, J., Markkanen, T., Ruuskanen, T. M., Petäjä, T., Keronen, P., Tang, M.J., Crowley, J. N., Rannik, Ü., and Vesala, T.: Effect of chemical degradation on fluxes of reactive compounds – a study with a stochastic Lagrangian transport model, Atmos. Chem. Phys., 12, 4843–4854, doi:10.5194/acp-12-4843-2012, 2012. Saunders, S. M., Jenkin, M. E., Derwent, R. G., and Pilling, M.
J.: Protocol for the development of the Master Chemical Mech-anism, MCM v3 (Part A): tropospheric degradation of non-aromatic volatile organic compounds, Atmos. Chem. Phys., 3, 161–180, doi:10.5194/acp-3-161-2003, 2003.
Smolander, S., He, Q., Mogensen, D., Zhou, L., Bäck, J., Ru-uskanen, T., Noe, S., Guenther, A., Aaltonen, H., Kulmala, M., and Boy, M.: Comparing three vegetation monoterpene emission models to measured gas concentrations with a model of mete-orology, air chemistry and chemical transport, Biogeosciences, 11, 5425–5443, doi:10.5194/bg-11-5425-2014, 2014.
Sogachev, A., Menzhulin, G., Heimann, M., and Lloyd, J.: A simple three dimensional canopy – planetary boundary layer simulation model for scalar concentrations and fluxes, Tellus B, 54, 784– 819, 2002.
Sogachev, A., Kelly, M., and Leclerc, M.: Consistent two-equation closure modelling for atmospheric research: buoyancy and veg-etation implementations, Bound.-Lay. Meteorol., 145, 307–327, 2012.
Stull, R. B.: An Introduction to Boundary Layer Meteorology, Kluwer Academic Publishers, Dordrecht, the Netherlands, 1988. Weber, R. J., Marti, J. J., McMurry, P. H., Eisele, F. L., Tanner, D. J., and Jefferson, A.: Measurements of new particle formation and ultrafine particle growth rates at a clean continental site, J. Geo-phys. Res.-Atmos., 102, 4375–4385, doi:10.1029/96JD03656, 1997.
Welz, O., Savee, J. D., Osborn, D. L., Vasu, S. S., Percival, C. J., Shallcross, D. E., and Taatjes, C. A.: Direct kinetic measure-ments of Criegee Intermediate (CH2OO) formed by reaction of CH2I with O2, Science, 335, 204–207, 2012.
Whitehead, J. D., Gallagher, M. W., Dorsey, J. R., Robinson, N., Gabey, A. M., Coe, H., McFiggans, G., Flynn, M. J., Ryder, J., Nemitz, E., and Davies, F.: Aerosol fluxes and dynamics within and above a tropical rainforest in South-East Asia, Atmos. Chem. Phys., 10, 9369–9382, doi:10.5194/acp-10-9369-2010, 2010. Wilson, J. D. and Sawford, B. L.: Review of Lagrangian stochastic
models for trajectories in the turbulent atmosphere, Bound.-Lay. Meteorol., 78, 191–210, 1996.
Zelger, M., Schween, J., Reuder, J., Gori, T., Simmerl, K., and Dlugi, R.: Turbulent transport, characteristic length and time scales above and within the BEMA forest site at Castel-porziano, Atmos. Environ., 31, 217–227, doi:10.1016/S1352-2310(97)00112-X, 1997.
Zhou, L., Nieminen, T., Mogensen, D., Smolander, S., Rusanen, A., Kulmala, M., and Boy, M.: SOSAA – a new model to simu-late the concentrations of organic vapours, sulphuric acid and aerosols inside the ABL – Part 2: Aerosol dynamics and one case study at a boreal forest site, Boreal Environ. Res., 19, 237–256, 2014.