J. R. Todd et al.
ABSTRACT: The world collection of sugarcane (Saccharumhybrids)
and related grasses (WCSRG) is an important source of genes for sugarcane and energycane breeding. The core collection or diversity panel of the WCSRG was created in Canal Point with 300 accession and 10 checks to evaluate its diversity. The fiber components of the species and accessions within the WCSRG are unknown, so a shredded and dried fiber sample was taken from each accession and sent for fiber analysis. The acetyl groups, acid insoluble lignin, acid soluble lignin, arabinan, glucan, holocellulose, total lignin, structural ash, and xylan were quantified on a % fiber basis and nonstructural ash on a % total basis. There were significant, but not large differences between species for holocellulose, lignin, acetyl, acid soluble lignin,
PLANT BREEDING -
Article
Fiber composition of a diversity panel of the
world collection of sugarcane (
Saccharum
spp.)
and related grasses
James Ryan Todd1,2, Hardey Sandhu2, Joe Binder3, Rebecca Arundale3, Vanessa Gordon4, Jian Song5,
Barry Glaz4, Jianping Wang5,6*
1.University of Florida - Agronomy - Belle Glade (FL) -United States.
2.USDA Agricultural Research Service - Sugarcane Research Unit - Houma (LA) - United States. 3.BP Biofuels North America - LLC - Houston (TX) - United States.
4.USDA Agricultural Research Service - Sugarcane Field Station - Canal Point (FL) - United States. 5.University of Florida - Agronomy - Gainesville (FL) - United States.
6.University of Florida - Plant Molecular and Cellular Biology Program- Genetics Institute - Gainesville- Florida - United States.
*Corresponding author: wangjp@ufl.edu
Received: Dec. 20, 2016 – Accepted: Mar. 8, 2017
nonstructural ash, and glucan. For each trait, Saccharum spontaneum had significantly more holocellulose, glucan, lignin, and nonstructural ash and less acetyl and acid soluble lignin than other species. In all populations, glucan and holocellulose were positively correlated and glucan and lignin were negatively correlated. In hybrids, internode length correlated positively with holocellulose and nonstructural ash and negatively with lignin. Principal component analysis indicated that a large amount of diversity exists within each of the species. The results suggest that strategic use of the WCSRG could provide both positive and negative selection for fiber-related traits could be made within all species of the collection.
INTRODUCTION
Sugarcane and energy cane are important feedstocks for sugar and biofuel production. They are primarily derived from complex hybrids within the genus Saccharum. Two
large germplasm collections were developed with the intent of broadening the genetic base of sugarcane. Due to the genetic similarity between sugarcane and energy cane, both collections can also be useful for broadening the genetic base of energy cane. These collections, which are collectively known as the World Collection of Sugarcane and Related Grasses (WCSRG), are located at the USDA-ARS Subtropical Horticulture Research Station in Miami, FL, USA, and at the Research Centre at Kannur, in Kerala, India. The collection in Miami is composed of 20 species within the Saccharum complex with approximately
1200 accessions collected from 45 countries (Nayak et al. 2014; Todd et al. 2014). The three most abundant taxa in this collection are S. spontaneum L., S. officinarum L., and Saccharum hybrids. Phenotypic and genotypic evaluation
of the WCSRG allowed us to create a diversity panel, or core collection, of 300 accessions (Nayak et al. 2014; Todd et al. 2014), which represents the range of progenitors of modern sugarcane and energy cane cultivars (Bremer 1961; Nair 2008; Tew and Cobill 2008). This replicated trial provides a more manageable source for intensive studies and further characterization to improve breeders’ knowledge of the characteristics of this germplasm (Upadhyaya and Ortiz 2001).
Energy can be derived from the fiber of sugarcane and it is the primary energy source of energy cane (Matsuoka et al. 2014). In plant cell walls, the cellulose fibrils are embedded into a matrix of hemicellulose and lignin (Aspinall 1980). The cell wall components can be further grouped in different ways. Holocellulose is composed of cellulose (i.e., glucose polysaccharide ) and hemicellulose (i.e., xylan, glucuronoxylan, arabinoxylan, or glucomannan) (Schwartz and Lawoko 2010), a term that collectively describes a group of different compounds that interact with cellulose in the cell wall (Vermerris 2010). Cellulose, or glucan (Schwartz and Lawoko 2010), is a chain polymer of β-(1,4)-linked D-glucopyranoses; making up 15-30% of the cell wall (Vermerris 2010). The composition of the hemicellulosic compounds varies according to both the type and the developmental stage of the plant. Both cellulose and hemicellulose are
carbohydrates that can be broken down into simple sugars and fermented into biofuel.
Depending on the type of post-harvest processing, some components of fiber architecture may inhibit carbohydrate conversion to energy. For example, lignin reduces conversion by inhibit enzymatic hydrolyzation of the digestible parts of the biomass, including cellulose and hemicellulose (Chang and Holtzapple 2000).
Lignin can be classified according to its acid solubility (Sluiter et al. 2010). Acid-insoluble lignin (AIL) has a high molecular weight (Sluiter et al. 2010) and can be precipitated and removed by filtration (Schwartz and Lawoko 2010). Acid-soluble lignin (ASL) has a low molecular weight and dissolves in acid, thus remaining in solution and interfering with the conversion process (Schwartz and Lawoko, 2010; Sluiter et al. 2010). If the ASL is removed by chemical treatment, then an increase in fermentation and conversion to energy could occur in the enzymatic method (Schwartz and Lawoko 2010). However, both ASL and AIL can be used for direct combustion for heat, steam, or electricity (Huang et al. 2009), because they have greater inherent energy values than do cellulose and hemicellulose (Novaes et al. 2010).
Other conversion inhibitors include the acetyl groups on xylan, which sterically hinder xylanase activity (Chang and Holtzapple 2000), and ash, which reduces heating value. It was found that deacetylation of poplar wood and wheat straw could increase enzymatic digestibility (Grohmann et al. 1989; Kong et al. 1992). Despite the digestibility issues found with acetyl groups (Chang and Holtzapple 2000), they had a minor impact on biomass digestibility when compared with lignin. Ash is produced as a byproduct of the combustion process, and is composed of several elements including Si, Al, Fe, Ca, Mg, Na, K, S, and P. Ash reduces heating value proportionally by content (McKendry 2002), and many of ash’s elements increase the maintenance and cleaning costs of boilers by forming slag in the boiler tubes (Khan et al. 2009; McKendry 2002).
i. evaluate the fiber composition of germplasm accessions in the diversity panel selected from the WCSRG;
ii. characterize relationships between fiber components in the germplasm accessions; and iii. identify superior breeding material those accessions
with minimal lignin and ash. Accomplishing these objectives should ultimately improve the performance of sugarcane or energy cane lines destined for an energy-production pipeline.
MATERIALS AND METHODS
In March, 2013, the 300 accessions selected from the WCSRG (Nayak et al. 2014; Todd et al. 2014) as the diversity panel, along with nine commercial sugarcane cultivars (i.e., CP 00-1101 (Gilbert et al. 2008)), CP 01-1372 (Edmé et al. 2009), CP 03-1912 (Gilbert et al. 2011), CP 72-2086 (Miller et al. 1984), CP 78-1628 (Tai et al. 1991), CP 88-1762 (Tai et al. 1997), CP 89-2143 (Glaz et al. 2000), CP 96-1252 (Edmé et al. 2005), CPCL 00-4111 (Glynn et al. 2011), and one high yielding sugarcane genotype (CP 01-2390) planted as checks, were established in 37 × 37 cm pots in a randomized complete block design (RCBD) with three replicates per entry (March 2013). All pots were placed in containers (29 × 41 × 52.5 cm) with a drain hole 5 cm above the ground. The pots were filled with 5% fine pine bark (< 9.53 mm), 10 % well point sand, and 85% compost. An automatic sprinkler system was used to irrigate the plants twice per 24 h, by using shrubber emitters, at a rate of 8 L·h-1 water, for 5 min at a time. Pots
were weeded as needed. Each accession was fertilized three months after planting with 25 g of 10-10-10 N-P-K with micronutrients, and 100 g of 14-14-14 N-P-K Osmocote® slow release fertilizer. The surrounding area was treated periodically with 2% (w:v) glyphosate to control weeds. Of the initial 300 accessions in the diversity panel, 292 survived until the ratoon harvest in July and August of 2014, when plants were sampled for fiber analysis. Stalk samples of each accession were collected and weighed immediately before removing the remaining stalks of the first-ratoon harvest. Depending on their individual masses, 3 to 93 stalks were collected from each pot to estimate dry biomass and fiber composition. The subsamples were shredded separately with a modular sugarcane disintegrator
(Codistil S/A Denini, Mod: 132S, Piracicaba-SP, Brazil) and mixed thoroughly in a plastic container. To estimate dry biomass, a subsample of approximately 1 kg of shredded fresh biomass was weighed and then dried at 60 °C until a constant weight was achieved. The weights of dry samples were noted before being ground and passed through a 2-mm screen (Wiley-Mill, standard model #3, Thomas Scientific, Philadelphia, PA). Samples packed in 4 ml glass vials were scanned with a vial autosampler on a Fourier Transform Near-Infrared (FT-NIR) analyzer (Antaris II, Thermo Scientific, Madison, WI, USA) fitted with an integrating sphere module. Near-Infra Red chemometric software (OPUS, Version 7.0, Bruker Optik GmBH, Ettlingen, Germany) was used for spectral processing, and analysis of fiber composition was accomplished by using an independently developed calibration model.
Fiber traits, including acetyl groups, AIL, ASL, arabinan, glucan, holocellulose, total lignin, nonstructural ash, structural ash, and xylan, were analyzed by using SAS Proc Mixed (2011), where the explanatory variable was set to group or accession and treated as fixed within a random replication. All traits, except for nonstructural ash, were recorded on a % total fiber content basis, whereas nonstructural ash was recorded on a % total plant basis. For statistical analysis, the accessions were divided into different major groups, including Saccharumspontaneum,
officinarum, and hybrids. The species S.barberi Jeswiet, S.edule Hassk., S. robustum Brandes & Jesw. ex Grassl,
and S.sinense Roxb. were grouped together as “Other Saccharum” since this group had a small number of
accessions and its members are genetically related (Nayak et al. 2014). In addition, the remaining species, which included those of Erianthus (Erianthus bengalense Retz., E. brevibarbis Michx., E. arundinaceus (Rez.) Jeswiet, E. ravennae (L.) P.Beauv., E. procerus (Roxb.), E. kanashiroi
Ohwi, E. rufipilus Griseb.), Miscanthus (M. floridulus
Warb. Ex K.Schum. & Lauterb. and M. sinensis Andersson),
and Sorghum (Sorghum arundinaceum (Desv.) Stapf),
and then run for each group separately with the following equation:
CV = √(RESID) ×100 / MEAN
where the RESID is the residual covariance and MEAN is the overall mean of the model.
Correlations were performed on the fiber components agronomic traits from concurrent research (Todd et al. 2017), including stalk height and diameter, internode length, leaf width and length, fresh and dry biomass, water content, stalk number, and Brix for the largest three groups,
S. hybrids, S. officinarum and S. spontaneum and the total
diversity panel population by using Pearson coefficients in PROC CORR of SAS (2011). The lsmeans from all fiber component measurements were used to conduct a principal component analysis (PCA) in the MULTIBIPLOT program by using the single value decomposition method (Vicente-Villardón 2010), displaying the results in a bi-plot format (Gabriel 1971). In our correlations and PCA analysis, the checks were treated as hybrids.
RESULTS AND DISCUSSION
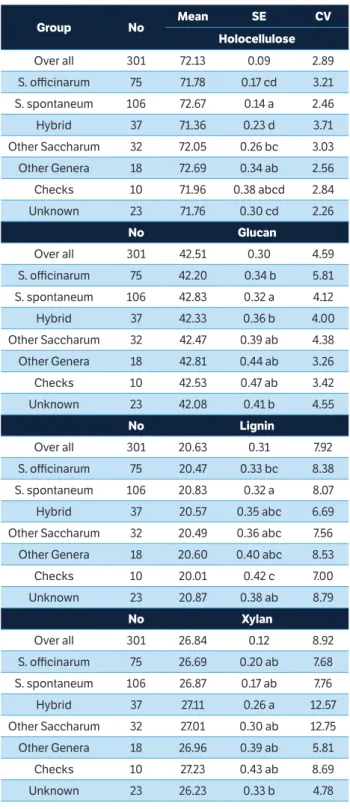
Fiber component in the diversity panelThe estimates of the fiber components of the diversity panel (Table 1) indicate that approximately 72% (72.13 ± 2.20) of the total fiber mass was holocellulose, and, of this, approximately 43% was glucan or cellulose (42.53 ± 2.08) and 27% (26.78 ± 2.68) xylan. Lignin was approximately 21% (20.62 ± 1.72) of the fiber mass, which could be divided into AIL 17% (16.99 ± 1.0) and ASL 5% (4.64 ± 0.23). These components add up to more than the total lignin because they are estimates with associated standard error. The other components were present in lower concentrations, but they may inhibit energy conversion, including Acetyl, which comprised about 2.5% of (2.5 ± 0.41) total fiber mass.
Fiber component analysis among groups
There were significant differences among the groups of accessions selected from WCSRG in all of the fiber components, except for arabinan, structural ash, and total ash. When comparing the three largest groups,
S.officinarum, S. spontaneum, and hybrid, there were
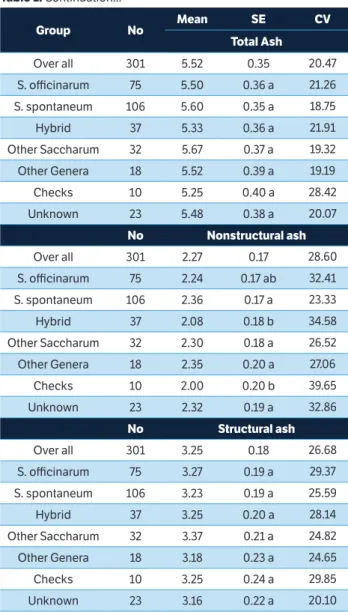
Table 1. The estimated mean, standard deviation, least significant difference (0.05) and coefficient of variation for fiber components in the diversity panel of World Collection of Sugarcane and Related Grasses (WCSRG) and the checks.
....continue
Group No Mean SE CV
Holocellulose
Over all 301 72.13 0.09 2.89
S. officinarum 75 71.78 0.17 cd 3.21
S. spontaneum 106 72.67 0.14 a 2.46
Hybrid 37 71.36 0.23 d 3.71
Other Saccharum 32 72.05 0.26 bc 3.03
Other Genera 18 72.69 0.34 ab 2.56
Checks 10 71.96 0.38 abcd 2.84
Unknown 23 71.76 0.30 cd 2.26
No Glucan
Over all 301 42.51 0.30 4.59
S. officinarum 75 42.20 0.34 b 5.81
S. spontaneum 106 42.83 0.32 a 4.12
Hybrid 37 42.33 0.36 b 4.00
Other Saccharum 32 42.47 0.39 ab 4.38
Other Genera 18 42.81 0.44 ab 3.26
Checks 10 42.53 0.47 ab 3.42
Unknown 23 42.08 0.41 b 4.55
No Lignin
Over all 301 20.63 0.31 7.92
S. officinarum 75 20.47 0.33 bc 8.38
S. spontaneum 106 20.83 0.32 a 8.07
Hybrid 37 20.57 0.35 abc 6.69
Other Saccharum 32 20.49 0.36 abc 7.56
Other Genera 18 20.60 0.40 abc 8.53
Checks 10 20.01 0.42 c 7.00
Unknown 23 20.87 0.38 ab 8.79
No Xylan
Over all 301 26.84 0.12 8.92
S. officinarum 75 26.69 0.20 ab 7.68
S. spontaneum 106 26.87 0.17 ab 7.76
Hybrid 37 27.11 0.26 a 12.57
Other Saccharum 32 27.01 0.30 ab 12.75
Other Genera 18 26.96 0.39 ab 5.81
Checks 10 27.23 0.43 ab 8.69
Unknown 23 26.23 0.33 b 4.78
significant differences between S.spontaneum and the
other groups (hybrids or S.officinarum) for holocellulose,
glucan components (Table 1). The spontaneum accessions
had significantly more holocellulose, lignin, and glucan than did the other two major groups, but possessed significantly less acetyl and acid soluble lignin than did hybrids or S. officinarum. The spontaneum samples also
Table 1. Continuation... Table 1. Continuation...
....continue
Group No Mean SE CV
Acetyl
Over all 301 2.51 0.07 15.67
S. officinarum 75 2.53 0.07 b 14.26
S. spontaneum 106 2.44 0.07 c 15.02
Hybrid 37 2.56 0.08 ab 18.20
Other Saccharum 32 2.48 0.08 bc 15.58
Other Genera 18 2.51 0.09 bc 13.70
Checks 10 2.72 0.10 a 17.45
Unknown 23 2.56 0.08 ab 15.20
No Arabinan
Over all 301 3.60 0.09 12.14
S. officinarum 75 3.60 0.10 a 13.15
S. spontaneum 106 3.61 0.10 a 11.06
Hybrid 37 3.61 0.10 a 14.97
Other Saccharum 32 3.65 0.11 a 10.91
Other Genera 18 3.63 0.12 a 10.27
Checks 10 3.60 0.12 a 12.60
Unknown 23 3.54 0.11 a 9.47
No Acid insoluble lignin
Over all 301 16.99 0.13 5.76
S. officinarum 75 16.92 0.15 ab 5.95
S. spontaneum 106 17.07 0.14 a 5.96
Hybrid 37 16.97 0.16 ab 6.68
Other Saccharum 32 16.96 0.17 ab 4.42
Other Genera 18 16.88 0.20 ab 4.19
Checks 10 16.67 0.22 b 3.49
Unknown 23 17.16 0.18 a 5.78
No Acid soluble lignin
Over all 301 4.64 0.02 4.71
S. officinarum 75 4.67 0.02 a 4.46
S. spontaneum 106 4.60 0.02 b 4.67
Hybrid 37 4.65 0.03 a 4.99
Other Saccharum 32 4.66 0.03 ab 4.09
Other Genera 18 4.67 0.04 ab 4.12
Checks 10 4.66 0.04 ab 4.78
Unknown 23 4.60 0.02 ab 5.91
Group No Mean SE CV
Total Ash
Over all 301 5.52 0.35 20.47
S. officinarum 75 5.50 0.36 a 21.26
S. spontaneum 106 5.60 0.35 a 18.75
Hybrid 37 5.33 0.36 a 21.91
Other Saccharum 32 5.67 0.37 a 19.32
Other Genera 18 5.52 0.39 a 19.19
Checks 10 5.25 0.40 a 28.42
Unknown 23 5.48 0.38 a 20.07
No Nonstructural ash
Over all 301 2.27 0.17 28.60
S. officinarum 75 2.24 0.17 ab 32.41
S. spontaneum 106 2.36 0.17 a 23.33
Hybrid 37 2.08 0.18 b 34.58
Other Saccharum 32 2.30 0.18 a 26.52
Other Genera 18 2.35 0.20 a 27.06
Checks 10 2.00 0.20 b 39.65
Unknown 23 2.32 0.19 a 32.86
No Structural ash
Over all 301 3.25 0.18 26.68
S. officinarum 75 3.27 0.19 a 29.37
S. spontaneum 106 3.23 0.19 a 25.59
Hybrid 37 3.25 0.20 a 28.14
Other Saccharum 32 3.37 0.21 a 24.82
Other Genera 18 3.18 0.23 a 24.65
Checks 10 3.25 0.24 a 29.85
Unknown 23 3.16 0.22 a 20.10
had significantly higher concentrations of nonstructural ash than did the hybrids. These results agree with Knoll et al. (2013), who found that Type 1 energy canes, which have large genetic contributions from S. spontaneum in
their pedigrees,typically had higher ash concentration. The genotypes represented by the other genera and other
Saccharum taxa tended to be intermediate for most fiber
components which could be because of their sample size. The CVs of the different fiber components varied for each of the groups represented in the diversity panel. The three major groups, S. officinarum, S.spontaneum,
ash, reflecting the variability for these traits in this sample of hybrid cultivars. The other Saccharum species had high
CVs for acetyl, arabinan, ASL, and xylan. The plants within the other genera group had low to moderate CV values in most traits. The group of unknown accessions had higher CVs, similar to S. spontaneum or S. officinarum, with the
exception of xylan’s CV which was low.
Holocellulose had the lowest variability, ranging from 64.94 ± 2.08 (in Shoaguan, a S.spontaneum accession) to 76.56 ±
2.08% (in NG77-016, a S.officinarum accession) of the total
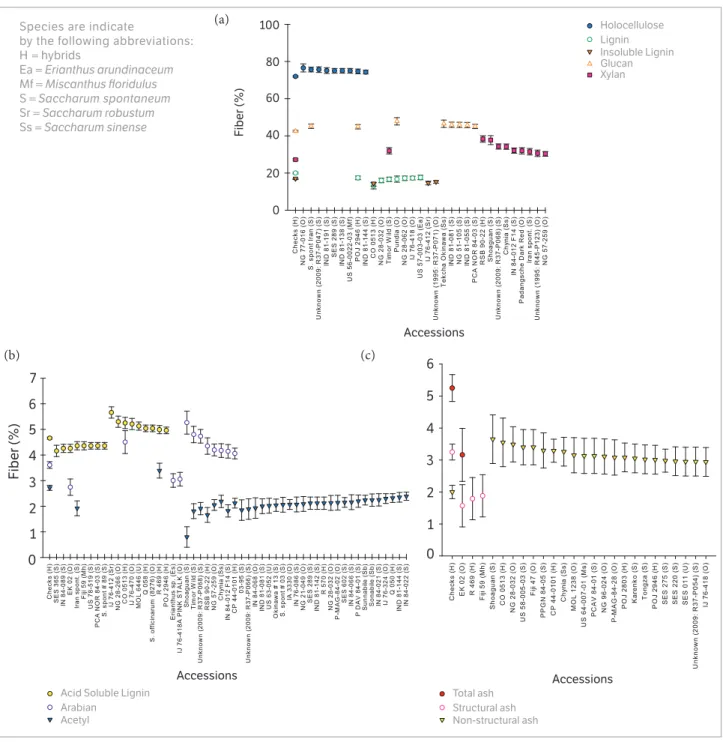
fiber content. The chief component of holocellulose, glucan (Rubin 2008), also had a low CV (4.59), with percentages of holocellulose ranging from 27.74 ± 1.98 in Shoaguan to 47.82 ± 1.98 in Pundia, an accession of S.officinarum (Figure 1).
Figure 1. Scatterplot of the fiber components of Saccharum and related taxa accessions significantly different (p < 0.05) than the mean of the checks (CP 00-1101, CP 01-1372, CP 03-1912, CP 72-2086, CP 78-1628, CP 88-1762, CP 89-2143, CP 96-1252, CPCL 00-4111, and CP 01-2390). (a) Holocellulose, total lignin (lignin), acid insoluble lignin (Insoluble Lignin), Glucan and Xylan; (b) Acid soluble lignin, arabinan, and acetyl; (c) ash fiber components.
Accessions
Accessions Accessions
Fiber (%)
Fiber (%)
100 Holocellulose
Lignin Insoluble Lignin Glucan Xylan
80
60
40
20
0
0 1 2 3 4 5 6
6
5
4
3
2
1
0 7
Acid Soluble Lignin Arabian
Acetyl
Total ash Structural ash Non-structural ash
Species are indicate
by the following abbreviations: H = hybrids
Ea = Erianthus arundinaceum
Mf = Miscanthus floridulus S = Saccharum spontaneum
Sr = Saccharum robustum
Ss = Saccharum sinense
(a)
However, accession Shoaguan was high since the nearest mean is given by accession NG 28-266, an S. officinarum
(36.84 ± 1.98). Our results were similar to those for glucan extracted by methods ASTM E-1821-96 or E-1758-95 from bagasse in Hawaii, as reported in the US Department of Energy’s Biomass Feedstock Composition and Property Database (2015) where values ranged from 31.87 to 43.39%, but were higher than the values for glucan reported by Kuchelmeister and Bauer (2015), which ranged from 32.2 to 33.0% in energy cane and 19.5 to 19.6% in sugarcane. The accession in this collection with the highest glucan (i.e., Pundia; S. officinarum) was 11.65% higher than the mean
for the S.spontaneum group, which wasthe highest group. S. officinarum had the highest CV for glucan (Table 1),
indicating that there is high diversity within S. officinarum
accessions for glucan.
Xylan had a somewhat higher CV at 8.92 than did holocellulose and glucan, and the xylan percentage of fiber content ranged from 23.43 ± 2.39 (in accession NG 28-266, S. officinarum) to 38.34 ± 1.69 (in hybrid
accession RSB 90-22) (Figure 1), which was greater than those reported by methods ASTM E-1821-96 or E-1758-95 in the DOE database (Energy 2015), which ranged from 10.59 to 23.09%.
Arabinan had a relatively large CV (12.14) with a range of 2.73 ± 0.45 in Sylva (S. officinarum) to 5.26 ±
0.45 % of total fiber in Shoaguan. These values were also higher than those found in the Energy (2015) database, in which arabinan following methods ASTM E-1821-96 or E-1758-95 ranged from 1.12 to 2.06 % mass, but less than the 4.84 ± 0.5% found in sugarcane bagasse in Florida (Zeng et al. 2014).
Lignin and its components also had a relatively low CV (7.92). The accession with the lowest lignin value measuring 13.10 ± 1.66% was hybrid accession Co 0513, and the highest value at 23.06 ± 1.66% of total fiber content was detected in accession NG 57-143, S.officinarum. Total
lignin concentrations as measured by methods ASTM E-1721-95 and T-250 in the US Department of Energy’s Biomass Feedstock Composition and Property Database (Energy 2015),displayed a narrower range of values, but at 23.12 to 27.56% of dry mass, they all exceeded the highest value reported in our evaluation. The total Klason lignin estimated by Kuchelmeister and Bauer (2015) was lower than our results, they had a mean of 6.3 % for sugarcane and 15.6 to 15.5 % for energy cane; possibly due to different
accessions or analytical procedures. The CV of acid soluble lignin was low, 4.71. For acid soluble lignin, individual accessions ranged from 4.21 in SES 365, S. spontaneum
to 5.66 % of total fiber in IJ76-412, S.robustum. The CV
of acid insoluble lignin was a bit higher at 5.76 and its percentage of total fiber content ranged from 14.01± 0.98 in Co 0513 to 19.58 ± 0.98 in Shoaguan.
The highest CVs were calculated for ash and its components. The total ash CV was 20.47, and the greatest mean fiber concentration for an individual accession was 10.42 ± 1.19 % in Shoaguan and the lowest was 3.16 ± 0.88 % (in EK02, S. officinarum). These values
resembled the overall range of values for total ash determined with method ASTM E-1755-95 in the US Department of Energy (2015) database, which spanned from 2.84 to 9.4 % of total mass. Acetyl also had a high CV (15.67) with the highest accession being hybrid R 469, which had a fiber percentage of 3.39 ± 0.28 and the lowest accession being Shoaguan, which had a mean fiber percentage of 0.80 ± 0.40.
Variation among accessions for structural and nonstructural ash were also high with CVs of 26.68 and 28.60, respectively. In nonstructural ash, the means of individual accessions ranged from 0.69 ± 0.68 in Matna Shahj (S. barberi) to 3.63 ± 0.68% of total mass in Shoaguan. For structural ash, the mean percentages of individual accessions ranged from 1.58 ± 0.64 in EK 02 to 6.79 ± 0.89 in Shoaguan.
The species S. officinarum had high CVs (Table 1) for
most traits of interest, including holocellulose, glucan, lignin, and ash, indicating that there are possibilities for positive and negative selection within that population. The hybrid group had high CV values (Table 1) for the hemicellulose components, arabinan and xylan, which may be of interest when the effects of hemicellulose on energy recovery are better understood.
Fiber trait analyses of individual accessions
When using the unprotected LSD for holocellulose content, there were 18 accessions significantly different (p = 0.05) than the mean of the sugarcane checks (x),
For lignin, 25 accessions were significantly different, including eight accessions with significantly less lignin than the checks. Four of the accessions with less lignin than the checks were classified as S.officinarum, whereas
those with more lignin than the checks were typically in the S. spontaneum group (8 accessions) (Figure 1a). For
acid soluble lignin, there were 17 accessions significantly different than the checks (i.e., 8 < x < 9) (Figure 1b).
Interestingly, the majority of accessions with less ASL than the checks were classified as S.spontaneum (6), and not
one S. spontaneum had greater ASL than did the checks.
Ten accessions were significantly greater than the mean check value for xylan, with the LSD groupings including five S.spontaneum, three S.officinarum, one S. sinense and one hybrid accession. The 16 accessions with
significant differences for glucan split equally around the check values [i.e., x < 8 (including 4 S.spontaenum) and x > 8 (including 3 S.officinarum)] (Figure 1a).
Of the 35 accessions with significantly different acetyl content from the check, 34 were significantly lower than the checks (Figure 1b); and the majority (i.e., 19 of the 34) belonged to the S.spontaneum group. Significant deviations
from the check means were also observed for the arabinan (3 < x < 9 accessions), AIL (3 < x < 23 accessions), structural
ash (3 < x < 9 accessions), and nonstructural ash (x < 33
accessions) components. (Figures 1a,c).
In general, there was a mix of accession types clustered around the individual component means; but for AIL, structural ash, and nonstructural ash, there were slight species associations seen in the mix of accessions exceeding the check means [i.e., AIL (12/23 S.spontaneum); structural
ash (4/9 S.spontaneum); and nonstructural ash (9/33 S.spontaneum (Figures 1a-c).
For each measured fiber trait of interest, there was a group of accessions with significantly different values than the checks. Within those groups, significant values tended to disproportionately involve one species more than the others, though not exclusively for any given trait. The majority of accessions within the diversity panel were not significantly different than the mean of the checks for fiber components, and there was only a small pool of accessions with significantly higher deleterious traits, such as lignin and ash. Extrapolation of the data presented herein for this diversity panel should provide the means with which to categorize a wide range of germplasm for breeding targets with similar fiber compositions to the checks used
for this study. Additionally, the number of accessions superior to the checks in different fiber components that are beneficial for bioenergy (Figures 1a-c) was small, yet could still be utilized to improve fiber components in breeding programs if they are further evaluated to see if these traits are stable and heritable.
The accession Shoaguan was significantly higher than the checks in insoluble lignin, nonstructural ash, total ash, xylan, and arabinan. It was also significantly lower than the checks in holocellulose and glucan. This accession should probably be avoided as a parent in breeding for energy conversion processes that involve combustion, unless it has other exceptional traits, such as useful disease resistance, because of its high ash content which inhibits energy conversion (Khan et al. 2009; McKendry 2002. This accession was also significantly lower than the checks for acetyl groups, Brix, and fresh mass (Todd et al. 2017). Two potentially useful accessions had positive yield traits as well as above average fiber traits. The accession Timor Wild (S. spontaneum) was significantly higher than the checks
in total ash and nonstructural ash, but was significantly lower in total lignin, Brix, fresh mass, and water (Todd et al. 2017). The accession Pundia had significantly higher glucan, yet significantly less total lignin and Brix than the checks.
Correlations of fiber component traits across the diversity panel
Correlations were made between fiber components and phenotypic traits measured by (Todd et al. 2017) on the same set of accessions used in the present study. There were several significant Pearson correlations between fiber traits and phenotypic traits across the entire diversity panel, but they were weak. The strongest correlations were between acetyl and leaf length (r = 0.25), and holocellulose with stalk number (0.22) and Brix (0.22).
Arabinan strongly correlated with structural ash and xylan. Lignin significantly correlated with all the other fiber traits, except for acetyl and xylan (Chart 1). Lignin correlated positively with AIL but negatively with ASL, arabinan, glucan, holocellulose, and nonstructural and structural ash. Only a small amount of fiber is ASL ~5% whereas most lignin in the fiber is AIL ~17%. The correlations indicate that there is a larger drop in AIL than the increase of ASL so that the total lignin decreases as ASL increases. The negative correlations between lignin and holocellulose are probably due to carbon partitioning. Lignin is a strong carbon sink for reduced carbon in the plant, and lower lignin concentrations allow for more carbon to be captured by the other cellular components (Novaes et al. 2010). Lignin also requires more energy than other cell components to synthesize (Novaes
et al. 2010), which would indicate that lower lignin levels might lead to increases in total biomass. However, we found no significant negative correlations of lignin with dry mass or Brix.
In hybrids lignin had similar significant correlations with other fiber traits as the whole collection but generally higher (Chart 2). The correlations within the officinarum
groups of lignin, glucan, and holocellulose for the most part resembled correlations within the hybrids (Chart 3), with the exception of a non-significant correlation between holocellulose and nonstructural ash. Lignin positively correlated with AIL and negatively with ASL, arabinan, glucan, nonstructural ash, and structural ash. In
officinarum, there was no significant correlation of lignin
or holocellulose with acetyl or xylan. The spontaneum
Acetyl
groups *** NS *** NS NS NS *** *** ***
-0.23 Acid Insoluble
Lignin *** NS *** *** *** *** NS ***
0.10 -0.60 Acid Soluble
Lignin *** NS NS *** *** *** NS
-0.65 -0.09 0.40 Arabinan NS NS *** ** *** ***
0.07 -0.33 -0.02 -0.06 Glucan *** *** ** * ***
0.11 -0.33 -0.05 -0.07 0.65 Holocellulose *** *** *** ***
0.10 0.76 -0.65 -0.51 -0.30 -0.20 Lignin *** *** NS
-0.22 -0.22 0.21 0.17 0.19 0.30 -0.32 Nonstructural
Ash NS NS
-0.73 -0.02 0.25 0.88 -0.12 -0.26 -0.42 0.06 Structural
Ash ***
-0.35 0.20 0.06 0.62 -0.24 -0.28 0.00 -0.09 0.55 Xylan
Chart 1. Correlations of fiber traits for the total accessions within the diversity panel of the World Collection of Sugarcane and Related Grasses.
*, **, and *** = significant correlations at 0.05, 0.01 and 0.001, respectively; NS = non-significant.
Abbreviations: Acetyla = Acetyl groups; AILb = Acid Insoluble Lignin; ASLc = Acid Soluble Lignin; Holocelld = Holocellulose; NSAe = Nonstructural Ash; SAf = Structural Ash; and *, **, and *** = significant correlations at 0.05, 0.01 and 0.001, respectively; NS = non-significant.
Chart 2. Correlations of fiber traits for Saccharum hybrids including checks within the diversity panel of the World Collection of Sugarcane and Related Grasses.
Acetyla ** NS *** NS ** NS NS *** ***
-0.44 AILb *** NS ** *** *** ** NS NS
0.23 -0.73 ASLc ** * NS *** * NS NS
-0.59 -0.17 0.39 Arabinan NS NS *** NS *** ***
0.20 -0.41 0.31 0.09 Glucan *** ** ** NS *
0.41 -0.56 0.22 -0.13 0.79 Hollocelld ** * * ***
-0.03 0.80 -0.74 -0.55 -0.45 -0.46 lignin *** * NS
-0.19 -0.43 0.37 0.18 0.40 0.37 -0.55 NSAe NS NS
-0.69 0.01 0.15 0.86 -0.14 -0.34 -0.34 0.05 SAf ***
population had similar correlations between lignin and other fiber components as the whole diversity panel and other species tested (Chart 4). The spontaneum group also
had positive correlations between glucan and holocellulose and displayed similar trait correlation patterns as observed in the other species. But, unlike glucan and holocellulose of the other species, and like the whole collection, there was a significant negative correlation between xylan and acetyl (Chart 4). We found no correlation between holocellulose or glucan with nonstructural ash in the
spontaneum group. The aforementioned results indicate that
breeding for higher dry mass and less water content might contribute to decreasing acetyl groups while increasing ash. In all the species we evaluated, lignin had negative correlations with ash (structural or non-structural); whereas, holocellulose correlated positively with ash and its components. This suggests that selection for higher holocellulose and lower lignin could increase ash content. In populations of Sorghum, Stefaniak et al. (2012) found
significant negative correlations between lignin and ash and positive but not significant correlations between ash and glucan, a major component of holocellulose. Acetyl had negative correlations with ash in all species tested in this study, indicating that breeding for lower ash could increase acetyl. However, this strategy might also reduce arabinan and xylan, which were positively correlated with ash.
Reduced lignin concentrations should increase saccharification through fermentation (Chang and Holtzapple 2000). However, this could also increase ash, which negatively affects combustion (McKendry 2002).
Genotypes and cultivars could be developed for specific purposes, one type with high lignin and low ash for combustion and another with high ash and low lignin for saccharification. Any cultivars developed for saccharification will also need to account for the effects of hemicellulose, including arabinan, xylan, and other components. The effects of hemicellulose components on saccharification are complex (De Souza et al. 2013), which make predictions difficult.
Zhao et al. (2014) reported small negative correlations between lignin and glucan and lignin and hemicellulose in among Miscanthus accessions; these correlations,
however, were not significant. Since total lignin and ASL are negatively correlated in this paper, decreasing total lignin could increase the concentration of ASL which would reduce the efficiency of the energy conversion process. In wheat straw, Wu et al. (2014) demonstrated that total lignin, AIL, and glucan were negatively correlated with ASL. Acid soluble lignin significantly and positively correlated with glucan in our hybrid group, but not significantly across the entire diversity panel nor in the other groups we tested, differing from Wu et al. (2014) findings in wheat straw, which showed a significant negative correlation between ASL and glucan.
Correlations of fiber traits with phenotypic traits in hybrids
Fiber components displayed stronger correlations with phenotypic traits in our hybrid group than they did within the complete diversity panel. For example, Chart 3. Correlations of fiber traits for Saccharum officinarum within the diversity panel of the World Collection of Sugarcane and Related Grasses.
Acetyla NS NS *** NS NS NS * *** NS
-0.02 AILb *** * * ** *** *** NS NS
0.05 -0.54 ASLc *** NS NS *** * *** *
-0.50 -0.27 0.64 Arabinan NS NS *** * *** ***
-0.19 -0.25 -0.11 0.11 Glucan *** ** ** NS NS
-0.18 -0.30 -0.03 0.15 0.65 Hollocelld * ** NS NS
0.21 0.77 -0.61 -0.58 -0.37 -0.27 lignin *** *** NS
-0.26 -0.40 0.29 0.24 0.35 0.34 -0.48 NSAe NS *
-0.63 -0.15 0.39 0.87 0.14 -0.03 -0.50 0.15 SAf ***
0.02 0.18 0.24 0.47 -0.06 -0.13 0.11 -0.27 0.40 Xylan
Acetyla *** NS *** *** *** NS NS *** ***
-0.41 AILb *** NS *** *** *** NS * **
0.10 -0.56 ASLc ** NS NS *** NS NS NS
-0.79 0.17 0.32 Arabinan ** *** *** NS *** ***
0.33 -0.43 0.01 -0.32 Glucan *** ** NS *** ***
0.38 -0.45 -0.04 -0.35 0.66 Hollocelld NS NS *** ***
0.03 0.70 -0.66 -0.38 -0.27 -0.10 lignin NS *** NS
-0.06 -0.11 0.16 0.06 0.01 0.12 -0.17 NSAe NS NS
-0.85 0.21 0.19 0.89 -0.36 -0.51 -0.33 0.00 SAf ***
-0.63 0.27 0.16 0.81 -0.43 -0.43 -0.13 0.02 0.72 Xylan
Chart 4. Correlations of fiber traits for Saccharum spontaneum within the diversity panel of the World Collection of Sugarcane and Related Grasses.
Abbreviations: Acetyla = Acetyl groups; AILb = Acid Insoluble Lignin; ASLc = Acid Soluble Lignin; Holocelld = Holocellulose; NSAe = Nonstructural Ash; SAf = Structural Ash; and *, **, and *** = significant correlations at 0.05, 0.01 and 0.001, respectively; NS = non-significant.
in hybrids, internode length correlated positively with ASL (0.32) and nonstructural ash (0.38) and negatively with lignin (– 0.36). These differed from the correlations in the whole collection, where most internode length correlations were not significant or, in the case of lignin, positive.
Correlations of fiber traits with phenotypic traits in Saccharum officinarum
In the S. officinarum group, stalk number positively
correlated with arabinan (0.32). Selection for increased stalk number is a common strategy for increasing yield, but this correlation indicates that it could also increase arabinan content in S. officinarum. Water content
negatively correlated with holocellulose (– 0.25).
Correlations of fiber traits with phenotypic traits in Saccharum spontaneum
In the S. spontaneum group, acetyl content correlated
with stalk height (0.23), stalk diameter (0.31), fresh weight (0.20), and water weight (0.23), showing similar but higher correlations than we reported for the whole diversity panel. Leaf length correlated negatively with AIL (–0.27) and positively with holocellulose (0.32). Water content negatively correlated with structural ash (–0.23). The correlation results indicate that breeders might have to contend with unwanted associations or maybe linkages between desirable traits such as fresh weight and unwanted traits like acetyl. Genotypes of S.spontaneum
are strategically crossed with commercial hybrids or
S.officinarum by breeders seeking resistance or tolerance
to biotic and abiotic stresses (Tew and Cobill 2008). The results of this study indicate that the back crossing process potentially produces progeny with increased ash, lignin and holocellulose, with putative decreases in acetyl and acid soluble lignin. Phenotypic traits that distinguish among
S. spontaneum,S.officinarum, and sugarcane hybrids
(Todd et al. 2017) include stalk diameter, fresh weight, and water weight. Our findings of correlations between acetyl and these phenotypic traits indicate that breeders could expect that the more phenotypically sugarcane-like S.spontaneum accessions may have higher acetyl
content.
Principal Component Analysis
REFERENCES
Aspinall, G. O. (1980). Chemistry of cell wall polysaccharides. In The Biochemistry of plants. New York: Academic Press. https:// doi.org/10.1016/b978-0-12-675403-2.50018-1.
Bremer, G. (1961). Problems in breeding and cytology of sugar cane. Euphytica, 10, 59-78. https://doi.org/10.1007/bf00037206.
Chang, V. S. and Holtzapple, M. T. (2000). Fundamental factors affecting biomass enzymatic reactivity. Applied biochemistry and biotechnology,84, 5-37. https://doi.org/10.1385/abab:84-86:1-9:5. De Souza, A. P., Leite, D. C. C., Pattathil, S., Hahn, M. G., and Buckeridge, M. S. (2013). Composition and Structure of Sugarcane
CONCLUSION
Holocellulose had the lowest variability and ash traits had the highest variability in the diversity panel. The means of the three major groups (i.e., Saccharum officinarum, spontaneum, and hybrids) for most fiber traits significantly
differed from each other, but with only minor differences. The
S. spontaneum group had significantly higher concentrations
of holocellulose and lignin and significantly less acetyl and nonstructural ash than did the other groups. For most fiber traits, the accessions from other Saccahrum species (Other Saccharum) and species related to Erianthus or Miscanthus
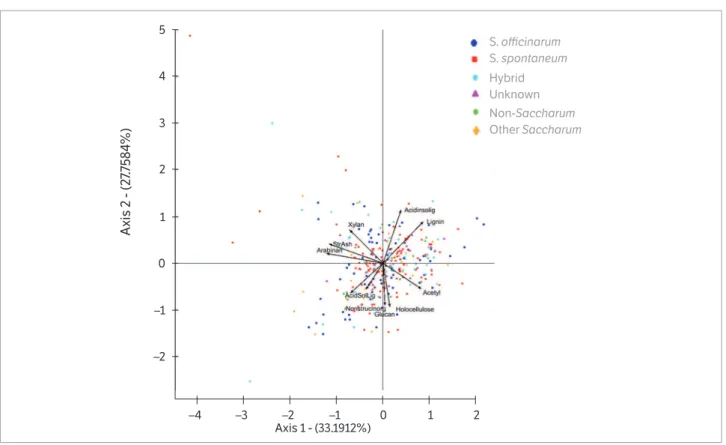
Figure 2. Principle component analysis (PCA) of fiber traits including: Acid Soluble Lignin (Acidsolig), Acid Insoluble Lignin (Acidinsolig), Acetyl, Arabinan, Glucan, Holocellulose, Non Structural Ash (Non Strc Ash), Total Lignin (Lignin) Structural Ash (StruAsh), Xylan) measured from the diversity panel of the world collection of sugarcane and related (Harvested on 7-2-2014 – 8-15-2014 in Canal Point, FL).
S. officinarum
S. spontaneum
Hybrid Unknown
Non-Saccharum
Other Saccharum
5
4
3
2
1
0
–1
–2
–4 –3 –2 –1 0 1 2
Axis 2 - (2
7.
75
8
4%)
Axis 1 - (33.1912%)
and remedies. Fuel Processing Technology, 90, 21-50. https://doi. org/10.1016/j.fuproc.2008.07.012.
Knoll, J. E., Anderson, W. F., Richard, E. P., Doran-Peterson, J., Baldwin, B., Hale, A. L. and Viator, R. P. (2013). Harvest date effects on biomass quality and ethanol yield of new energycane (Saccharum
hyb.) genotypes in the Southeast USA. Biomass and Bioenergy, 56, 147-156. https://doi.org/10.1016/j.biombioe.2013.04.018. Kong, F., Engler, C. R. and Soltes, E. J. (1992). Effects of cell-wall acetate, xylan backbone, and lignin on enzymatic hydrolysis of aspen wood. Applied Biochemistry and Biotechnology,34, 23-35. https://doi.org/10.1007/bf02920531.
Kuchelmeister, C. and Bauer, S. (2015). Rapid small-scale determination of extractives in biomass. BioEnergy Research, 8(1), 68-76. https://doi.org/10.1007/s12155-014-9493-x.
Matsuoka, S., Kennedy, A. J., Santos, E. G. D., Tomazela, A. L. and Rubio, L. C. S. (2014). Energy cane: its concept, development, characteristics, and prospects. Advances in Botany. http://dx.doi. org/10.1155/2014/597275.
McKendry, P. (2002). Energy production from biomass (part 1): overview of biomass. Bioresource Technology 83, 37-46. https:// doi.org/10.1016/s0960-8524(01)00118-3.
Miller, J., Tai, P., Glaz, B., Dean, J. and Kang, M. (1984). Registration of ‘CP 72-2086’ sugarcane. Crop Science, 24, 210-210. https://doi. org/10.2135/cropsci1984.0011183x002400010055x.
Nair, N. (2008). Sugarcane breeding institute, Coimbatore: A perspective. Sugar Technology,10, 285-292. https://doi.org/10.1007/ s12355-008-0051-8.
Nayak, S. N., Song, J., Villa, A., Pathak, B., Ayala-Silva, T., Yang, X., Todd, J., Glynn, N. C., Kuhn, D. N., Glaz, B., Gilbert, R. A., Comstock, J. C. and Wang, J.(2014). Promoting utilization of Saccharum spp. genetic resources through genetic diversity analysis and core collection construction. PloS one, 9(10), e110856. https://doi. org/10.1371/journal.pone.0110856.
Novaes, E., Kirst, M., Chiang, V., Winter-Sederoff, H. and Sederoff, R. (2010). Lignin and biomass: a negative correlation for wood formation and lignin content in trees. Plant Physiology,154, 555-561. https://doi.org/10.1104/pp.110.161281.
Rubin, E. M. (2008). Genomics of cellulosic biofuels. Nature 454, 841-845. https://doi.org/10.1038/nature07190.
Cell Wall Polysaccharides: Implications for Second-Generation Bioethanol Production. BioEnergy Research,6, 564-579. https:// doi.org/10.1007/s12155-012-9268-1.
Edmé, S., Tai, P., Glaz, B., Gilbert, R., Miller, J., Davidson, J., Dunckelman, J. and Comstock, J. (2005). Registration of ‘CP 96-1252’ sugarcane. Crop science,45, 423-424. https://doi.org/10.2135/ cropsci2005.0423.
Edmé, S. J., Davidson, R. W., Gilbert, R. A., Comstock, J. C., Glynn, N. C., Glaz, B., del Blanco, I. A., Miller, J. D. and Tai, P. Y. (2009). Registration of ‘CP 01-1372’sugarcane. Journal of plant registrations, 3, 150-157. https://doi.org/10.3198/jpr2009.01.0046crc.
Gabriel, K. R. (1971). The biplot graphic display of matrices with application to principal component analysis. Biometrika,58, 453-467. https://doi.org/10.1093/biomet/58.3.453.
Gilbert, R. A., Comstock, J. C., Glaz, B., del Blanco, I. A., Edmé, S. J., Davidson, R. W., Glynn, N. C., Sood, S., Zhao, D. and Miller, J. D. (2011). Registration of ‘CP 03-1912’ sugarcane. Journal of Plant Registrations,5, 318-324. https://doi.org/10.3198/jpr2011.02.0075crc. Gilbert, R. A., Comstock, J. C., Glaz, B., Edmé, S. J., Davidson, R. W., Glynn, N. C., Miller, J. D. and Tai, P. Y. (2008). Registration of ‘CP 00-1101’ sugarcane. Journal of plant registrations,2, 95-101.
https://doi.org/10.3198/jpr2007.12.0660crc.
Glaz, B., Miller, J., Deren, C., Tai, P., and Comstock, J. (2000). Registration of ‘CP 89-2143’ sugarcane. Crop science, 40, 577-577.
https://doi.org/10.2135/cropsci2000.0025rcv.
Glynn, N. C., Milligan, S. B., Gilbert, R. A., Davidson, R. W., Comstock, J. C., Glaz, B., Edmé, S. J., Hu, C. J., Holder, D. G. and del Blanco, I. A. (2011). Registration of ‘CPCL 00-4111’ sugarcane. Journal of Plant Registrations 5, 325-331. https://doi.org/10.3198/jpr2010.12.0701crc. Grohmann, K., Mitchell, D., Himmel, M., Dale, B. and Schroeder, H. (1989). The role of ester groups in resistance of plant cell wall polysaccharides to enzymatic hydrolysis. Applied Biochemistry and Biotechnology, 20, 45-61. https://doi.org/10.1007/bf02936472. Huang, H. J., Ramaswamy, S., Al-Dajani, W., Tschirner, U. and Cairncross, R. A. (2009). Effect of biomass species and plant size on cellulosic ethanol: a comparative process and economic analysis. Biomass and Bioenergy, 33, 234-246. https://doi.org/10.1016/j. biombioe.2008.05.007.
SAS (SAS/STAT® 9.3 user’s guide: the MIXED procedure, SAS
Institute Inc., 2011, Cary, NC, USA).
Saville, D. J. (2015). Multiple comparison procedures – cutting the Gordian knot. Agronomy Journal 107, 730-735. https://doi. org/10.2134/agronj2012.0394.
Schwartz, T. J. and Lawoko, M. (2010). Removal of acid-soluble lignin from biomass extracts using Amberlite XAD-4 resin. BioResources 5, 2337-2347.
Sluiter, J. B., Ruiz, R. O., Scarlata, C. J., Sluiter, A. D. and Templeton, D. W. (2010). Compositional analysis of lignocellulosic feedstocks. 1. Review and description of methods. Journal of Agricultural and Food Chemistry, 58, 9043-9053. https://doi.org/10.1021/jf1008023. Stefaniak, T. R., Dahlberg, J. A., Bean, B. W., Dighe, N., Wolfrum, E. J. and Rooney, W. L. (2012). Variation in biomass composition components among forage, biomass, sorghum-sudangrass, and sweet sorghum types. Crop Science, 52, 1949-1954. https://doi. org/10.2135/cropsci2011.10.0534
Tai, P., Miller, J., Glaz, B., Deren, C. and Shine, J. (1991). Registration of ‘CP 78-1628’ sugarcane. Crop Science, 31, 236-236. https://doi. org/10.2135/cropsci1991.0011183x003100010067x.
Tai, P., Shine, J., Deren, C., Glaz, B., Miller, J. and Comstock, J. (1997). Registration of ‘CP 88-1762’ sugarcane. Crop Science,37, 1388-1388.
https://doi.org/10.2135/cropsci1997.0011183x003700040074x. Tew, T.L. and Cobill, R.M. (2008). Genetic improvement of sugarcane (Saccharum spp.) as an energy crop. In W. Vermerris (Ed.), Genetic improvement of bioenergy crops. (p. 249-272). NYC: Springer.
https://doi.org/10.1007/978-0-387-70805-8_9.
Todd, J., Wang, J., Glaz, B., Sood, S., Ayala-Silva, T., Nayak, S. N., Glynn, N. C., Gutierrez, O. A., Kuhn, D. N. and Tahir, M. (2014). Phenotypic characterization of the Miami World Collection of sugarcane (Saccharum spp.) and related grasses for selecting a
representative core. Genetic Resources and Crop Evolution, 61, 1581-1596. https://doi.org/10.1007/s10722-014-0132-3.
Todd, J., Sandhu, H., Hale, A., Glaz, B. and Wang, J. (2017). Phenotypic evaluation of a diversity panel selected from the World Collection of Sugarcane (Saccharum spp.) and Related Grasses. Maydica, 62, M19.
Upadhyaya, H. and Ortiz, R. (2001). A mini core subset for capturing diversity and promoting utilization of chickpea genetic resources in crop improvement. Theoretical and Applied Genetics, 102, 1292-1298. https://doi.org/10.1007/s00122-001-0556-y. U.S. Department of Energy (2015). Biomass Feedstock Composition and Property Database; [acessed 2015 February 16]. http://www. afdc.energy.gov/biomass/progs/search1.cgi.
Vermerris, W. (2010). Genetic Improvement of Bioenergy Crops. Verlag New York: Springer. https://doi.org/10.1007/ 978-0-387-70805-8.
Vicente-Villardón, J. (2010). MULTBIPLOT: A package for Multivariate Analysis using Biplots. Salamanca: Universidad de Salamanca.
Wu, Z., Hao, H., Tu, Y., Hu, Z., Wei, F., Liu, Y., Zhou, Y., Wang, Y., Xie, G., Gao, C. and Cai, X., (2014). Diverse cell wall composition and varied biomass digestibility in wheat straw for bioenergy feedstock. Biomass and Bioenergy, 70, 347-355. https://doi. org/10.1016/j.biombioe.2014.08.025.