Selection of energy cane clones
Rachel Soares Ramos
1*, Bruno Portela Brasileiro
2, Volmir Kist
3,
Camila Assis
4, Karla Gasparini
1, Lidiane A. Silva
1, Reinaldo
Francisco Teófilo
4, Luiz Alexandre Peternelli
1and Marcio
Henrique Pereira Barbosa
1Abstract: The objective of this study was to select a population of sugarcane clones to develop energy cane cultivars. The genotypic means of 124 clones were estimated for the yield-related traits: mean number of stalks per plant (NS), mean stalk weight (MSW), fiber content (FIB), lignin content (LIG), and sucrose content in cane juice (SPC). From these data, the traits tons of cane per hectare (TCH), tons of fiber per hectare (TFH) and tons of lignin per hectare (TLH) were estimated. The clone effects were statistically significant (p <0.01) for all traits except TLH and LIG. Clone UFV09251 had the highest genotypic values for TFH and TCH. Clone UFV09270 had a high fiber content (15.04%) and clone UFV09225 a high sucrose content (14.05%). The correlation between TFH and TCH was high (0.89). Clone UFV09251 is highly promising as energy cane cultivar, for producing mostTCH and FIB.
Key words:Saccharum spp., fiber, lignin, biomass.
Crop Breeding and Applied Biotechnology 17: 327-333, 2017 Brazilian Society of Plant Breeding. Printed in Brazil
http://dx.doi.org/10.1590/1984-70332017v17n4a50 ARTICLE
*Corresponding author: E-mail: rsramos82@gmail.com
Received: 23 march 2016 Accepted: 30 July 2016
1 Universidade Federal de Viçosa (UFV),
De-partamento de Fitotecnia, Av. P.H. Rolfs, s/n, 36.570-900, Viçosa, MG, Brazil 2 Universidade Federal do Paraná, Departa-mento de Fitotecnia e Fitossanitarismo. Rua dos Funcionários, 80035050, Curitiba, PR, Brazil 3 Instituto Federal Catarinense, Rodovia SC-283, 89.703-720, Concórdia, SC, Brazil 4 UFV, Departamento de Química
INTRODUCTION
On a global level, sugarcane stands out as a crop with a high potential sucrose production, which is widely used for sugar and ethanol. Moreover, in recent years the potential of residues from industrial processing (bagasse, leaves and tips) was analyzed with a view to second-generation ethanol and cogeneration of electric power (Rípoli et al. 2000, Santos et al. 2012).
In Brazil, sugarcane is planted on an area of approximately nine million hectares. In the growing season 2014/15, stalk production exceeded 634 million tons and sugar production was 35 million tons. Ethanol production increased by 2.53% over the previous year, reaching 28 billion liters (CONAB 2015).
Bagasse is a fibrous product resulting from the pressing of sugarcane for juice extraction (Rocha et al. 2015). Sugarcane bagasse, consisting of about 50% water and 50% fiber (Ming et al. 2006), high energy content (Waclawovsky et al. 2010) and great energy efficiency potential (Santchurn et al. 2012). Fiber is a complex material, containing 32 to 48% cellulose, 19 to 24% hemicellulose, 23 to 32% lignin and small amounts of ash and extractives (Siqueira et al. 2011, Rocha et al. 2012, Souza et al. 2013).
production of cellulosic ethanol, cultivars with high cellulose and hemicellulose and low lignin contents are preferred (Tew and Cobill 2008). However, if the designation is cogeneration of electricity, lignin plays an important role, due to its high calorific value (Loureiro et al. 2011). According to Silveira et al. (2015) lignin production increase with increasing biomass production. Therefore, research has been intensified to develop sugarcane cultivars with high biomass productivity.
Energy cane cultivars are usually developed from crosses of Saccharum officinarum and Saccharum spontaneum (Wang et al. 2008). Saccharum spontaneum has the following characteristics: high fiber content (Waclawovsky et al. 2010), low sucrose content, and resistance to pests, diseases and abiotic stresses (Ming et al. 2006). The species S. officinarum in contrast, is characterized by few stalks, but with a large diameter and high sugar content (Ming et al. 2006).
Successful breeding depends on the application of accurate selection procedures, based on the estimation of variance components and prediction of genotype means. For the selection and cloning of genotypes evaluated in progeny tests, Resende (2002) found that the prediction of the genotypic and not only the genetic additive values is fundamental.
As a contribution to the hybridization program and development of cane energy cultivars, the objective of this study was to select a population of sugarcane clones to develop energy cane cultivars.
MATERIAL AND METHODS
This experiment was carried out at the Center for Research and Experimentation in Sugarcane (lat 20° 25’ S, long 42° 48’ W, alt 494 m asl), Federal University of Viçosa, in the municipal district of Oratórios, Minas Gerais, Brazil. Seedlings were planted in the field in April 2010, forming the base population (T1) of 15 half-sib families. The second test phase (T2) consisted of the selection of 124 clones from the best T1 families with the BLUPIS procedure (Resende and Barbosa 2006). In February 2011, T2 was planted in an augmented block design. Each block consisted of 12 clones and 2 additional controls (RB867515 and SP80-1842). The experimental plots consisted of one 5-m row, were spaced 1.4 m apart and comprised 18 buds m-1.
The evaluations were performed in stage T2 in plant cane (July 2012) and ratoon plants (July 2013). Agronomic traits were assessed and technological analyses performed. The following traits were evaluated: mean number of stalks per plant(NS), mean stalk weight (MSW) in kg, determined by weighing 10 stalks per plot. Ten stalks were cut and pressed. The residual bagasse (containing unextracted juice and fiber) was weighed to obtain the wet pulp weight, and after weighing the residue was placed in a forced-air circulation oven and dried to constant weight, to determine the dry bagasse weight. The fiber (FIB) and sucrose contents (SPC) were determined as described by Fernandes (2011).
After that, the bagasse was crushed and separated through a 0.4 mm mesh. Three samples (2 g dry weight) were prepared for extractive process: the samples were successively water flow in organic solvent (commercial ethanol) in a Soxhlet extraction unit for a period of 5 hours. Finally, the was placed in a forced-air circulation oven (45 °C) and dried. This material was used for gravimetric determination of lignin content, according to the Klason method (TAPPI om-98).
Additionally, a multivariate regression model using near infrared spectroscopy (NIR) was built with samples of wide variability to lignin prediction rom Klason method (TAPPI om-98). Some lignin determinations used in this study was performed using the model (unpublished data).
The trait tons of cane per hectare (TCH) was calculated by the following expression: TCH = (NS×SPC×10)/7. Based on the TCH, FIB and LIG it was possible to estimate the tons of fiber per hectare (TFH): TFH = (TCH×FIB)/100 and tons of lignin per hectare (TLH): TLH = (TFX×LIG)/100.
The genotypic values of clones were obtained based on the statistical model: y = Xm + Zg + Wb + Qp + Ti + e, where
RESULTS AND DISCUSSION
The deviance analysis (Peternelli et al. 2012) indicated a significant effect (p <0.01) of genotypic variance for the traits TCH, FIB, NS, MSW, and SPC (Table 1). These results demonstrate the existence of genotypic variability among the clones evaluated for the traits in question. This variability can be exploited by selection. In an evaluation of 286 clones in T2, Baffa et al. (2014) found significant effects of these clones for NS, TCH, FIB, LIG, and SPC. However, in this study, there were no significant effects of the clones for TFH, TLH and LIG, probably due to low variability in this population. Low variability may be a consequence of the limited number of families evaluated in T1.
Heritability was low for all traits, however, selection accuracy for TFH and SPC was moderate (0.64 and 0.51), favoring the process of clone selection. Heritability values can be low as seen here due to environmental influence on sugarcane clones in the early selection stages (Matsuoka et al. 2005).
The NS values were the same for plant cane and ratoon cane, since the repeatability was medium (0.59). These results indicate a regular performance between plant and ratoon cane for NS and that it is possible to maintain the superior performance of this trait throughout the selection stages or over the production cycles (Resende 2002). A cost reduction of phenotyping is therefore possible as fewer technological analyses are required in all growing seasons.
In this study, the repeatability was low for TFH (0.20), TLH (0.21), TCH (0.22), FIB (0.24), MSW (0.30), and SPC (0.37). Santos et al. (2004) determined the repeatability estimates of several agronomic traits in 20 sugarcane genotypes. These authors reported moderate repeatability coefficients for TCH (0.60), FIB (0.61) and SPC (0.44).
The TCH of the clones UFV09251 and UFV09269 was the highest (Table 2), whereas NS of clone UFV09288 was higher (12 stalks per plant) and clone UFV09251 had a higher mean stalk weight (1.5 kg).
Matsuoka et al. (2014) listed some indispensable characteristics of candidate clones for energy cane: high vigor, robustness, high tillering and high capacity for ratoon regrowth, vigorous rhizome, pest and disease resistance, and high fiber content.
Fiber production per hectare (TFH) ranged from 13.3 ton ha-1 (UFV09245) to 14.3 ton ha-1 (UFV09251), with a mean
of 13.60 ton ha-1. Lignin production per hectare (TLH) ranged from 3.1 ton ha-1 to 3.6 ton ha-1 (UFV09256), averaging
3.3 ton ha-1 (Table 2). As also found in this study (Table 2), Silveira et al. (2015) reported that families with higher fiber
yields also had the highest means for tons of lignin per hectare.
The cane yield (TCH) ranged from 95.2 ton ha-1 (UFV09262) to 113.2 ton ha-1 (UFV09251), averaging 104.3 ton ha-1
(Table 2). In addition, the TFH of clone UFV09251 was also high, indicating this clone for selection to obtain energy cane. Interestingly, clone UFV09251 was derived from the cross of B70710 × ?. One of the parents of this clone is the species
S. spontaneum, demonstrating the importance of this species to increase the biomass values in sugarcane breeding programs for energy cane. The species S. spontaneum has a higher fiber content than the other species of the genus Saccharum (Tew and Cobill 2008).
Table 1. Estimation of variance components and genetic parameters for the traits: tons of fiber per hectare (TFH), tons of lignin
per hectare (TLH), tons of cane per hectare (TCH), fiber content (FIB), lignin content (LIG), number of stalks (NS), mean stalk weight (MSW), and sucrose content (SPC) in 124 sugarcane clones in the growing seasons of 2012 and 2013.
Traits
Parameters1 TFH TLH TCH FB (%) LIG (%) NS MSW SPC (%)
σ2
g 1.92 0.24 165.09* 0.75* 0.07 2.53* 0.03* 1.73*
h2
g 0.08 0.12 0.13 0.18 0.00 0.24 0.22 0.27
AC 0.64 0.34 0.36 0.42 0.00 0.48 0.46 0.51
r 0.20 0.21 0.22 0.24 0.09 0.59 0.30 0.37
Mean 12.89 3.11 97.09 13.28 23.87 10.90 1.24 12.19
*: Significant at 1% probability, according to the deviance analysis. 1σ2
g: Genotypic variance; σ2e : residual variance; σ
2
f : phenotypic variance; h2g: individual heritability in the
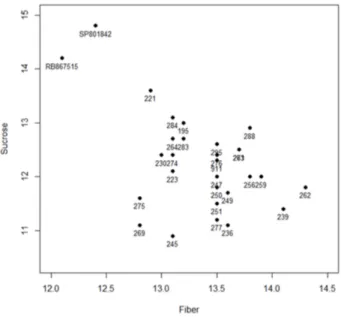
The fiber content varied from 12.8 to 14.3%, with a mean of 13.4% (Figure 1). Clone UFV09262 had the highest fiber content, indicating superiority and confirming the possibility of selection of this clone for biomass production.
Clone UFV09221 had the highest sugar content (13.6%), averaging 12.1% (Figure 1). These values are in agreement with the levels of current cultivars (11 - 13%) (Tew and Cobill 2008). According to these authors, sugarcane cultivars with fiber contents of around 17% and sugar contents of 12-13% are classified as type I. This sugarcane type is interesting from an industrial point of view, since the sugar yield would be maintained while the bagasse, with better fiber quantity and quality, could be used in electricity cogeneration, increasing electricity production per tons of processed waste.
The lignin content was unvaried among the clones. Masarin et al. (2011) analyzed yield parameters of 11 clones and concluded that tall clones with high sucrose and biomass productivity have low lignin contents. Several aspects may influence the composition of lignocellulosic fibers: genetic and environmental factors and analysis methods (Hatfield and Fukushima 2005).
Table 2. Phenotypic mean of 24 sugarcane clones selected for TFH evaluated in the growing seasons of 2012 (plant cane) and 2013
(ratoon cane)
Traits 1
Clones TFH TLH TCH FB (%) LIG (%) NS MSW SPC (%)
251 14.3 3.5 113.2 13.5 23.9 11.3 1.5 11.5
256 14.1 3.6 107.1 13.8 23.9 12.0 1.3 12.0
295 14.0 3.5 108.2 13.5 23.9 11.9 1.4 12.6
271 14.0 3.5 106.6 13.7 23.9 11.6 1.3 12.5
263 14.0 3.4 107.7 13.7 23.9 11.8 1.4 12.5
284 13.8 3.3 109.8 13.1 23.9 12.6 1.3 13.1
230 13.7 3.2 108.3 13.0 23.9 11.7 1.4 12.4
236 13.7 3.3 103.8 13.6 23.9 11.3 1.4 11.1
911 13.7 3.4 101.6 13.5 23.9 11.5 1.2 12.3
239 13.6 3.4 99.8 14.1 23.9 11.4 1.2 11.4
276 13.6 3.3 103.1 13.5 23.9 11.9 1.2 12.4
288 13.5 3.3 99.4 13.8 23.9 12.7 1.1 12.9
262 13.5 3.6 95.2 14.3 23.9 11.1 1.2 11.8
274 13.5 3.1 106.3 13.1 23.9 12.0 1.3 12.4
264 13.5 3.3 106.0 13.1 23.9 12.5 1.2 12.7
221 13.5 3.3 106.2 12.9 23.9 12.3 1.2 13.6
250 13.5 3.4 101.9 13.5 23.9 10.5 1.4 11.8
259 13.4 3.4 100.6 13.9 23.9 10.6 1.4 12.0
277 13.4 3.3 100.8 13.5 23.9 11.0 1.3 11.2
195 13.4 3.1 103.9 13.2 23.9 11.0 1.4 13.0
223 13.4 3.3 104.3 13.1 23.9 12.1 1.2 12.1
269 13.4 3.2 110.1 12.8 23.9 12.2 1.3 11.1
249 13.4 3.5 99.5 13.6 23.9 11.5 1.2 11.7
283 13.4 3.1 105.3 13.2 23.9 11.8 1.3 12.7
247 13.3 3.3 100.0 13.5 23.9 11.4 1.2 12.0
275 13.3 3.3 105.7 12.8 23.9 11.4 1.3 11.6
245 13.3 3.3 101.9 13.1 23.9 12.2 1.2 10.9
1842 15.0 3.7 120.7 12.4 23.9 11.5 1.5 14.8
7515 13.0 3.2 106.0 12.1 23.9 8.3 1.8 14.2
Mean 13.6 3.3 104.3 13.4 23.9 11.7 1.3 12.1
Standard deviation 0.3 0.1 4.1 0.4 0.0 0.6 0.1 0.7
Variance 0.1 0.0 16.4 0.1 0.0 0.3 0.0 0.5
Maximum 14.3 3.6 113.2 14.3 23.9 12.7 1.5 13.6
Minimum 13.3 3.1 95.2 12.8 23.9 10.5 1.1 10.9
1 TFH: Tons of fiber per hectare (ton ha-1); TLH: Tons of lignin per hectare (ton ha-1); TCH: Tons of cane per hectare (ton ha-1); FIB: Fiber content (%); LIG: lignin content (%);
For Rocha et al. (2015) no differences were detectable between the varieties studied in relation to lignin. According to these authors, the amount and composition of monomers depends on the cell wall location, the stage of cell or tissue development and on the cultivation environment.
This is the first study addressing the development of energy cane varieties by the UFV sugarcane breeding program (PMGC/UFV). The genebank of Serra do Ouro, AL, Brazil, contains few accessions of S. spontaneum and
S. robustum, which compromised the development of more families derived from these species to form the base population for selection in this study. Therefore, new crosses should be performed to increase the fiber content and productivity of future energy cane cultivars.
Estimates of genetic correlations provide more accurate information than the phenotypic means, which increases the possibilities of selecting superior genotypes, and consequently, the development of new cultivars.
The correlations between TFH with TLH were positive and moderate (0.54). The correlation of TCH with TFH was high (0.89) (Table 3). The traits with strongest correlation with TLH were LIG, TCH and NS (0.81, 0.46 and 0.44),
respectively. Silveira et al. (2015) studied 50 sugarcane families for energy cane varieties. They found that the traits TCH, NS, LIG, FIB, and MSW were most correlated with TFH and TLH. These results suggest that an increase in any of the yield components could increase lignin and fiber production.
The correlation values between TCH and its yield components (NS and MSW) were positive and moderate (0.50 and 0.62, respectively) (Table 3). These values are similar to those reported by Silveira et al. (2015), in an evaluation of energy cane families. Brasileiro et al. (2013) observed high correlation values between TCH and NS, both in plant and ratoon cane, in the early selection stages. These results suggest that number of stalks can be used in the selection of sugarcane for higher productivity.
The correlation between FIB and SPC was weak and negative (-0.19). Santchurn et al. (2012) reported a negative correlation between fiber and sucrose. These authors emphasize the difficulty of selecting plants for both traits simultaneously. In another study, Santchurn et al. (2014) investigated 64 genotypes with high biomass levels and found that the sucrose-to-fiber ratio is an indicator of the partitioning of the photoassimilates between the fiber and sucrose contained in sugarcane.
However, according to Matsuoka et al. (2014), this assumption is only true when an increase in sugar content is the only goal. Kennedy (2008) empahsized the possibility of maintaining the current sucrose and raising the fiber content of Figure 1.Distribution of the 27 clones selected for energy cane for Fiber (%) and Sucrose content (%).
Table 3.Genetic correlation coefficients between the traits evaluated in 124 cane energy clones, in the growing seasons of 2012 and 2013
Traits1 TFH TLH TCH FB LIG NS MSW
TLH 0.54
TCH 0.89 0.46
FB 0.19 0.16 -0.21
LIG 0.02 0.81 0.02 0.01
NS 0.55 0.44 0.50 0.13 0.21
MSW 0.45 0.12 0.62 -0.36 -0.12 -0.26
SPC 0.02 0.20 0.10 -0.19 0.27 0.21 0.02
future cultivars. According to this author, the sugarcane life cycle has two stages: the growth phase, which occurs in the rainy season, when fiber is accumulated in the stalk. Sucrose is accumulated in the maturation stages, when the vegetative growth declines due to drought. Therefore, these components do not compete with each other for photoassimilates.
According to Silveira et al. (2015), it is possible to obtain genotypes with high fiber and satisfactory sucrose levels. These examples are just a small sample of genetic variability in the Saccharum complex, as described by Matsuoka et al. (2014), and of the possible hybrid combinations that can be established to increase the likelihood of success in breeding energy cane cultivars.
The number of stalks and stalk weight are important components for increasing biomass production and, consequently, the fiber and lignin yield (Silveira et al. 2015). Therefore, clones with higher means of these components may be included in the recurrent selection process, be intercrossed or forwarded in the sugarcane breeding program for energy cane cultivars. Therefore, the agronomic and technological analysis of the clones is important for the selection of energy cane genotypes.
CONCLUSION
The selection of the best clones to obtain energy cane should be based on the productivity of cane (TCH) and fiber (TFH). Clone UFV09251 is recommended for selection, for having the highest TCH and TFH. Clone UFV09262 contained high FIB levels, and can be selected for breeding of energy cane. The findings of this study may be useful in the development of new evaluation and analysis strategies of the chemical components of the of energy cane clones.
ACKNOWLEDGMENTS
The authors acknowledge the Petrobras for financial support.
REFERENCES
Baffa DCF, Costa PMA, Silveira G, Lopes FJ, Barbosa MHP, Loureiro ME, Cruz CD and Peternelli LA (2014) Path analysis for selection of saccharification-efficient sugarcane genotypes through agronomic traits. Agronomy Journal106: 1643-1650.
Brasileiro BP, Peternelli LA and Barbosa MHP (2013) Consistency of the results of path analysis among sugarcane experiments. Crop Breeding
and Applied Biotechnology13: 113-119.
CONAB - Companhia Nacional de Abastecimento (2015) Central de informações agropecuárias: safras – cana (2015). Available at <http:// www.conab.gov.br>. Accessed May 9, 2015.
Fernandes AC (2011) Cálculos na agroindústria da cana de açúcar. Editora
Stab, Piracicaba, 416p.
Hatfield R and Fukushima RS (2005) Can lignin be accurately measured?
Crop Science45: 832-839.
Kennedy AJ (2008) Prospects for combining high sucrose content with increased fiber to generate multi-purpose cane varieties. Proceedings
of the Conference of West Indies Sugar Technologists, Jamaica.
Available at: http://www.jamaicasugar.org/wist/Proceedings/ Prospects%20for%20combining%20high%20sucrose%20content. pdf. Accessed April 02, 2015.
Loureiro ME, Barbosa MHP, Lopes FJF and Silvério FO (2011) Sugarcane breeding and selection for more efficient biomass conversion in cellulosic ethanol. In Buckeridge MS and Goldman GH (eds) Routes
to cellulosic ethanol. Springer, New York, p. 199-239.
Masarin F, Gurpilhares DB, Baffa DCF, Barbosa MHP, Carvalho W, Ferraz A and Milagres AMF (2011) Chemical composition and enzymatic digestibility of sugarcane clones selected for varied lignin content.
Biotechnology for Biofuel4: 55.
Matsuoka S, Garcia AAF and Arizono H (2005) Melhoramento de cana-de-açúcar. In Borém A (ed) Melhoramento de espécies cultivadas. Editora UFV, Viçosa, p. 205-251.
Matsuoka S, Kennedy AJ, Santos EGD, Tomazela AL and Rubio LCS (2014) Energy cane: Its concept, development, characteristics, and prospects. Advances in Botany2014: 1-13.
Ming R, Moore PH, Wu KK, D’Hont A, Glaszmann JC and Tew TL (2006) Sugarcane improvement through breeding and biotechnology. In Janick J (ed) Plant breeding reviews. John Wiley and Sons, Oxford,
p. 15-118.
Peternelli LA, Resende MDV and Mendes TO (2012) Experimento e análise estatística em cana-de-açúcar. In Santos F, Borém A and Caldas C (ed) Cana-de-açúcar: Bioenergia, açúcar e etanol – tecnologias e perspectivas. Editora UFV, Viçosa, p. 333-354.
Resende MDV (2002) Genética biométrica e estatística no melhoramento
de plantas perenes. Embrapa, Brasília, 975p.
Resende MDV (2016) Software Selegen-REML/BLUP: a useful tool for plant breeding. Crop Breeding and Applied Biotechnology16: 330-339.
Resende MDV and Barbosa MHP (2006) Selection via simulated BLUP based on family genotypic effects in sugarcane. Pesquisa
Rípoli TCC, Molina Jr WF and Rípoli MLC (2000) Energy potential of sugar cane biomass in Brazil. Scientia Agricola57: 677-681.
Rocha GJM, Martin C, Silva VFN, Gomez EO and Gonçalves AR (2012) Mass balance of pilot-scale pretreatment of sugarcane bagasse by steam explosion followed by alkaline delignification. Bioresource
Technology111: 447-452.
Rocha GJM, Nascimento VM, Gonçalves AR, Silva VFN and Martín C (2015) Influence of mixed sugarcane bagasse samples evaluated by elemental and physical–chemical composition. Industrial Crops and
Products64: 52-58.
Santchurn D, Ramdoyal K, Badaloo MGH and Labuschagne M (2012) From sugar industry to cane industry: investigations on multivariate data analysis techniques in the identification of different high biomass sugarcane varieties. Euphytica185: 543-558.
Santchurn D, Ramdoyal K, Badaloo MGH and Labuschagne M (2014) From sugar industry to cane industry: Evaluation and simultaneous selection of different types of high biomass canes. Biomass and
Bioenergy61: 82-92.
Santos FA, Queiróz JH, Colodette JL, Fernandes AS, Guimarães VM and Rezende ST (2012) Potencial da palha de cana-de-açúcar para produção de etanol. Química Nova35: 1004-1010.
Santos MSM, Madalena, JA, Soares L, Ferreira PV and Barbosa GVS (2004) Repetibilidade de características agroindustriais em cana-de-açúcar.
Pesquisa Agropecuária Brasileira39: 301-306.
Silveira LCI, Brasileiro BP, Kist V, Daros E, Peternelli LA and Barbosa MHP (2015) Selection strategy in families of energy cane based on biomass production and quality traits. Euphytica201: 443-455.
Siqueira G, Milagres, AMF, Carvalho W, Koch G and Ferraz A (2011) Topochemical distribution of lignin and hydroxycinnamic acids in sugar-cane cell walls and its correlation with the enzymatic hydrolysis of polysaccharides. Biotechnology for Biofuels07: 1-9.
Souza AP, Leite DCC, Pattathil S, Hahn MG and Buckeridge MS (2013) Composition and structure of sugarcane cell wall polysaccharides: implications for second-generation bioethanol production. BioEnergy
Research6: 564-579.
Tew TL and Cobill RM (2008) Genetic improvement of sugarcane (Saccharum spp.) as an energy crop. In Vermerris W (ed) Genetic
improvement of bioenergy crops. Springer, New York, p. 249-272.
Waclawovsky AJ, Sato PM, Lembke CG, Moore PH and Souza GM (2010) Sugarcane for bioenergy production: an assessment of yield and regulation of sucrose content. Plant Biotechnology Journal8:
263-276.
Wang L, Jackson PA, Lu X, Fan YH, Foreman JW, Chen XK, Deng HH, Fu C, Ma L and Aitken KS (2008) Evaluation of sugarcane x Saccharum spontaneum progeny for biomass composition and yield components.