http://www.uem.br/acta ISSN printed: 1806-2636 ISSN on-line: 1807-8672
Doi: 10.4025/actascianimsci.v39i3.34807
Milk composition and blood metabolic profile from holstein cows
at different calving orders and lactation stages
Mariana Borges de Castro Dias1, Karen Martins Leão1*, Ruthele Moraes do Carmo1, Marco Antônio Pereira da Silva1, Edmar Soares Nicolau2 and Thaisa Campos Marques2
1
Instituto Federal de Educação, Ciência e Tecnologia Goiano, Rod. Sul Goiana Km 1, Cx. Postal 66, 75901-970, Campus Rio Verde, Zona Rural, Rio Verde, Goiás, Brazil. 2Escola de Veterinária e Zootecnia, Universidade Federal de Goiás, Goiânia, Goiás, Brazil. *Author for correspondence. E-mail: [email protected]
ABSTRACT. This study aimed to evaluate milk composition and metabolic profile of Holstein cows at different calving orders in the beginning, middle, and end of lactation. One hundred ten Holstein cows were housed in a free stall system receiving the same diet and were grouped according to calving order (first, second, third, and fourth calving) and days in milk (DIM): early (1-90 DIM), middle (91-180 DIM), and end of lactation (over 181 DIM) for comparing milk yield, milk composition, and blood metabolic profile between the calving orders within the same lactation period. These parameters were also evaluated between lactation periods of the cows in different calving orders. The calving order, in any lactation stage, had no influence on milk yield per day and blood biochemical profile of Holstein cows receiving the same diet. However, calving order in all stages of lactation influenced milk composition. The first, second, third, and fourth calving order had no effect on the blood biochemical profile of Holstein cows, in any lactation stage. On the other hand, the different stages of lactation influenced milk yield and milk composition of Holstein cows.
Keywords: biochemical profile, lactation period, milk quality.
Composição do leite e perfil metabólico sanguíneo de vacas holandesas em diferentes
ordens de parto e estádios de lactação
RESUMO. Objetivou-se avaliar a composição do leite e perfil metabólico de vacas da raça Holandesa em diferentes ordens de parto, no início, meio e fim de lactação. Foram utilizadas 110 vacas mantidas em sistema Free stal, recebendo a mesma dieta. Os animais foram agrupados de acordo com a ordem de parto em diferentes dias em lactação (DEL), início (1-90 DEL), meio (91-180 DEL) e fim de lactação (mais de 181 DEL), para a comparação da produção de leite, composição química do leite e perfil metabólico do sangue entre as ordens de parto dentro do mesmo período de lactação. Estes parâmetros também foram avaliados entre os períodos de lactação das vacas em diferentes ordens de parto. A ordem de parto, em nenhum estádio de lactação, influenciou a produção de leite por dia e o perfil bioquímico do sangue de vacas Holandesas que recebiam a mesma dieta. Entretanto, a ordem de parto em todos estádios de lactação influenciou a composição química do leite. A primeira, segunda, terceira e quarta ordem de parto em nenhum estádio de lactação influenciaram o perfil bioquímico do sangue de vacas Holandesas. Por outro lado, diferentes estádios de lactação influenciaram a produção e composição química do leite.
Palavras-chave: perfil bioquímico, período de lactação, qualidade do leite.
Introduction
Milk composition is related to animal nutrition (Fievez, Colman, Castro-Montoya, Stefanov, & Vlaeminck, 2012). Therefore, analysis of milk composition enables the monitoring of cows that secrete low quality milk and the detection of failures in nutritional management, allowing decision making to correct problems.
The urea content in milk is used as indication of excess protein in the diet or poor quality that protein. However, these variations are large both during the day and between animals and at different
levels of production, making it difficult to establish reference values for the parameter. Care should be taken regarding the interpretation of results, as there may be other predisposing factors, such as cow's age and body condition.
In this context, the present study aimed to evaluate milk yield, milk composition, and blood metabolic profile of Holstein cows at different calving orders and lactation stages.
Material and methods
geographical coordinates 17°49’28.2’’S 50°39’35.6’’W. This farm performed three milking daily with an interval of eight hours, and it has approximately 250 lactating Holstein cows, housed in a free stall system with free access to feedstuffs and water. The animals were divided into two groups according to milk production and days in milk (DIM).
One hundred ten Holstein cows were housed in the same pen, with adaptation period of 7 days before collection. The animals were grouped according to calving order (first, second, third, and fourth calving) at different days in milk (DIM): early (1-90 DIM), middle (91-180 DIM), and end of lactation (over 181 DIM) for comparing milk yield, milk composition, and blood metabolic profile between the calving orders within the same lactation period.
All animals received the same diet, for 30 days before the collect, containing 56% dry matter (DM), 32.78% neutral detergent fiber (NDF), 15.44% acid detergent fiber (ADF), 14.5% crude protein (CP), 5.98% ether extract (EE), 6.34% ash, and 73.38% total digestible nutrients (TDN).
In the same day, we collected data of milk yield and samples of diet and milk for chemical analysis and blood for metabolic profile analysis.
Milk yield was obtained by a computer program coupled to the milking machine. Milk samples were collected during the milking of the afternoon that occurs after 1:00 pm. The collections were performed with pots of 40 mL containing Bronopol® preservative, previously identified with
bar code for each animal.
After collection, milk samples were transported in insulated boxes containing ice to the Laboratory of Milk Quality, Center for Food Research, Veterinary and Animal Science School at the Universidade Federal de Goiás, where electronic analysis was conducted for emission of the final report with the results.
The contents of fat, protein, lactose, defatted dry extract (DDE) and total dry extract (TDE) in the milk were analyzed according to the International Organization for Standardization (ISO) – 9622 from the International Dairy Federation (IDF, 2013). The results were expressed as percentage (%).
The urea (mg dL-1) and casein (%) contents were
evaluated by differential absorption of infrared waves, FTIR transformed, using Lactoscope equipment (Delta Instruments).
Somatic cell count (SCC) was analyzed by flow cytometry according to ISO 13366-2 (International Dairy Federation [IDF], 2006). The results of the SCC were expressed as somatic cells (SC) mL-1.
Blood sampling was performed via coccygeal vein using a sterilized 10-mL vial without anticoagulant for serum total protein, total lipid, urea, and beta-hydroxybutyrate and, for glucose evaluation, using a sterile 5-mL vial with sodium fluoride. Blood samples were centrifuged for separation of serum, stored in micro-centrifuge tubes, and frozen at -20°C for further analysis.
Serum levels were measured by a spectrophotometer using the kits Urea® 500, Liquid
Enzyme Glucose®, Total Proteins®, Liquid Enzyme
Triglycerides® (Doles Reagentes, Goiânia, Goiás
State) and beta-hydroxybutyrate (Randox Laboratories Limited, United Kingdom). All analyses of the biochemical profile for all the samples were assessed in triplicate, according to the methodology recommended by the manufacturer.
Diet samples were collected to evaluate the contents of dry matter (DM), neutral detergent fiber (NDF), acid detergent fiber (ADF), crude protein (CP), total digestible nutrients (TDN), ether extract (EE), and ash according to Silva and Queiroz (2002). The experimental design was completely randomized, with four calving orders and three lactation stages, totaling 110 experimental units. Data collected were subjected to analysis of variance and the means were compared by t-test at 5% probability level using ASSISTAT 7.6 beta, 2012 program (Silva, 2012). The mathematical model used was described by the following:
Yij = Observed value; μ = overall mean; ti = effect of calving orders or lactation stages and eij = experimental error.
Results and discussion
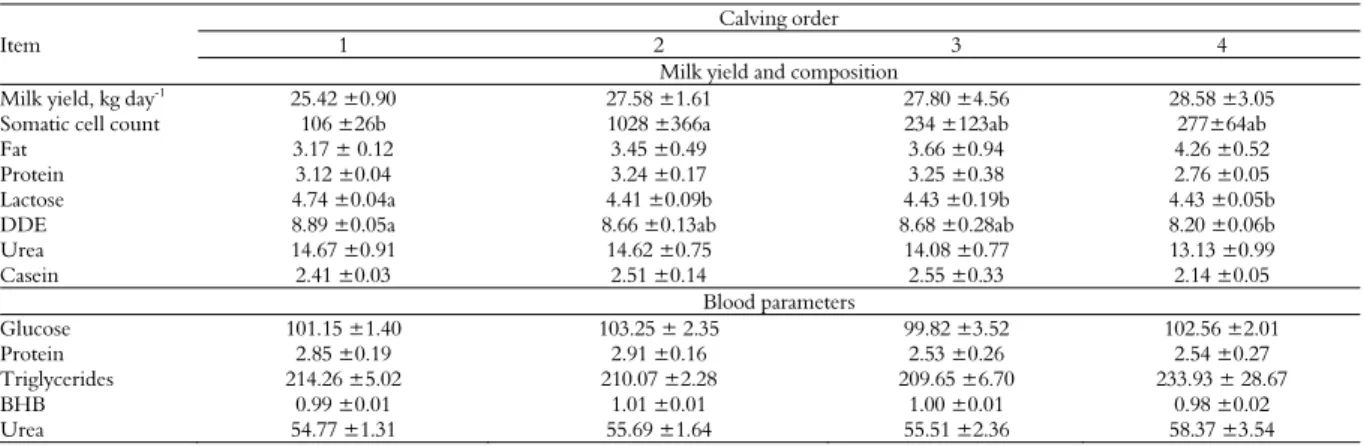
Table 1. Mean and standard error of milk yield (kg day-1), somatic cell count (SCC; cells x 1000 mL-1), and the contents of fat (%),
protein (%), lactose (%), defatted dry extract (DDE %), urea (mg dL-1) and casein (%) in the milk, and levels of glucose (mg dL-1), protein
(g dL-1), triglycerides (mg dL-1), beta-hydroxybutyrate (BHB; mmol L-1), and urea (mg dL-1 in blood of Holstein cows at 1 – 90 days of
lactation and different calving orders.
Item
Calving order
1 2 3 4
Milk yield and composition Milk yield, kg day-1
25.42 ±0.90 27.58 ±1.61 27.80 ±4.56 28.58 ±3.05
Somatic cell count 106 ±26b 1028 ±366a 234 ±123ab 277±64ab
Fat 3.17 ± 0.12 3.45 ±0.49 3.66 ±0.94 4.26 ±0.52
Protein 3.12 ±0.04 3.24 ±0.17 3.25 ±0.38 2.76 ±0.05
Lactose 4.74 ±0.04a 4.41 ±0.09b 4.43 ±0.19b 4.43 ±0.05b
DDE 8.89 ±0.05a 8.66 ±0.13ab 8.68 ±0.28ab 8.20 ±0.06b
Urea 14.67 ±0.91 14.62 ±0.75 14.08 ±0.77 13.13 ±0.99
Casein 2.41 ±0.03 2.51 ±0.14 2.55 ±0.33 2.14 ±0.05
Blood parameters
Glucose 101.15 ±1.40 103.25 ± 2.35 99.82 ±3.52 102.56 ±2.01
Protein 2.85 ±0.19 2.91 ±0.16 2.53 ±0.26 2.54 ±0.27
Triglycerides 214.26 ±5.02 210.07 ±2.28 209.65 ±6.70 233.93 ± 28.67
BHB 0.99 ±0.01 1.01 ±0.01 1.00 ±0.01 0.98 ±0.02
Urea 54.77 ±1.31 55.69 ±1.64 55.51 ±2.36 58.37 ±3.54
Different lowercase letters in the same row indicate significant differences at 5% of probability.
Cows at the second calving order did not meet current legislation. Animals at the first calving showed the lowest value of SCC compared to animals at the second calving order. Animals at the first calving have less contact with infectious agents, which confirms the lowest result of SCC (Pyörälä, 2008). Moreover, animals that had multiple lactations and consequently older age have higher chances of infection. However, the animals of the second calving presented higher SCC, presenting a high mastitis index in this group of animals.
The protein in milk ranged from 2.76 to 3.25, but these values were not significantly different from each other. First, second and third lactation animals comply with current Brazilian legislation, in which the fat content must be at least 3% and protein at least 2.9%, except for the animals at the fourth calving did not meet the requirement of 2.9% protein. Souza et al. (2010) reported that the calving order is an important source of variation in milk production of Holstein cows and it does not interfere on milk fat and protein content, as observed in this study.
The dried extract defatted in the first, second and third order of deliveries complied with the current legislation, which requires at least 8.4%, a fact that was not observed in fourth-order cows, differently from the results found by Milani et al. (2011), who concluded that the calving order did not influence milk composition of cows in a period over one hundred days post-calving.
The metabolic profile of cows at early lactation did not differ in relation to the calving order, similar to that registered by Milani et al. (2011), who concluded that the calving order did not influence the metabolic profile of cows in a period over an hundred days post-calving.
Animals exhibited no variations in BHB in relation to calving orders, indicating that these animals have not
undergone severe negative energy balance, especially primiparous animals. When there is energy deficiency, beta-hydroxybutyrate increases in the blood of animals (Ospina, Nydam, Stokol, & Overton, 2010). Thus, probably the diet of the animals in this study met the nutritional requirements in early lactation, period with greater requirements.
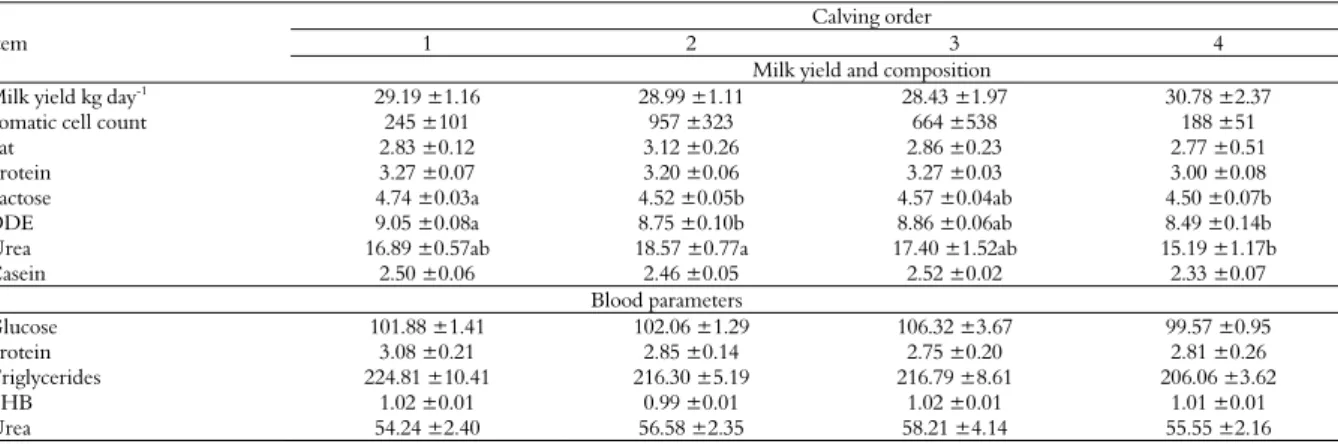
The milk production of the first, second, third and fourth calving animals did not vary significantly. Lactose content differed in cows between different calving orders in the middle lactation period (91-180 DIM; Table 2). Krolow, Silva, Paim, Medeiros, and Gonzalez (2012) reported that under normal conditions, lactose shows lower content at early and late lactation, following the behavior of milk yield, because it is related to the osmotic control of the mammary gland.
The deffated dry extract of animals presented variation at the different calving orders. However, all values were in compliance with current legislation.
Importantly, diet represents one of the largest costs, and excess protein excreted via milk results in economic waste. Moreover, the excess of urea in milk is related to a greater nitrogen excretion through feces and urine; this nitrogen elimination also means an energy expenditure for the animal, whereas an increase in the production of ammonia and urea decreases appetite, causing losses from the productive point of view and contributes as a contaminant element in the environment.
Milk protein and fat content did not differ between calving orders in middle lactation, similar to results found by Souza et al. (2010), who found no difference in the levels of fat and protein in the different calving orders. Primiparous cows may have produced more milk than second and third calves, depending on the diet provided.
indicators of milk quality, being represented by the sum of all solids, such as fat and protein, which were considered by the dairy industries as the components that generate income for dairy products where producers receive payment for the product delivered to industry (Aguiar et al., 2008). Taking into consideration the TDE, protein levels also had greater values in cows at the first calving, contributing to the increase in TDE. Otherwise, we have not found the same results relative to fat, wherein animals at the third calving had greater value.
The calving orders showed no difference in milk yield and SCC at the end of lactation, different from the results found by Souza et al. (2010), who reported that calving order had a significant effect on milk yield and somatic cell count.
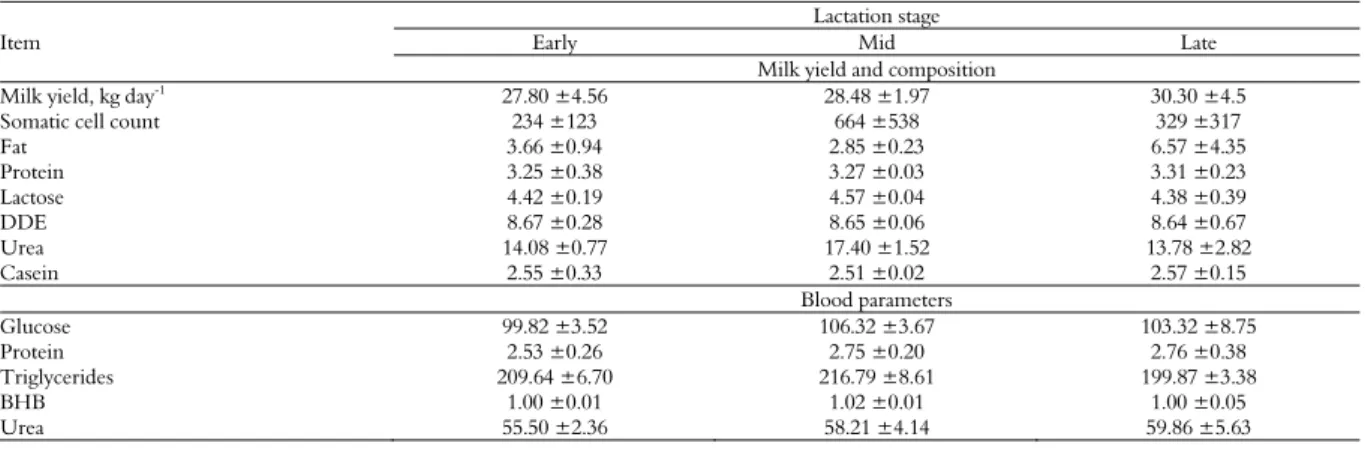
Primiparous cows in the middle and end of lactation showed greater milk yield compared to early lactation cows (Table 4).
Defatted dry extract content in the milk was greater in cows at the end of lactation compared to those at early lactation.
Animals in late lactation produced milk with greater content of casein when compared to early lactation animals.
Primiparous animals at the end of lactation had greater urea concentration compared to early-lactation cowss, different from the results of Roberts et al. (2012), who observed differences in milk urea value among lactation stages and the highest urea levels were observed in the group after 90 days of lactation.
The fat percentage decreased through lactation. Rossi et al. (2012) observed that as milk production advances, milk fat content decreases at each order of lactation.
Cows at the second calving order and end of lactation showed no change in the SCC and they did not present variations in relation to milk production (Table 5).
Once again, these results indicate that the diet met nutritional requirements for maintenance and production of the animals.
Table 2. Mean and standard error of milk yield (kg day-1), somatic cell count (SCC; cells x 1000 mL-1) and the contents of fat (%),
protein (%), lactose (%), defatted dry extract (DDE %), urea (mg dL-1
) and casein (%) in the milk, and levels of glucose (mg dL-1
), protein (g dL-1), triglycerides (mg dL-1), beta-hydroxybutyrate (BHB; mmol L-1) and urea (mg dL-1) in the blood of Holstein cows at 91 - 180
DIM and different calving orders.
Item
Calving order
1 2 3 4 Milk yield and composition
Milk yield kg day-1 29.19 ±1.16 28.99 ±1.11 28.43 ±1.97 30.78 ±2.37
Somatic cell count 245 ±101 957 ±323 664 ±538 188 ±51
Fat 2.83 ±0.12 3.12 ±0.26 2.86 ±0.23 2.77 ±0.51
Protein 3.27 ±0.07 3.20 ±0.06 3.27 ±0.03 3.00 ±0.08
Lactose 4.74 ±0.03a 4.52 ±0.05b 4.57 ±0.04ab 4.50 ±0.07b
DDE 9.05 ±0.08a 8.75 ±0.10b 8.86 ±0.06ab 8.49 ±0.14b
Urea 16.89 ±0.57ab 18.57 ±0.77a 17.40 ±1.52ab 15.19 ±1.17b
Casein 2.50 ±0.06 2.46 ±0.05 2.52 ±0.02 2.33 ±0.07
Blood parameters
Glucose 101.88 ±1.41 102.06 ±1.29 106.32 ±3.67 99.57 ±0.95
Protein 3.08 ±0.21 2.85 ±0.14 2.75 ±0.20 2.81 ±0.26
Triglycerides 224.81 ±10.41 216.30 ±5.19 216.79 ±8.61 206.06 ±3.62
BHB 1.02 ±0.01 0.99 ±0.01 1.02 ±0.01 1.01 ±0.01
Urea 54.24 ±2.40 56.58 ±2.35 58.21 ±4.14 55.55 ±2.16
Different lowercase letters in the same row indicate significant differences at 5% of probability. Percentages of urea in milk showed changes at the different calving orders. High urea content in milk indicates a diet with excess of protein and carbohydrates solved, principally because it is related to the low fat content in milk.
Table 3. Mean and standard error of milk yield (kg day-1), somatic cell count (SCC; cells x 1000 mL-1) and the contents of fat (%),
protein (%), lactose (%), defatted dry extract (DDE, %), urea (mg dL-1) and casein (%) in the milk, and levels of glucose (mg dL-1), protein
(g dL-1), triglycerides (mg dL-1), beta-hydroxybutyrate (BHB; mmol L-1) and urea (mg dL-1) in the blood of Holstein cows at over 180
DIM and different calving orders.
Item
Calving order
1 2 3
Milk yield and composition
Milk yield, kg day-1 28.57 ±1.78 27.03 ±3.16 30.30 ±4.5
Somatic cell count 805 ±693 501 ±187 329 ±317
Fat 2.79 ±0.27b 2.55 ±0.52b 6.57 ±4.35a
Protein 3.45 ±0.13 3.37 ±0.09 3.31 ±0.23
Lactose 4.73 ±0.10a 4.33 ±0.11b 4.38 ±0.39ab
DDE 9.25 ±0.20 8.73 ±0.15 8.64 ±0.67
Urea 19.68 ±1.86 16.82 ±1.89 13.78 ±2.82
Casein 2.65 ±0.10 2.61 ±0.06 2.57 ±0.15
Blood parameters
Glucose 103.56 ±2.84 101.10 ±2.87 103.78 ±8.75
Protein 3.14 ±0.34 2.12 ±0.26 2.76 ±0.38
Triglycerides 233.01 ±19.53 207.31 ±6.60 199.87 ±3.38
BHB 0.98 ±0.01 1.02 ±0.02 1.00 ±0.05
Urea 52.22 ±5.37 64.30 ±5.09 59.86 ±5.63
Milk yield in cows at the second (Table 5), third (Table 6) and fourth (Table 7) calving orders has not decreased during lactation, unlike
the results found by Rossi et al. (2012), who found that milk production decreased with advancing lactation.
Table 4. Mean and standard error of milk yield (kg day-1), somatic cell count (SCC; cells x 1000 mL-1) and the contents of fat
(%), protein (%), lactose (%), defatted dry extract (DDE, %), urea (mg dL-1) and casein (%) in the milk, and levels of glucose (mg
dL-1), protein (g dL-1), triglycerides (mg dL-1), beta-hydroxybutyrate (BHB; mmol L-1), and urea (mg dL-1) in the blood of
Holstein cows at the first calving order in early, middle, and end of lactation.
Item
Lactation stage
Early Mid End Milk yield and composition
Milk yield, kg day-1
25.42 ±089b 29.19 ±116a 28.57 ±178a
SCC 106 ±26 245 ±101 805 ±693
Fat 3.17 ±012 2.83 ±022 2.79 ±027
Protein 3.12 ±004b 3.27 ±012ab 3.45 ±012a
Lactose 4.74 ±004 4.74 ±003 4.73 ±009
DDE 8.89 ±005b 9.04 ±007ab 9.25 ±020a
Urea 14.66 ±091b 16.89 ±056ab 19.68 ±186a
Casein 2.41 ±003b 2.50 ±005ab 2.65 ±010a
Blood parameters
Glucose 101.15 ±140 101.88 ±141 103.56 ±284
Protein 2.85 ±019 3.08 ±020 3.14 ±034
Triglycerides 214.25 ±501 224.81 ±1130 233.01 ±1953
BHB 0.99 ±009 1.02 ±001 0.98 ±001
Urea 54.76 ±131 54.24 ±259 52.22 ±538
Different lowercase letters in the same row indicate significant differences at 5% of probability.
Table 5. Mean and standard error of milk yield (kg day-1), somatic cell count (SCC, cells x 1000 mL-1) and the contents of fat (%),
protein (%), lactose (%), defatted dry extract (DDE %), urea (mg dL-1) and casein (%), in the milk, and levels of glucose (mg dL-1) protein
(g dL-1), triglycerides (mg dL-1), beta-hydroxybutyrate (BHB; mmol L-1), and urea (mg dL-1) in the blood of Holstein cows at the second
calving order in early, middle, and end of lactation.
Item
Lactation stage
Early Mid End Milk yield and composition
Milk yield, kg day-1 27.58 ±1.61 28.99 ±1.11 27.03 ±3.16
Somatic cell count 1,028 ±366 957 ±323 501 ±187
Fat 3.45 ±0.49 3.11 ±0.26 2.55 ±0.52
Protein 3.24 ±0.17 3.19 ±0.06 3.37 ±0.09
Lactose 4.40 ±0.09 4.52 ±0.05 4.33 ±0.11
DDE 8.66 ±0.13 8.75 ±0.10 8.73 ±0.15
Urea 14.62 ±0.75b 18.57 ±0.77a 16.82 ±1.89ab
Casein 2.51 ±0.14 2.46 ±0.05 2.61 ±20.06
Blood parameters
Glucose 103.25 ±2.35 102.05 ±1.29 101.10 ±2.87
Protein 2.90 ±0.16a 2.85 ±0.14a 2.12 ±0.26b
Triglycerides 21.06 ±2.28 216.30 ±5.19 207.31 ±6.60
BHB 1.01 ±0.01 0.99 ±0.01 1.02 ±0.02
Urea 56.9 ±1.64 56.58 ±2.35 64.30 ±5.09
Different lowercase letters in the same row indicate significant differences at 5% of probability.
Table 6. Mean and standard error of milk yield (kg day-1), somatic cell count (SCC, cells x 1000 mL-1) and the contents of fat (%),
protein (%), lactose (%), defatted dry extract (DDE, %), urea (mg dL-1) and casein (%) in the milk, and levels of glucose (mg dL-1), protein
(g dL-1), triglycerides (mg dL-1), beta-hydroxybutyrate (BHB; mmol L-1), and urea (mg dL-1) in the blood of Holstein cows at the third
calving order in early, middle, and end of lactation.
Item
Lactation stage
Early Mid Late Milk yield and composition
Milk yield, kg day-1
27.80 ±4.56 28.48 ±1.97 30.30 ±4.5
Somatic cell count 234 ±123 664 ±538 329 ±317
Fat 3.66 ±0.94 2.85 ±0.23 6.57 ±4.35
Protein 3.25 ±0.38 3.27 ±0.03 3.31 ±0.23
Lactose 4.42 ±0.19 4.57 ±0.04 4.38 ±0.39
DDE 8.67 ±0.28 8.65 ±0.06 8.64 ±0.67
Urea 14.08 ±0.77 17.40 ±1.52 13.78 ±2.82
Casein 2.55 ±0.33 2.51 ±0.02 2.57 ±0.15
Blood parameters
Glucose 99.82 ±3.52 106.32 ±3.67 103.32 ±8.75
Protein 2.53 ±0.26 2.75 ±0.20 2.76 ±0.38
Triglycerides 209.64 ±6.70 216.79 ±8.61 199.87 ±3.38
BHB 1.00 ±0.01 1.02 ±0.01 1.00 ±0.05
Urea 55.50 ±2.36 58.21 ±4.14 59.86 ±5.63
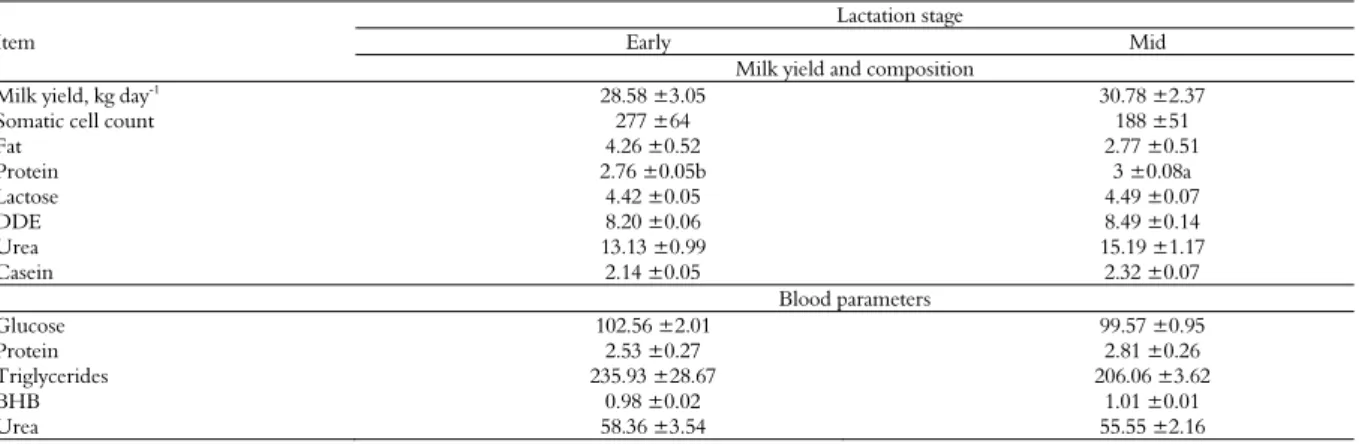
Table 7. Mean and standard error of milk yield (kg day-1), somatic cell count (SCC, cells x1000 mL-1) and the contents of fat (%), protein
(%), lactose (%), defatted dry extract (DDE, %), urea (mg dL-1) and casein (%) in the milk, and levels of glucose (mg dL-1), protein
(g dL-1), triglycerides (mg dL-1), beta-hydroxybutyrate (BHB; mmol L-1), and urea (mg dL-1) in the blood of Holstein cows at the fourth
calving order in early, middle, and end of lactation.
Item
Lactation stage
Early Mid Milk yield and composition
Milk yield, kg day-1
28.58 ±3.05 30.78 ±2.37
Somatic cell count 277 ±64 188 ±51
Fat 4.26 ±0.52 2.77 ±0.51
Protein 2.76 ±0.05b 3 ±0.08a
Lactose 4.42 ±0.05 4.49 ±0.07
DDE 8.20 ±0.06 8.49 ±0.14
Urea 13.13 ±0.99 15.19 ±1.17
Casein 2.14 ±0.05 2.32 ±0.07
Blood parameters
Glucose 102.56 ±2.01 99.57 ±0.95
Protein 2.53 ±0.27 2.81 ±0.26
Triglycerides 235.93 ±28.67 206.06 ±3.62
BHB 0.98 ±0.02 1.01 ±0.01
Urea 58.36 ±3.54 55.55 ±2.16
Different lowercase letters in the same row indicate significant differences at 5% of probability.
In cows at the fourth calving order, protein percentages increased during lactation, similar results were found by Rossi et al. (2012) who observed that the protein content increased during lactation. These results can be explained by the reduction in milk production at the end of lactation, causing the protein contents to remain more concentrated.
The cows in early lactation at the different calving orders and lactation stages showed no changes in blood glucose levels. This shows that the diet of these animals possibly met the increased demand.
There was no variation in total protein in blood of cows at different calving orders and stages of lactation, probably because these animals received a diet containing 14.5% protein.
Conclusion
Calving order in any lactation stage did not influence milk yield and blood biochemical profile in Holstein cows receiving the same diet. However, the calving order in all stages of lactation influenced the levels of protein, fat, DDE and SCC of the milk. Conversely, stages of lactation influenced milk yield and milk composition in Holstein cows.
References
Aguiar, A. C. R., Rocha-Júnior, V. R., Caldeira, L. A., Almeida-Filho, S. H. C., Ruas, J. R. M., Souza, V. M., ... Pires, D. A. A. (2008). Composição do leite de vacas alimentadas com diferentes fontes de compostos nitrogenados. Revista Brasileira Saúde Produção Animal,
16(3), 591-605.
Brasil. (2011). Instrução Normativa n° 62 de 29 de Dezembro de 2011. Brasília, DF: Ministério da Agricultura, Pecuária e Abastecimento, Departamento de Inspeção de Produtos de Origem animal.
Fievez, V., Colman, E., Castro-Montoya, J. M., Stefanov, I., & Vlaeminck, B. (2012). Milk odd- and branched-chainfatty acids as biomarkers of rumen function – An update. Animal Feed Science and Technology, 172(1-2), 51-65.
International Dairy Federation [IDF] 148-2. ISO 13366-2. (2006). Milk – Enumeration of somatic cells - Part 2: Guidance on the operation of fluoro-opto-electronic counters
(p. 15). Brussels, BE: ISO/IDF.
International Dairy Federation [IDF] 141C. ISO 9622. (2013). Determination of milk fat, protein and lactose content – Guidance on the operation of mid-infrared instruments (p. 15). Brussels, BE: ISO/IDF.
Krolow, R. H., Silva, M. A., Paim, N. R., Medeiros, R. B., & Gonzalez, H. L. (2012). Composição do leite de vacas Holandesas em pastejo de azevém com a utilização do trevo branco como fonte proteica. Arquivo Brasileiro de Medicina Veterinária e Zootecnia, 64(5), 1352-1359.
Milani, M. P., Nörnberg, J. L., Vargas, D. P., Scheibler, R. B., Milani, R. E., & Lohrentz, A. (2011). Caracterização da Composição Química do Leite e Condição Metabólica de Vacas Holandesas de Alta Produção e a Influência do Número de Lactações sobre Estes Parâmetros. Revista Cientifica Produção Animal, 13(1), 84-88.
Ospina, P. A., Nydam, D, V., Stokol, T., & Overton, T. R. (2010). Evaluation of nonesterified fatty acids and β -hydroxybutyrate in trasition dairy cattle in the Northeastern United States: Critical thresholds for prediction of clinical diseases. Journal of Dairy Science,
93(2), 546-554.
Pyörälä, S. (2008). Mastitis in post partum dairy cows.
Reproduction in Domestic Animals, 43(2), 252-259. Roberts, T., Chapinal, N., LeBlanc, S. J., Kelton, D. F.,
Rossi, A. P., Silva-Kazama, D. C., Lino-Lourenço, D. A., Santos, F. S., Santos, G. T., Damasceno, J. C., & Ribas-Neto, P. G. (2012) Composição e qualidade do leite em função da fase e ordem de lactação. Revista. Colombiana Cientifica Animal, 4(1), 4-23.
Silva, D. J., & Queiroz, A. C. (2002). Análise de alimentos: métodos químicos e biológicos. Viçosa, MG: UFV.
Silva, F. A. S. (2012). Sistema de Assistência Estatística – ASSISTAT versão 7.6 beta. Campina Grande, PB: Departamento de Engenharia Agrícola (DEAG), Universidade Federal de Campina Grande (UFCG). Souza, R., Santos, G. T., Valloto, A. A., Santos, A. L.,
Gasparino, E., Silva, D. C., & Santos, W. B. R. (2010). Produção e qualidade do leite de vacas da raça Holandesa em função da estação do ano e ordem de parto. Revista Brasileira Saúde Produção Animal, 11(2), 484-495.
Received on January 10, 2017. Accepted on March 23, 2017