GLUCONEOGENIC SUPPLEMENTS DO NOT AFFECT
PRODUCTION, REPRODUCTIVE TRAITS AND BLOOD
METABOLITE OF HOLSTEIN COWS DURING
THE TRANSITION PERIOD
Paulo Garcez de Oliveira1; Alexandre Vaz Pires1*; Paula Marques Meyer1; Ivanete Susin1; Elias Tunon Villarreta2; Paulo Henrique Mazza Rodrigues3; Flávio Augusto Portella Santos1
1
USP/ESALQ - Depto. de Zootecnia - C.P. 9 - 13418-900 - Piracicaba, SP - Brasil. 2
Fundação de Ensino Octávio Bastos - Depto. de Clínica e Cirurgia, Av. Dr Octávio Bastos, s/n - 13870-000 - São João da Boa Vista, SP - Brasil.
3
USP/FMVZ - Depto. de Nutrição e Produção Animal, C.P. 23 - 13630-000 - Pirassununga, SP - Brasil. *Corresponding author <[email protected]>
ABSTRACT: The use of gluconeogenic supplements for dairy cows during the transition period has produced contradictory responses in the literature, making it difficult to recommend them. The objective of this trial was to evaluate supplementation with propylene glycol (PG), calcium propionate (CP), and “Dairy Power Drench
” (DR) on the transitional period of Holstein cows. Parameters studied were variation of body condition score (BCS), body weight (BW), milk production (MP), reproductive efficiency and nonesterified fatty acid concentration (NEFA). One hundred and sixty five animals from two commercial herds were used. Treatments consisted of: C- Control; DR- administration of “Dairy Power Drench
” (3 applications) during postpartum; CP- daily administration of calcium propionate (500 g); PG- daily administration of propylene glycol (500 mL). Variation sources studied were the effect of treatments and blocks as function of farm and parity. No interaction between time (weeks) and treatments, or treatment effects, were found for BCS. However, there was a quadratic effect of time. Body weight and its variation were not affected by treatment nor by the time × treatment interaction. However, a quadratic effect of time was observed. An interaction time × treatment was observed on MP, but possible differences within each week were not detected. Treatments also did not affect reproductive efficiency parameters. On average, the number of days to first detected postpartum estrus was 69.5, with 2.23 services per conception and 172.6 days open. The mean concentration of nonesterified fatty acids was 376.6 mmol L-1 and no effect of the interaction time × treatment, or of treatment, was observed.
However, a linear effect was observed with time, with a decrease of 48.2 mmol L-1 per week.
Key words: propylene glycol, calcium propionate, dairy power drench, Holstein cow, reproductive efficiency
PRODUTOS GLICONEOGÊNICOS NÃO AFETAM RESPOSTAS
PRODUTIVAS, REPRODUTIVAS E SANGÜÍNEA DE VACAS
HOLANDESAS EM TRANSIÇÃO
RESUMO: O uso de produtos gliconeogênicos para vacas leiteiras no período de transição tem gerado respostas contraditórias na literatura, dificultando a sua recomendação. O objetivo deste experimento foi avaliar a suplementação de propileno glicol (PG), propionato de cálcio (PC) e “Dairy Power Drench
” (DR) no período de transição de vacas leiteiras sobre a variação do escore da condição corporal (ECC), peso vivo (PV), produção de leite (PL), eficiência reprodutiva e concentração plasmática dos ácidos graxos livres (AGL). Foram utilizadas 165 fêmeas de dois rebanhos comerciais. Os tratamentos foram: C- Controle; DR- 3 aplicações de “Dairy Power Drench
” no pós-parto; PC- 500 g diários de PC e PG- 500 mL diários de PG, até o 50º dia pós-parto, em média. As causas de variação estudadas foram efeito de tratamento e efeito dos blocos formados em função da fazenda e do número de partos. Não foi observado efeito de interação de tempo (semanas) × tratamento ou de tratamento sobre ECC. Entretanto, houve efeito quadrático de tempo. Para o PV e variação diária de PV não foi observado efeito dos tratamentos, nem interação entre tempo × tratamento. Entretanto, apresentaram efeito quadrático de tempo. Para PL, houve efeito de interação tempo × tratamento. Porém, dentro de cada semana, as possíveis diferenças não foram detectadas. Os tratamentos não afetaram os parâmetros de eficiência reprodutiva. Encontraram-se, em média, 69,5 dias para o aparecimento do primeiro cio, 2,23 serviços por concepção e 172,6 dias para o período de serviço. As concentrações médias dos AGL foram de 376,6 mmol L-1, não se observando efeitos de tempo × tratamento ou de tratamento. Porém, apresentaram
efeito linear de tempo, decrescendo 48,2 mmol L-1 por semana.
INTRODUCTION
Milk production in recent decades has experi-enced marked increases as a result of intense genetic se-lection, advances in nutritional management, improve-ments in disease control, and other management practices (Miyoshi et al., 2001). The globalization of the economy has facilitated the commercialization of semen, embryos, and animals, and this has contributed to increase the world milk production, especially regarding genetic ma-terials of Canadian and American origin (Philipson, 1990). A few basic points to observe to achieve high ef-ficiency in intensive production systems are the use of specialized animals, and sanitary, nutritional and repro-ductive management practices as near as possible to the ideal, thus offering adequate comfort conditions, so the animals can respond with high yields. Management, in addition to the environment are the main causes of varia-tion in reproducvaria-tion and milk yield (Nebel & McGillard, 1993); milk production and reproductive performance play the most relevant roles in determining the profitabil-ity of dairy herds (Arbel et al., 2001).
Cow’s efficiency in the subsequent lactation is determined during the transition period, and problems dur-ing this period result in losses from 4.5 to 9.0 kg day-1 in
the peak of lactation, representing economic losses of U$300 to U$600 per lactation under consideration (Drackley, 1999). The transition period, according to Schlatter (1997), varies from three weeks before calving to different postpartum periods. This postpartum period may vary from three weeks or until the cow reaches lac-tation peak, with variations according to the management adopted for the animal. This period is characterized by great metabolic stress, and manifested by a decrease in voluntary feed intake, intense mobilization of body re-serves, and increase in nutritional requirements, with con-sequences in yield and reproduction.
Nonesterified fatty acids (NEFA) are the main source of energy during the end of gestation and the be-ginning of lactation. Its concentrations in the plasma obey a growing pattern starting on the third prepartum week, with a peak near calving, decreasing through lactation (Drackley, 1998).
On the other hand, serum insulin concentrations follow an inverse pattern, decreasing considerably as calving approaches (Studer et al., 1993). Therefore, feed-ing the cow durfeed-ing this period is a challenge, since this stage is marked by endocrine changes, responsible for preparing the cow for the final growth of the fetus, calv-ing, and lactogenesis (Grummer, 1995).
Even though a well-balanced diet may reduce problems in the transition period, the program can be compromised if a decrease in intake occurs, which leads
to dietary deficiencies in energy and other nutrients. In this context, forced oral administration of nutrients could be a useful tool to increase blood concentrations of cal-cium, minimize energy deficiency, rehydrate the animal and stimulate ruminal fermentation (Stokes & Goff, 2001). Studer et al. (1993) demonstrated that the admin-istration of energy supplementation in the transition pe-riod reduced the plasma concentrations of ketone bodies and FFA, and increased the concentrations of insulin, dur-ing the supplydur-ing period.
Researches have been conducted to find energy alternatives that would diminish the energy deficiency in the transition period, allowing the animals to show yields and reproduction compatible with their potential. In this sense, the use of plant and animal fats, propylene glycol, sodium propionate, calcium propionate, and ionophores have been evaluated. Another alternative has been the use
of “Dairy Power Drench
”, even though no literature data is available about this product.
Therefore, the objective of this study was to evaluate organic responses to the use of neoglycogenic substances on physical condition, yield, reproduction, and blood parameter, when administered daily and orally to dairy cows, from two weeks before the estimated calv-ing date until seven weeks postpartum (calcium propi-onate and propylene glycol), and three postpartum appli-cations, on consecutive days, beginning on the calving
day (Dairy Power Drench
).
MATERIAL AND METHODS
Trials were carried out at two commercial doing farms (Holstein), located Araras (Farm 1) and Engenheiro Coelho (Farm 2), State of São Paulo, Brazil. One hun-dred and sixty five purebred and crossbred Holstein ani-mals, 132 cows and 33 heifers, with calvings between March 15 and June 15, 1999 were used. Data collection extended from March 15 to August 12, 1999. Animals were managed under “free-stall” feedlot systems and to-tal mixed ration (TMR) programs. Animals were not sepa-rated from the others and the management system adopted by each property was obeyed.
Experimental treatments consisted of a control and three application protocols:
Treatment 1 (control) - this group consisted of
31 cows and ten heifers submitted to the same manage-ment conditions as the animals that received the treat-ments.
Treatment 2 - oral administration of “Dairy
Power Drench1” to 42 animals (31 cows and 11 heifers),
which received the treatments according to the manufacturer’s recommendations: three applications, the first on the day of calving and the other two on the two
consecutive days. The product, sold in 500 g packs, was diluted in 25 to 30 liters of warm water and administered orally with a feeding catheter. Product composition, ac-cording to the manufacturer, is: yeast (Yea-Sacc), calcium carbonate, sodium bicarbonate, potassium chloride, co-balt sulfate, magnesium sulfate, chelated chromium, B-complex vitamins, propylene glycol, dextrose, and flavorants.
Treatment 3 - daily oral administration of
propy-lene glycol (500 ml day-1) to 43 animals (33 cows and ten
heifers), from thirteen days before the estimated calving date until 49 days postpartum. Administration was done with the help of an extra person, always in the morning.
Treatment 4 - daily oral administration of 500 g
calcium propionate to 39 animals (37 cows and two heif-ers), from 11 days before the estimated calving date un-til 51 days postpartum. The 500 g of product were placed in 1-L glass bottles and the volume was completed to 1 L, agitated to homogeneize the mix and provided to the animals at the same times as in the previous group. Obs.: in this group two heifers died and one cow had health problem due to product aspiration.
Body condition score (BCS) was evaluated weekly, with a scale from 1 (thin) to 5 (obese) 0.25 point intervals were adopted (Wildman et al., 1982). Body score variation was obtained from the difference between BCS in week six and week one for each animal.
Body weight was determined with a weight tape, on the same day as the body condition evaluation, always by the same person, to avoid possible assessor interfer-ences. Body weight variation was obtained from the dif-ference between weight in the 6th and 1st weeks for each
animal. The daily variation in body weight corresponds to the daily weight loss during the experimental period. Animals were milked three times a day and milk yield was measured individually once a week for all animals.
Blood was sampled once a week in “vacuntainer” tubes, containing potassium oxalate and sodium fluoride, for nonesterified fatty acid (NEFA) determination. Samples (n=2) were placed in an isothermal box until they arrived at the centrifugation site, which took approxi-mately 3 hours, and were then centrifuged at 3000 × g for 20 minutes. Plasma was placed in Eppendorf tubes, (n=2) and stored in freezer at -20°C for later analysis. Chemical analyses of nonesterified fatty acids were per-formed with the NEFA C KIT (WAKO Chemicals, Code no. 994-75409E). This test is based on the colorimetric enzymatic method (D.L. Palmquist, 1999; personal com-munication) adapted for use with microtitration plates, and later reading on an “Elisa Reader” device, with a 550 nm filter, results presented as micromoles per liter.
Number of days to first postpartum estrus, days open, and number of services per conception were also evaluated. Heat was detected twice a day by visual ob-servation.
Samples of TMR were collected monthly, and at every two collections a sample was taken and stored at -18°C for later chemical analysis, which was performed in the chemical analysis laboratory of AGRIBRANDS; the DM, CP, EE, CF, ash, Ca and P analyses were performed according to AOAC (1985); the NDF and ADF analyses were performed according to Van Soest et al. (1991). Chemical composition of diets is presented in Table 1.
Data were submitted to analysis of variance, with separation, as causes of variation, of the treatment effects and effects of blocks formed as a function of farm (Farm 1 and 2) and number of calvings (primiparous or multi-parous). Analyses corresponding to milk yield values, body condition scores, body weight, daily variation of body weight, and nonesterified fatty acids were performed as previously described, but added of split-plot in time factor (weeks), corresponding to the several weekly data collection moments. Probabilities of interactions with time were determined by the Greenhouse-Geisse test, us-ing the “REPEATED” command generated by the GLM procedure (PROC GLM) (SAS Institute Inc., 1985). Analyses by time were only performed when interactions between time and treatments were significant. The time effect evaluation within each treatment was performed by regression, using polynomial contrasts (PROC GLM). In the presence of linear or quadratic effects, the correspond-ing regression equation and coefficient of determination (R2) were obtained. In the presence of treatment effects,
comparisons among treatment means were made by Tukey’s test. A 5% significance level was used in all tests performed.
RESULTS AND DISCUSSION
No interaction was found between farm and treat-ment in any of the studied variables. No interaction was observed between treatment and time for the body
con-Table 1 - Nutritional composition of diets at Farms 1 and 2, based on dry matter.
n o i t i s o p m o
C Farm1 Farm2
% r e t t a m y r
D 51.65 44.45
n i e t o r p e d u r
C 16.96 17.08
t c a r t x e r e h t
E 4.76 4.58
r e b i f e d u r
C 17.65 17.13
r e b i f t n e g r e t e d d i c
A 20.89 21.0
r e b i f t n e g r e t e d l a r t u e
N 36.34 39.1
h s
A 6.0 6.63
a
C 0.9 0.81
P 0.32 0.29
e v i t c a r t x e e e r f -n e g o r t i
N 54.65 54.59
s t n e i r t u n e l b i t s e g i d l a t o
dition score variable. However, there was a quadratic ef-fect of time on BCS (P=0.0001) (Table 2 and Figure 1).
The equation was: BCS=3.433 - 0.135 week + 0.0118 week2, and the point of inflexion of the curve was
ap-proximately the 40th day, or 6th week postpartum.
BCS for the group treated with propylene glycol was 3.0. This result is similar to the 3.11 value found by Fonseca (1997), who used only 15 doses of 300 mL pro-pylene glycol, in daily administrations (from the fourth day prepartum until calving) and on alternate days (from the 10th to the 6th day prepartum and from calving to the
16th day postpartum). Studer et al. (1993) also found
simi-lar results (BCS of 3.1) to those obtained in the present experiment for cows that received 1 L PG, daily, during the 7 days that preceded the estimated calving date. Like-wise, Juchem (2000) provided a 300 mL dose daily and the animals showed a BCS of 3.13 in the sixth week of lactation, but showed higher milk yields (31.2 kg) than animals in this trial. Perhaps the use of a smaller amount of propylene glycol might result in the same gluconeogenic effect, according to results obtained by Grummer et al. (1994), or maybe higher PG doses could decrease dry mat-ter intake, according to Christensen et al. (1997).
Although the BCS data are different in different experiments, Gearhart et al. (1990) define the ideal body condition for cows at each lactation stage as that which optimizes milk yield, minimizes health problems and re-productive disorders, and maximizes the economic return of the farm. The ideal management for the cow during the transition period is one where calving occurs under good body condition, the incidence of fatty liver is re-duced, dry matter intake is maximized, negative energy balance is not marked, and functions and reproductive efficiency are not reduced (Grummer, 1995).
Also, no difference (P=0.7774) was verified in
body condition variation among treatments during the experimental period (Table 2). On average, the cows lost 0.28 body score unit. Therefore, considering that loss of one unit represents 84 kg on body weight reduction (NRC, 2001), cows lost approximately 23.5 kg in 49 days after calving. The BCS for cows treated with calcium pro-pionate was 3.2 at the end of the trial; this represents a 0.30 unit decrease when compared with the initial week, while Aslup & Schlatter (1998) obtained a 0.22 decrease, despite the fact that those authors only used 114 g of the same product.
Weight loss did not differ (P=0.8698) among
treatments (Table 3 and Figure 1), and no effect of the time and treatments interaction was observed (P=0.8223).
However, body weight showed a quadratic effect of time
(P=0.0001), as follows: BW=571.952 – 15.207 week +
1.3729 week2, the inflexion point of the curve occurring
approximately on the 39th day or in the 6th and a half week
after calving.
Mean cow’s weight during the experimental pe-riod, considering all treatments, was 539.6 kg (558.2 in the beginning and 530.2 kg at the end). These results con-cerning weight loss are in agreement with Butler & Canfield (1989), who stated that in the beginning of lac-tation the energy from feed intake is smaller than main-tenance and production requirements. This is why cows with a high milk yield use their body reserves to supply such deficiencies, resulting in weight and body condition losses.
Cows that are obese at calving mobilize more body reserves during postpartum, because they are sub-mitted to a more severe negative energy balance (Rukkwamsuk et al., 1998). During this stage, the use of
Table 2 - Effects of treatments on body condition score and its variation during the experimental period.
t n e m t a e r T
k e e
W C DR CP PG Mean SEM P
e r o c S
1 3.3 3.4 3.3 3.2 3.3 0.029 0.2886
2 3.2 3.3 3.2 3.1 3.2 0.027 0.2676
3 3.1 3.2 3.2 3.0 3.1 0.027 0.1281
4 3.1 3.2 3.1 3.0 3.1 0.027 0.0719
5 3.0AB 3.2A 3.1AB 3.0B 3.1 0.024 0.0097
6 3.0 3.1 3.1 3.0 3.0 0.024 0.0751
n a e
M 3.1A 3.2A 3.2A 3.0A 3.1 0.011 0.0752
M E
S 0.024 0.022 0.021 0.022
n o i t a i r a
V - 0.26 - 0.26 - 0.30 - 0.30 - 0.28 0.021 0.7774
M E
S 0.036 0.046 0.045 0.039
Effects of treatment × time: P=0.7754; time: P=0.0001; linear: P=0.0001; quadratic: P=0.0001
C=control; DR=”drench”; CP=calcium propionate; PG=propylene glycol; SEM=standard error of mean; P=statistic probability; Variation=BCS difference between week 6 and week 1.
body reserves is indispensable to maintain milk yield until the requirements are completely fulfilled by feed intake. Energy that comes from lipid mobilization can represent up to 33% of the energy used for milk synthesis (Moe, 1965). Komaragiri & Erdman (1997) observed an aver-age mobilization of 54 kg fat and 21 kg protein in Hol-stein cows, from 2 weeks prepartum until the 5th week of
lactation. In another study, Holcomb et al. (2001) seved postpartum weight losses of 38 kg for animals that, dur-ing the prepartum period, consumed concentrate diets in a restricted manner; therefore, those losses were almost 100% above the mean values observed in this experiment, even though their results were based on different diets and without energy supplementation.
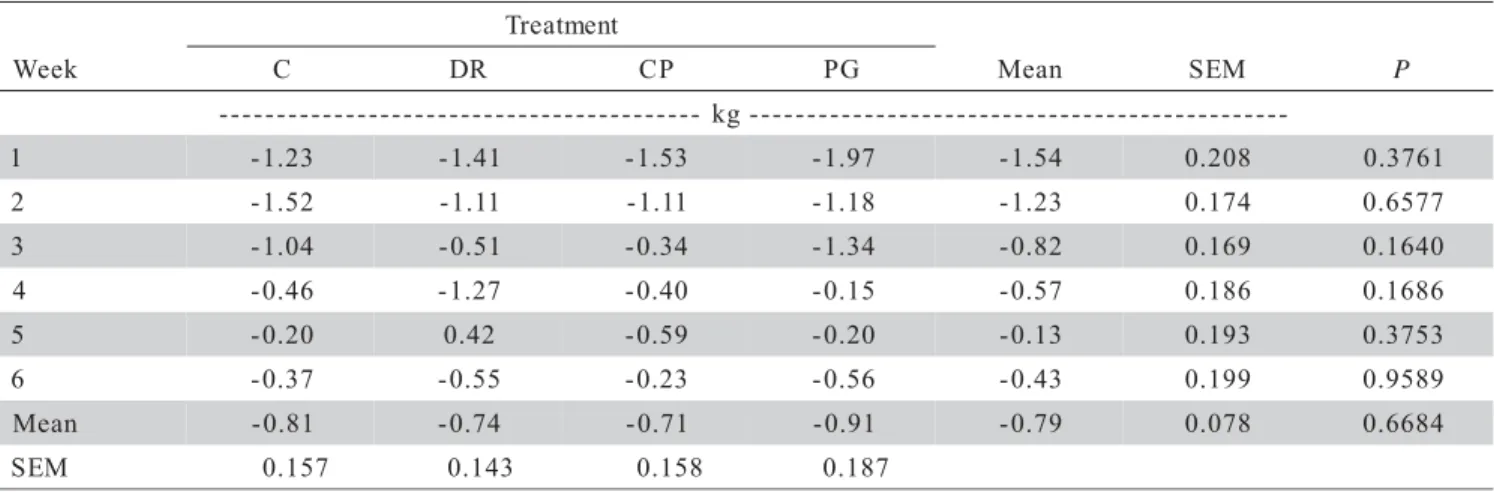
On average, cows lost 0.79 kg day-1 during the
entire experimental period (Table 4 and Figure 1). For this variable, no interaction between time and treatment (P=0.6252), nor a treatment effect (P=0.6684), was ob-served. However, a quadratic effect of time (P=0.0375) was verified on this variable, with the following equa-tion: weight variation = -2.180 + 0.6218 week –0.0515 week2. The inflexion point of this curve was verified
ap-proximately on the 42nd day, or the 6th week postpartum.
Buckley et al. (2000) observed that cows with high (28.2 kg) and medium (25.0 kg) genetic merits for milk yield experienced weight losses of 0.80 and 0.65 kg day-1, from the first to the fourth lactation week,
respec-tively, which corresponds to approximately 22.4 kg for the first group and 18.2 kg for the second; these values are quite near to those obtained in this experiment.
Cows produced, on average, 27.3 kg milk day-1
(Table 5 and Figure 1) during the experiment, starting at 23.0 kg and finishing in the sixth week at 29.7 kg. An interaction was verified between the main factors, time and treatment (P=0.0076), for the variable under consid-eration. However, within each week, the analysis of vari-ance did not detect any differences (Table 5 and Figure 1).
As time passed, yield increases were 12.5% in the second week relative to the first, 6.1% in the third week relative to the second, and so, with values of 3.8%, 3.4%, and 0.8% (Table 5). The control, “Drench”, and propy-lene glycol treatments showed a linear effect of time (P=0.0001), and yield increases of 1.355, 1.337 and 0.999 kg were observed at each week, respectively. In turn, the calcium propionate treatment showed a quadratic effect with time (P=0.0072).
Mean daily milk yield of animals supplemented with PG in this experiment was 26.5 kg, which is lower than the 31.2 kg found by Miyoshi et al. (2001), who sup-plied the animals with the same PG dose (500 mL). Stokes & Goff (2001) obtained mean values of 39.7, 41.1, and 42.8, for control, calcium propionate, and propylene glycol groups, respectively, using only two 300 mL PG doses and two 680 g calcium propionate doses.
Figure 1 - Effect of treatments on body condition score (BCS), body weight and daily weight variation, milk yield, and nonesterified fatty acid concentration during the experimental period.
-2.5 -2 -1.5 -1 -0.5 0 0.5 1
1 2 3 4 5 6
Postpartum week
Body
weight
variation
(kg)
Control Drench Calcium Propionate Propylene Glycol
2.90 3.00 3.10 3.20 3.30 3.40 3.50
1 2 3 4 5 6
Potspartum week
BCS
Control Drench Calcium Propionate Propylene Glycol
520 530 540 550 560 570
1 2 3 4 5 6
Postpartum week
Body
weight
(kg)
Control Drench Calcium Propionate Propylene Glycol
20 22 24 26 28 30 32 34
1 2 3 4 5 6
Postpartum week
Milk
yield
(kg)
Control Drench Calcium Propionate Propylene Glycol
200 300 400 500 600
1 2 3 4 5 6
Postpartum week
NEF
A
concentration
(mmol
L
)
Control Drench Calcium Propionate Propylene Glycol
Table 5 - Effects of treatments on milk yield during the experimental period.
Effects of treatment × time: P=0.0076; time: P=0.0001; linear: P=0.0001; quadratic: P=0.0019
C=control; DR=”drench”; CP=calcium propionate; PG=propylene glycol; SEM=standard error of mean; P=statistic probability.
t n e m t a e r T k e e
W C DR CP PG Mean SEM P
-g k
-1 23.2 22.6 23.2 27.1 23.0 0.538 0.9229
2 25.5 24.9 27.7 25.6 25.9 0.566 0.7539
3 27.9 25.9 29.7 26.6 27.5 0.547 0.2437
4 29.0 27.0 30.6 27.5 28.5 0.532 0.2494
5 30.4 28.7 31.0 28.1 29.5 0.540 0.3075
6 29.5 29.5 31.7 28.4 29.7 0.551 0.3500
n a e
M 27.6 26.4 29.0 26.5 27.3 0.235 0.5843
M E
S 0.530 0.474 0.450 0.398
Table 4 - Effects of treatments on the daily variation in body weight during the experimental period.
Effects of treatment × time: P=0.6252; time: P=0.0001; linear: P=0.0001; quadratic: P=0.0375
C=control; DR=”drench”; CP=calcium propionate; PG=propylene glycol; SEM=standard error of mean; P=statistic probability.
t n e m t a e r T k e e
W C DR CP PG Mean SEM P
-g k
-1 -1.23 -1.41 -1.53 -1.97 -1.54 0.208 0.3761
2 -1.52 -1.11 -1.11 -1.18 -1.23 0.174 0.6577
3 -1.04 -0.51 -0.34 -1.34 -0.82 0.169 0.1640
4 -0.46 -1.27 -0.40 -0.15 -0.57 0.186 0.1686
5 -0.20 0.42 -0.59 -0.20 -0.13 0.193 0.3753
6 -0.37 -0.55 -0.23 -0.56 -0.43 0.199 0.9589
n a e
M -0.81 -0.74 -0.71 -0.91 -0.79 0.078 0.6684
M E
S 0.157 0.143 0.158 0.187
Table 3 - Effects of treatments on body weight and its variation during the experimental period.
Effects of treatment × time: P=0.8223; time: P=0.0001; linear: P=0.0001; quadratic: P=0.0001
C=control; DR=”drench”; CP=calcium propionate; PG=propylene glycol; SEM=standard error of mean; P=statistic probability; Variation=weight difference between week 6 and week 1
t n e m t a e r T k e e
W C DR CP PG Mean SEM P
-g k
-1 554.6 555.0 563.9 559.5 558.2 5.338 0.7567
2 546.0 545.1 553.2 543.5 546.8 5.418 0.7374
3 535.3 537.4 545.5 537.8 538.9 5.476 0.7282
4 528.0 533.8 543.1 528.4 533.2 5.428 0.7893
5 524.8 524.9 540.3 530.7 530.0 5.413 0.9353
6 527.0 527.9 537.2 529.3 530.2 5.295 0.7924
n a e
M 536.0 537.3 547.2 538.3 539.6 2.221 0.8698
M E
S 4.515 5.181 3.546 4.243
n o i t a i r a
V -31.2 -27.1 -29.1 -30.7 -29.5 2.141 0.9048
M E
Similar results as those obtained in the present experiment were found by Studer et al. (1993) and Juchem (2000); their results did not show a PG effect, when supplied in the prepartum period, on milk yield. However, Fonseca (1997) observed higher milk yields only in the fourth and fifth lactation weeks for cows that received PG pre and postpartum. Sauer et al. (1973) and Formigoni et al. (1996) showed that a potential benefit conferred by PG would be expressed in a more consis-tent way under risk situations, as is the case with cows having an extreme body condition, a fact that did not oc-cur in this experiment.
With regard to plasma concentrations of nonesterified fatty acids, no interaction of effects time ×
treatment was observed (P=0.4791). Supplying of
“drench”, calcium propionate, and propylene glycol did not affect this variable (P=0.4298). However, there was a linear effect of time effect (P=0.0001) (Table 6 and Fig-ure 1).
Mean NEFA concentration during the experimen-tal period was 376.6 mmol L-1. In the week prior to
calv-ing, cows showed, on average, 420 mmol L-1 NEFA. In
the first week postpartum, however, mean NEFA
concen-tration increased to 474.7 mmol L-1. Mean NEFA value
during the experiment decreased by 41% in the 5th week
postpartum, relatively to the first week, with a reduction of 48.24 mmol L-1 per week.
Peripartum period is marked by striking alter-ations, some of which are medium-term, as is the case with blood concentrations of NEFA (weeks). Nonesterified fatty acids is the main energy source dur-ing the end of gestation and beginndur-ing of lactation (Drackley, 1998), acting as a glucose-saving mechanism, i.e., the peripheral tissues use NEFA rather than glucose and amino acids. Plasma concentrations of NEFA follow a growing pattern starting on the third prepartum week, with a peak near calving, decreasing through lactation. Values obtained in this study are within the limits found by other researchers. Vasquez-Añon et al. (1994) found
t n e m t a e r T
k e e
W C DR CP PG Mean SEM P
L l o m m
-- -1-------------------------------------------
-1 521.0 464.7 470.6 440.8 474.7 18.044 0.3118
2 449.9 433.3 428.2 369.0 420.0 15.742 0.3186
3 377.9 405.0 386.1 352.8 380.4 15.030 0.9228
4 317.5 385.7 331.2 274.0 327.1 15.051 0.1791
5 291.6 312.7 267.2 248.0 279.9 11.369 0.4900
n a e
M 392.2 401.3 374.4 338.4 376.6 7.218 0.4298
M E
S 14.832 14.262 12.605 11.084
Table 6 - Effects of treatments on the concentrations of nonesterified fatty acids during the experimental period.
Effects of treatment × time: P=0.4791; time: P=0.0001; linear: P=0.0001; quadratic: P=0.1471
C=control; DR=”drench”; CP=calcium propionate; PG=propylene glycol; SEM=standard error of mean; P=statistic probability.
300 mmol L-1 on day -10 from calving, and 1014, 700,
445, 320, and 300 mmol L-1 on days zero, five, 10, 20,
and 25 postpartum, respectively.
Staples et al. (1990) did not find interaction ef-fect between time and treatment, and observed a decrease in NEFA concentrations from the first week in relation to the ninth, with values of 612 mmol L-1 and 237 mmol
L-1, respectively. In the same experiment, those authors
related the effect of NEFA concentrations on ovarian ac-tivity and observed that NEFA concentrations were not a good indicator of energy status. Juchem (2000) did not find a PG effect (300 mL), nor a treatment × time inter-action, on the NEFA concentrations in the pre and post-partum periods, when the product was supplied in the prepartum period. Then again, Fonseca (1997) did not observe a PG effect during the prepartum period and the beginning of lactation (300 mL), on the concentrations of NEFA and glucose, and on the incidence of subclini-cal ketosis. However, Studer et al. (1993) demonstrated a decrease in FFA during prepartum and a reduction ten-dency in the postpartum, by supplying 1 L PG per day during prepartum. Waldo & Schultz (1960) concluded that the hyperglycemic effect of PG was a consequence, for the most part, of its intact absorption and, to a lesser ex-tent, of the production of propionic acid, and therefore it was an excellent alternative for treating clinical cases of ketosis.
Goff et al. (1996), supplying calcium propionate at calving and after 12 hours, observed a smaller concen-tration of NEFA 24 hours after calving in Jersey cows, but not in Holstein cows. However, its application re-duced the occurrence of milk fever and subclinical hy-pocalcemia in both breeds, in herds where those problems occurred.
which were relatively low when compared with other ex-periments. Similarly, no animals were diagnosed with milk fever.
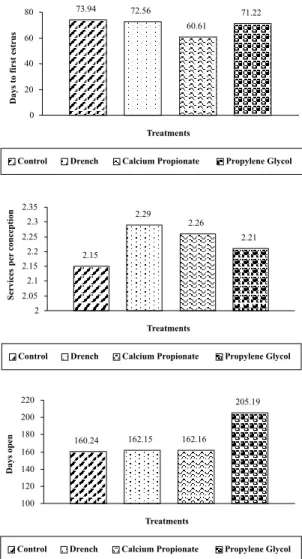
There were no differences between treatments (P=0.7399) with regard to the first detectable postpartum estrus. On average, cows showed the first estrus at 69.5 days postpartum (Table 7 and Figure 2). This result was superior to that obtained by Thatcher & Wilcox (1973), of 43 days, and by Miyoshi (1995), who found 53.1 days for animals that received 500 mL propylene glycol, and 56.8 days for animals in the control group. Likewise, Jorritsma et al. (2000) observed a 54.1 day interval for the first estrus, without administration of energy supple-ments.
In Brazil, Fonseca (1997) recorded a mean value of 40.33 days for the first estrus in animals with normal concentrations, and of 51.6 days in animals with acetone-mia; these are values still lower than the 69.5 days found in this trial. However, that author did not find a PG ef-fect on that variable, either. More expressive results, but also inferior than those found in the present study, were recorded by Juchem (2000), with means of 22.2 days un-til the first ovulation for animals that received propylene glycol, and 18.6 days for animals in the control group, detected by ultrasound. Also, the observed percentages of anestrus cows were 7% and 24%, for PG and the con-trol, respectively. The difference, however, was not sig-nificant, suggesting that under adequate management con-ditions the potential benefit of this additive could be small, therefore making its use unviable due to its high cost. Nevertheless, Formigoni et al. (1996) found smaller percentages of anestrus cows (30 and 58%) at 90 days of lactation for cows receiving PG at pre and postpartum.
t n e m t a e r T
e l b a i r a
V C DR CP PG Mean SEM P
s y a d
1stestrus 73.9 72.6 60.6 71.2 69.5 2.790 0.7399
M E
S 6.087 5.146 4.607 6.388
n 35 39 38 37
n o i t p e c n o c r e p s e c i v r e S
C /
S 73.9 72.6 60.6 71.2 69.5 2.790 0.7399
M E
S 6.087 5.146 4.607 6.388
n 35 39 38 37
s y a d
n e p o s y a
D 160.2 162.2 162.2 205.2 172.6 11.556 0.8874
M E
S 23.406 16.958 19.128 30.886
n 29 33 32 32
Table 7 - Effect of treatments on number of days to the first estrus, service per conception, and days open during the experimental period.
C=control; DR=”drench”; CP= calcium propionate; PG= propylene glycol; SEM= standard error of mean; P= statistic probability, 1st
estrus= number of days to the first estrus; S/C= number of services per conception; Days open= number of days open; n= number of samples for each variable.
Figure 2 - Effects of treatments on the number of days to first estrus, number of services per conception, and number of days open.
2.15
2.29
2.26
2.21
2 2.05 2.1 2.15 2.2 2.25 2.3 2.35
Treatments
S
ervi
ces
con
cep
ti
on
Control Drench Calcium Propionate Propylene Glycol
per
73.94 72.56
60.61
71.22
0 20 40 60 80
Treatments
Days
to
fi
rst
estru
s
Control Drench Calcium Propionate Propylene Glycol
160.24 162.15 162.16
205.19
100 120 140 160 180 200 220
Treatments
Days
open
Mean number of services per pregnancy was 2.2, with no difference (P=0.9342) among treatments (Table 7 and Figure 2). Lower values were found by Miyoshi (1995), of 1.7 service per conception (S/C), in animals also supplemented with 500 mL of propylene glycol. Higher values than those obtained in this experiment were found by Smith & Wallace (1998), with 2.7 S/C for cows that cycled before postpartum day 21; by Heuwieser et al. (1994), with 3.3 services per conception in animals with less days for the first service and lower yields; and by Foote & Riek (1999), with 2.6 services per concep-tion for cows showing some reproductive problem.
The number of services per conception is a vari-able that results from a done heat verification, a well-conducted and successful insemination, a good fertiliza-tion rate and a low early embryonic death rate (Ayalon, 1978). The number of services per conception obtained in this experiment was relatively high, since a S/C value of 2.0 is considered normal or acceptable. The higher value obtained (2.3) could be due to an association of the factors mentioned above, and to the fact that repeat breeder cows were not excluded in the statistical analy-sis.
On average, in this experiment, number of days open was 172.6 (Table 7 and Figure 2). This variable was not affected (P=0.8874) by the treatments. Smaller num-ber of days open (95.5 days) was found by Miyoshi (1995) for a cow group receiving 500 mL of propylene glycol (111.5 days for the control group). In a survey con-ducted in four farms, Heuwieser et al. (1994) found 148.7, 111.5, 120.6, and 104 days open. In Brazil, during a sur-vey conducted at Zona da Mata (Forest Zone) in Minas Gerais, Ferreira et al. (1984) verified a mean of 240 days open in 1,634 cows without supplementation. Current re-production data indicate that heat detection problems might have occurred in those farms.
REFERENCES
ARBEL, R.; BIGUN, Y.; EZRA, E.; STURMAN, H.; HOJMAN, D. The effect of extended calving intervals in high – yielding lactating cows on milk production and profitability. Journal of Dairy Science, v.84, p.600–608, 2001.
ASLUP, D.; SCHLATTER, L. Parity differences in a controlled nutrocal study in a California dairy. Des Moines: Kemin Industries 1998. p.1-4 (Technical Information).
ASSOCIATION OF OFFICIAL ANALYTICAL CHEMISTS. Official methods of analysis of the AOAC. 15.ed. Washington: AOAC, 1985. 1015p.
AYALON, N. A review of embrionic mortality in cattle. Journal of Reproduction and Fertility, v.54, p.483-493, 1978.
BUCKLEY, F.; DILLON, P.; RATH, M.; VEERKAMP, R.F. The relationship between genetic merit for yield and live weight, condition score, and energy balance of spring calving Holstein Friesian dairy cows on grass based system of milk production. Journal of Dairy Science, v.3, p.1878-1886, 2000.
BUTLER, W.R.; CANFIELD, R.W. Interrelationships between energy and postpartum reproduction. In: CORNELL NUTRITION CONFERENCE, Ithaca, 1989. Proceedings: Ithaca: Cornell University, 1989. p.66.
CHRISTENSEN, J.O.; GRUMMER, R.R.; RASMUSSEN, F.E.; BERTICS, J.S. Effect of method of delivery of propylene glycol on plasma metabolites of feed – restricted cattle. Journal of Dairy Science, v.80, p.563–568, 1997.
DRACKLEY, J.K. Nutritional management of dairy cows during the transition period. In: ANNUAL RUMINANT NUTRITION SYMPOSIUM, 13., Gainesville, 1998. Proceedings.
DRACKLEY, J.K. What about testing for blood NEFA levels in fresh cows?
Hoard’s Dairyman, v.144, p.783, 1999.
FERREIRA, A.M.; SÁ, W.F.; VILA, C.H.A.; ASSIS, A.G. Diagnóstico da situação produtiva e reprodutiva em rebanhos leiteiros da zona da
Mata-MG. In: CONGRESSO BRASILEIRO DE MEDICINA
VETERINÁRIA, Belém, PA. v.19, p.61, 1984.
FONSECA, L.F.L. Suplementação de propileno glicol para vacas leiteiras periparturientes: efeitos sobre o metabolismo, condição corporal, produção e reprodução. São Paulo: USP/FMVZ, 1997. 114p. (Tese -Doutorado).
FORMIGONI, A.; CORNIL, M.C.; PRANDI, A.; MORDENTI, A.; ROSSI, A.; PORTEDELLE, D.; RENAVILLE, R. Effect of propylene glycol supplementation around parturition on milk yield, reproduction performance and some hormonal and metabolic characteristics in dairy cows. Journal of Dairy Research, v.63, p.11-24, 1996.
FOOTE, R.H.; RIEK, P.M. Gonadotropin-releasing hormone improves reproductive performance of dairy cows with slow involution of the reproductive tract. Journal Animal Science, v.77, p.12-16, 1999.
GEARHART, M.A.; CURTIS, C.R.; ERB, H.N.; SMITH, R.D.; SNIFFEN, C.J.; CHASE, L.E.; COOPER, B.D. Relationship of changes in condition score to cow health in Holsteins. Journal of Dairy Science, v.73, p.3132-3140, 1990.
GOFF, J.P.; HORST, R.L.; JARDON, P.W.; BORELLI, C.; WEDAM, J. Field trials of an oral calcium propionate paste as an aid to prevent milk fever in periparturient dairy cows. Journal of Dairy Science, v.79, p.378-383, 1996.
GRUMMER, R.R. Impact of changes in organic nutrient metabolism on feeding the transition dairy cow. Journal of Animal Science, v.73, p.2820–2833, 1995.
GRUMMER, R.R.; WINKLER, J.C.; BERTICS, S.J.; STUDER, V.A. Effect of propylene glycol dosage during feed restriction on metabolites in blood of prepartum Holstein heifers. Journal of Dairy Science, v.77, p.3618-3628, 1994.
HEUWIESER, W.; FERGUSON, J.D.; GUARD, C.L.; FOOT, R.H.; WARNICK, L.D.; BREICKNER, L.C. Relationship between administration of GnRH, body condition score and fertility in Holstein dairy cattle. Theriogenology, v.42, p.703-714, 1994.
HOLCOMB, C.S.; VAN HORN, H.H.; HEAD, H.H.; HALL, M.B.; WILCOX, C.J. Effects of prepartum dry matter intake and forage percentage on postpartum performance of lactating dairy cows. Journal of Dairy Science, v.84, p.2051-2058, 2001.
JORRITSMA, R.; JORRITSMA, H.; SCHUKKEN, Y.H.; WENTINK, G.H. Relationship between fatty liver and fertility and some periparturient diseases in commercial Dutch dairy herds. Theriogenology, v.54, p.1065-1074, 2000.
JUCHEM, S.O. Suplementação de propileno glicol e monensina sódica para vacas no período de transição. Piracicaba: USP/ESALQ, 2000. 99p. (Dissertação - Mestrado).
KOMARAGIRI, M.V.S.; ERDMAN, R.A. Factors affecting body tissue mobilization in early lactation dairy cows.1. Effect of dietary protein on mobilization of body fat and protein. Journal of Dairy Science, v.80, p.929-937, 1997.
MIYOSHY, S. Role of energy balance, plasma glucose and insulin on ovarian function and conception of dairy cows. Ames: Ohio State University, 1995. 82p. (Thesis - M.S.).
MIYOSHI, S.; PATE, J.L.; PALMQUIST, D.L. Effects of propylene glycol drenching on energy balance, plasma glucose, plasma insulin, ovarian function and conception in dairy cows. Animal Reproduction Science,
v.68, p.29–43, 2001.
MOE, P.W. Effects of level of intake on the utilization of diets by dairy. Ithaca: Cornell University, 1965. (Thesis - Doctor).
NEBEL, L.R.; McGILLARD, M.L. Interaction of high yield and reproductive performance in dairy cows. Journal of Dairy Science,
v.76, p.3257-3268, 1993.
PHILIPSON, J. Impact of international trade in cattle, semen and embryos on genetics evaluation. In: INTERNATIONAL DAIRY CONGRESS, 23., Montreal, 1990. Brussel: International Dairy Federation, 1990. p.644.
RUKKWAMSUK, T.; WENSING, T.; MATT, G.J H. Effect of overfeeding during dry period on regulation of adipose of dairy tissue metabolism in dairy cows during the periparturient period. Journal of Dairy Science,
v.81, p.2904–2911, 1998.
SAS INSTITUTE. SAS user’s guide: statistic. 5.ed. Cary, 1985. SAUER, F.D.; ERFLE, J.D.; FISHER, L.J. Propylene glycol and glycerol
as a feed additive for lactating dairy cows: an evaluation of blood metabolic parameters. Canadian Journal of Animal Science, v.53, p.265-271, 1973.
SCHLATTER, L. The addition of Nutrocal to the diets of periparturient cows: a review. Des Moines: Kemin Industries, 1997. p.1-11. (Technical Information)
SMITH, M.C.A.; WALLACE, J.M. Influence of early postpartum ovulation on the reestablishment of pregnancy in multiparous and primiparous dairy cattle. Reproduction Fertility and Development, v.10, p.207– 216, 1998.
STAPLES, C.R.; THATCHER, W.W.; CLARK, J.H. Relationship between ovarian activity and energy status during the early postpartum period of high producing dairy cows. Journal of Dairy Science, v.73, p.938– 947, 1990.
STOKES, R.S.; GOFF, J.P. Case study: evaluation of calcium propionate and propylene glycol administrated in to esophagus of dairy cattle at calving. The Professional Animal Scientist, v.17, p.115-122, 2001. STUDER, V.A.; GRUMMER, R.R.; BERTICS, S.J. Effect of prepartum
propylene glycol administration on periparturient fatty liver in dairy cows. Journal of DairyScience, v.76, p.2931–2939, 1993.
THATCHER, W.W.; WILCOX, C.J. Postpartum estrus as an indicator of reproductive status in the dairy cow. Journal of Dairy Science, v.56, p.608-610, 1973.
VAN SOEST, P.J.; ROBERTSON, J.B.; LEWIS, B.A. Methods for dietary fiber, neutral detergent fiber, and non-starch polysaccharides in relation to animal nutrition. Journal of Dairy Science, v.74, p.3583-3597, 1991. VAZQUEZ–AÑON, M.; BERTICS, S.; LUCK, M.; GRUMMER, R.R. Peripartum liver triglyceride and plasma metabolites in dairy cows.
Journal of Dairy Science, v.77, p.1521-1528, 1994.
WALDO, D.R.; SCHULTZ, L.H. Blood and rumen changes following the intraruminal administration of glycogenic materials. Journal of Dairy Science, v.43, p.496-505, 1960.
WILDMAN, E.E.; JONES, G.M.; WAGNER, P.E.; BOWMAN Jr. R.L.; TROUTT, H.F.; LESCH, T.N. A dairy cow body condition scoring system and its relationship selected production characteristics. Journal of DairyScience, v.65, p.495-501, 1982.