www.scielo.br/aabc
Ouabain exacerbates activation-induced cell death
in human peripheral blood lymphocytes
MABEL B. ESTEVES, LUIS F. MARQUES-SANTOS, OTTÍLIA R. AFFONSO-MITIDIERI and VIVIAN M. RUMJANEK
Laboratório de Imunologia Tumoral, Instituto de Bioquímica Médica, Universidade Federal do Rio de Janeiro, 21941-590 Rio de Janeiro, RJ, Brasil
Manuscript received on January 14, 2005; accepted for publication on March 7, 2005; contributed byVivian M. Rumjanek*
ABSTRACT
Lymphocytes activated by mitogenic lectins display changes in transmembrane potential, an elevation in the cytoplasmic Ca2+concentrations, proliferation and/or activation induced cell death. Low concentrations of ouabain (an inhibitor of Na+,K+-ATPase) suppress mitogen-induced proliferation and increases cell death. To understand the mechanisms involved, a number of parameters were analyzed using fluorescent probes and flow cytometry. The addition of 100nM ouabain to cultures of peripheral blood lymphocytes activated with 5µg/ml phytohemagglutinin (PHA) did not modify the increased expression of the Fas receptor or its ligand FasL induced by the mitogen. However, treatment with ouabain potentiated apoptosis induced by an anti-Fas agonist antibody. A synergy between ouabain and PHA was also observed with regard to plasma membrane depolarization. PHAper sedid not induce dissipation of mitochondrial membrane potential but when cells were also exposed to ouabain a marked depolarization could be observed, and this was a late event. It is possible that the inhibitory effect of ouabain on activated peripheral blood lymphocytes involves the potentiation of some of the steps of the apoptotic process and reflects an exacerbation of the mechanism of activation-induced cell death.
Key words:lymphocytes, ouabain, PHA, apoptosis, membrane depolarization.
INTRODUCTION
Ouabain is a cardiotonic steroid that has been widely used, as well as other cardiac glycosides, in the clinic. The known mode of action of ouabain is through the inhibition of the Na+,K+pump. The Na+,K+-ATPase is associated to the plasma mem-brane and is responsible for the maintenance, in the interior of the cells, of elevated levels of K+ and low concentration of Na+typical of the majority of mammalian cells. The pump uses the energy of hydrolysis of one ATP molecule to transport to the
* Member Academia Brasileira de Ciências Correspondence to: Vivian M. Rumjanek E-mail: [email protected]
exterior of the cell three ions of Na+in exchange of the entry of two K+ions (Skou 1990).
Very early signals such as the expression of c-myc(Olej et al. 1998) and CD69 (Pires et al. 1997) are increased in activated lymphocytes exposed to ouabain suggesting that these lymphocytes are orig-inally responsive to stimulation. One explanation for this lack of proliferation in parallel with an ap-parent response to the stimulus could result from the fact that activated lymphocytes were fol-lowing the apoptotic pathway as opposed to the proliferative pathway. Anner et al. (1994) showed that peripheral blood lymphocytes underwent cell death when exposed to the endogenous isoform of ouabain produced in the hypothalamus. Similarly, our group also described apoptosis in activated PBL exposed to commercial ouabain (Olej et al. 1998). Similarly, it has been reported that Jurkat T cells (a human lymphocyte cell line) underwent apoptosis after exposure to the drug (Orlov et al. 1999).
Lymphocytes are subjected to cell death checkpoints at many points during their lifespan. The process of activation-induced cell death (AICD) is a physiologic mechanism occurring at the end of immune responses essential to maintain the home-ostasis of the immune system. Overexpression of the molecules Fas receptor and FasL is seen in stim-ulated lymphocytes and activation of Fas receptor by its ligand triggers the death program (Nagata and Goldstein 1995, Martin and Green 1995). Lack of this mechanism leads to autoimmunity and to the failure of limiting the expansion of an immune response by eliminating effector cells that are not longer needed (Lynch et al. 1995). The process of AICD involves reduction in cell size; activation of the caspase machinery via caspase 8 which in turn activates caspase 3 to initiate the degradation of a variety of substrates; increased intracellular calcium levels and activation of nucleases, leading to DNA degradation (Kaufmann and Hengartner 2001).
The expression of FasL is preceded and reg-ulated by an increase of the transcription factor c-Myc (Genestier et al. 1999, Kasibhatla et al. 2000, Brunner et al. 2000). Our previous work (Olej et al. 1998) has shown that PHA-activated lymphocytes exposed to ouabain undergo apoptosis, and despite
the fact that c-mycmRNA is increased in ouabain treated PHA-activated lymphocytes the expression of FasL in these cells was not investigated. On the other hand, the function of c-Myc in relation to Fas expression is controversial (de Alboran et al. 2001, Wang et al. 1998), and there are evidences that the transcription factor NFAT participate in the regu-lation of Fas expression in activated lymphocytes (Latinis et al. 1997).
The present work attempted to investigate the expression of Fas and Fas-L in mitogen activated human peripheral lymphocytes exposed to ouabain, a condition known to predispose these cells to apoptosis.
MATERIALS AND METHODS
Preparation of Peripheral Blood Lympho-cytes
PBL were obtained by fractionating heparinized blood from healthy volunteers on ficoll-hypaque (hystopaque, Sigma-Aldrich) density gradient cen-trifugation. Briefly, 4ml of blood was layered on 3ml of hystopaque and spun down for 30 min at 400×g. The PBL fraction was washed twice with 0.9% NaCl (7 min at 250×g). Cell pellets were then resuspended at 106cells/ml in RPMI 1640 (Sigma-Aldrich), supplemented with 5 × 10⁻⁵ M β -mercaptoethanol, 25mM Hepes, pH adjusted to 7.4 with NaOH, 60mg/l penicillin, 100mg/l strepto-mycin (all purchased from Sigma-Aldrich) and 10% fetal calf serum (FCS) (Gibco), inactivated at 56◦C for 1h. The cell number was adjusted at 106cells/ml and used in the specific assays.
Treatment of Cells with PHA and Ouabain
Analysis of FAS (CD95or APO-1) and FAS Ligand (FasL or CD95L) Expression
Cells (106/ml) incubated for 6, 24, and 72h with or without PHA and/or 100nM ouabain, were spun down and the pellet was incubated with 1µg(2µl) of anti-human FAS-PE (clone number DX2) (BD PharmingenTM) or anti-human FAS-L (clone num-ber NOK-1) (BD PharmingenTM), for 30 min at 4◦C, washed twice in chilled PBS and resuspended in PBS containing 1% formaldehyde. For FasL analy-sis, after primary incubation, cells were spun down and incubation with a secondary antibody goat anti-mouse IgG-FITC human adsorbed (BD Pharmin-genTM) Analysis for surface immunofluorescence was performed on a flow cytometer.
Measurement of Plasma Membrane Potential with Oxonol – DiBAC4(3)
Acute changes in the plasma membrane potential were measured by flow cytometry using bis-(1,3-dibutilbarbiturate) trimethine oxonol – DiBAC4(3) (Molecular Probes). Cells were incubated for 6 and 24h with or without PHA and/or 100nM or 100µM ouabain. Oxonol was prepared according to man-ufacturers instructions and diluted in RPMI to be used at a final concentration of 150nM. The incu-bation time with oxonol was 30 min at 37◦C and 5% CO2. As a positive control, we used 50mM KCl in the last 10 min of incubation. Analysis for sur-face immunofluorescence was performed on a flow cytometer.
Measurement of Mitochondrial Mass with Mitotracker Green
To investigate mitochondrial mass, we used the fluorescent probe mitotracker green FM (MTG) (Molecular Probes) which is a cell-permeant mito-chondrion-selective dye that passively diffuses across the plasma membrane and accumulates in active mitochondria. PBL at 106cells/ml were in-cubated for 6 and 24h with or without PHA and/or 100nM ouabain. The dye was diluted in DMSO, stored at−20◦C (1mM) and used at a final
concen-tration of 50nM in supplemented RPMI. The incu-bation time with MTG was 30 min. at 37◦C and 5% CO2. Samples were analyzed by flow cytometry.
Evaluation of Mitochondrial Membrane Potential with3,3 -dihexyloxacarbo-cyanine iodide-DiOC6(3)
To evaluate the mitochondrial membrane potential (m), we used 3,3-dihexyloxacarbocyanine io-dide [DiOC6(3)] dye (Sigma-Aldrich). Cells were incubated for 6 and 24h with or without PHA and/or 100nM ouabain. The dye was diluted in RPMI and used at a final concentration of 5nM. Cells were incubated with DiOC6(3) for 40 min at 37◦C and 5% CO2. As a positive con-trol, 50µM of the protonophore carbonylcyanide p-trifluoromethoxyphenylhydrazone (FCCP) (Sigma-Aldrich) was used in the last 20 min of incubation. DiOC6(3) and FCCP were diluted in ethanol and stored at−20◦C (1mM). Samples were analyzed using a flow cytometer.
Measurement of Apoptosis by Annexin Binding and anti-Fas
CONTROL OUA PHA PHA + OUA
Number of Events
Number of Events
FAS-L Fluorescence
FAS Fluorescence
Fig. 1 – FasL and Fas expression in PBL cultured for 6h with or without 5µg/ml PHA and/or 100nM ouabain. The black line profile indicates control (untreated cells) and the gray histograms indicate cells exposed PHA and/or OUA. The figure is representative of five experiments of FasL and representative of thirteen of Fas.
Analysis by Flow Cytometry
106 cells were incubated for the indicated time and cell size and complexity analyzed by flow cytometry using light scatter parameters: for-ward scattering (FSC) and side scattering (SSC). For analysis using fluorescent probes, samples were kept on ice up to the moment of the analysis. The final volume of incubation was 300µl. All samples were analyzed using a FACScalibur flow cytome-ter. The fluorescence was excited with an argon laser (excitation wavelength 488nm) and analyzed in FL-1 (wavelength 530±30nm – Annexin V, FasL, MTG, DiOC6(3) and oxonol) or in FL-2 (wavelength 585nm – CD95PE). At least 10,000 events were ac-quired. A life-gate based on light scatter parameters (forward and side scatter) and staining with 1µg/ml PI was done. Dead cells, aggregates and debris were excluded. Data were recorded on a Macintosh com-puter using Cell Quest Software and statistically an-alyzed using the WinMDI version 2.8 software.
Statistical Analysis
Results were reported as mean±SE. Data were analyzed statistically by the Student’s t-test and differences between means were consider to be sig-nificant when P<0.05.
RESULTS
Effect of Ouabain on Fas and FasL Expression by PHA-activated Lymphocytes
TABLE I
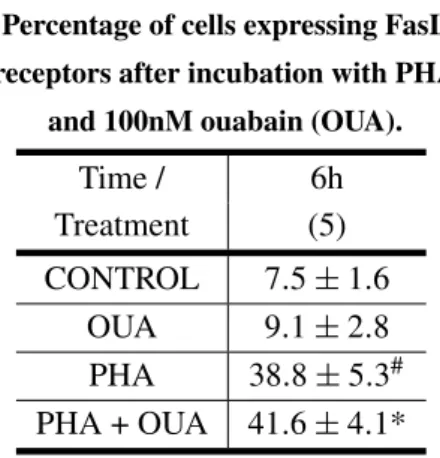
Percentage of cells expressing Fas receptors after incubation with PHA and 100nM ouabain (OUA).
Time (h) / 6 25 72
Treatment (13) (4) (3)
CONTROL 34.4±4.4 43.5±8.7 55.7±0.9 OUA 36.2±4.1 44.8±10.2 56.4±2.0 PHA 55.8±4.5# 78.6±7.1 89.5±3.9# PHA + OUA 62.7±5.3* 88.3±4.9* 80.3±3.6*
Results represent mean±standard error (SE). Number of experiments are indicated between brackets.#P<0.01 andP<0.05 both compared to control group.∗P>0.05 compared to PHA group (Student’st-test).
72h and no difference could be observed between PHA-activated lymphocytes and activated cultures that received ouabain (Fig. 1 and Table I). FasL was only studied at 6h and similar to what was seen with Fas, no difference could be observed between PHA-activated lymphocytes and activated cultures that received ouabain (Fig. 1 and Table II).
TABLE II
Percentage of cells expressing FasL receptors after incubation with PHA
and 100nM ouabain (OUA).
Time / 6h
Treatment (5)
CONTROL 7.5±1.6
OUA 9.1±2.8
PHA 38.8±5.3# PHA + OUA 41.6±4.1*
Results represent mean±standard error (SE). Num-ber of experiments are indicated between brackets.
#P< 0.01 compared to control group. ∗P> 0.05 compared to PHA group (Student’st-test).
Effect of Ouabain on anti-Fas-induced Apoptosis
It has been demonstrated that ouabain is capable of potentiating some of the effects observed dur-ing anti-Fas-induced apoptosis in Jurkat lympho-cytes (Bortner et al. 2001, Nobel et al. 2000). In the present work the addition of anti-Fas to PHA-activated lymphocytes cultured in the presence of ouabain, resulted in an increased amount of apop-totic cells. Furthermore, the majority of dead cells were CD95 positive cells (Fig. 2).
Effect of Ouabain on Plasma Membrane Depolarization of PHA-activated Lymphocytes
Annexin V Annexin V
FAS
FAS
CONTROL OUA
PHA PHA + OUA
CONTROL OUA
PHA PHA + OUA
100 101 102 103 104
100 101 102 103 104
100 101 102 103 104 100 101 102 103 104
100 101 102 103 104 100 101 102 103 104
100 101 102 103 104 100 101 102 103 104
10
0
10
1
10
2
10
3
10
0
10
1
10
2
10
3
10
0
10
1
10
2
10
3
10
0
10
1
10
2
10
3
10
0
10
1
10
2
10
3
10
0
10
1
10
2
10
3
10
0
10
1
10
2
10
3
10
0
10
1
10
2
10
3
Fig. 2 – Apoptosis induction by anti-Fas antibody following 5µg/ml PHA and 100nM ouabain treatment. Lymphocytes were treated with 5µg/ml PHA and/or 100nM ouabain for 6 or 24h. After that period, cells were exposed to anti-Fas antibody for 2h. Apoptotic cells were measured using Annexin V. The sum of the percentage of cells in the right hand side indicate the total annexin V positive cells induced by anti-fas The quadrants show Annexin V versus Fas fluorescence. This figure is representative of four experiments.
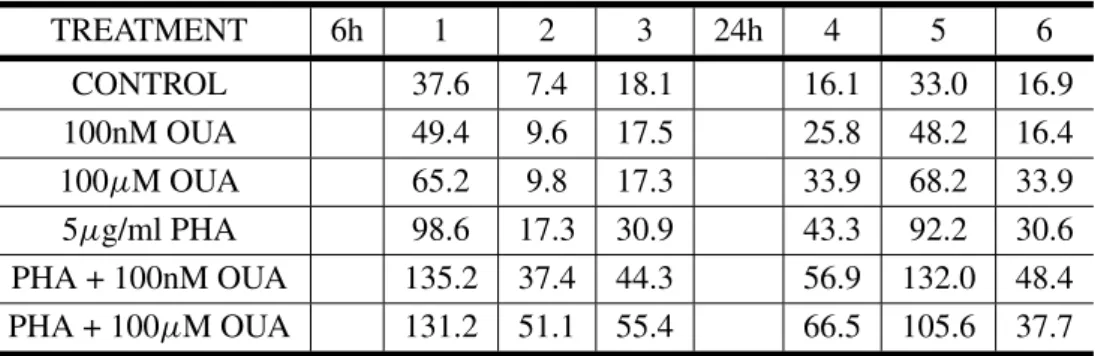
100µM ouabain promoted depolarization. How-ever, both 100nM and 100µM were capable of aug-menting the degree of depolarization observed in the presence of PHA (Fig. 3 and Table III). PBL from 6h cultures always presented a smaller second peak that increased when PHA was used and was not formed by macrophages or dead cells measured by propidium iodide incorporation (data not shown).
Effect of Ouabain on Mitochondrial Mass and Mitochondria Membrane Potential
Fluorescense Intensity
KCl OUA 100nM OUA 100µM
PHA PHA + OUA 100nM PHA + OUA 100PM
Oxonol Fluorescence
6h
Num
ber of
Events
Oxonol Fluorescence
KCL OUA 100nM
PHA
OUA 100PM
PHA + OUA 100nM PHA + OUA 100PM 24h
Nu
m
b
er of
Events
Fig. 3 – Plasma membrane depolarization measured by oxonol fluorescence after 6 or 24h culture. PBL were exposed to 5µg/ml PHA and/or ouabain (OUA). KCl–was used as a positive control. The black line profile indicates control (untreated cells) and the gray histograms indicate cells exposed PHA and/or OUA. The figure is representative of three experiments incubated for 6h or 24h. Changes to the right (increased fluorescence) indicate depolarization.
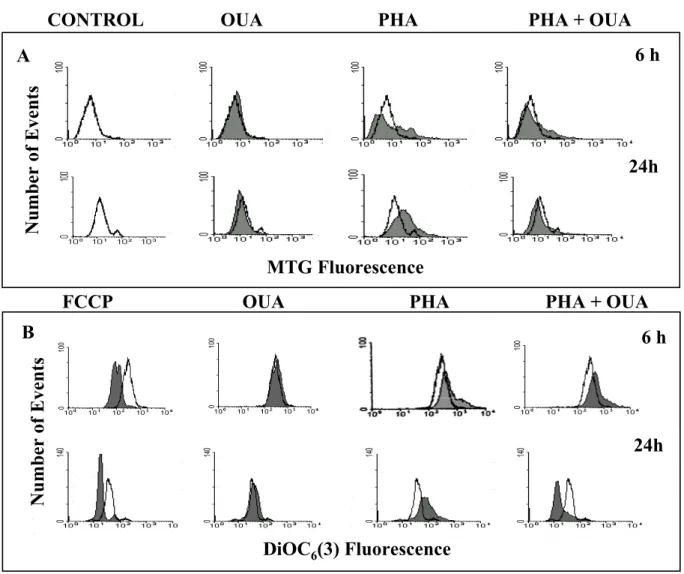
the increase seen at 6h and after 24h no increase in mitochondrial mass was observed in cultures stimu-lated by PHA in the presence of ouabain (Fig. 4A). Disruption of mitochondrial membrane poten-tial is a characteristic of many apoptotic cells. Using the cationic lipophilic dye DiOC6(3) it was found that by 6h, 100nM ouabain by itself did not induce mitochondrial membrane depolarization. The same occurred with 100µM ouabain (data not shown).
TABLE III
Plasma membrane potential following incubation with PHA and ouabain.
TREATMENT 6h 1 2 3 24h 4 5 6
CONTROL 37.6 7.4 18.1 16.1 33.0 16.9
100nM OUA 49.4 9.6 17.5 25.8 48.2 16.4
100µM OUA 65.2 9.8 17.3 33.9 68.2 33.9
5µg/ml PHA 98.6 17.3 30.9 43.3 92.2 30.6
PHA + 100nM OUA 135.2 37.4 44.3 56.9 132.0 48.4
PHA + 100µM OUA 131.2 51.1 55.4 66.5 105.6 37.7
Results are represented as the median fluorescence intensity of oxonol of three different experiments. The numbers 1, 2, and 3 correspond to different experiments with incubation time of 6h. The numbers 4, 5 and 6 correspond to different experiments with incubation time of 24h.
TABLE IV
Mitochondrial membrane potential following incubation with PHA and ouabain.
TREATMENT 6h 1 2 3 24h 4 5 6
CONTROL
Depolarization 6* 9 13 15 3 6
Normal 88 87 84 88 94 89
Hyperpolarization 6 4 3 6 3 5
OUA
Depolarization 5 13 3 5 3 9
Normal 91 81 94 86 93 90
Hyperpolarization 4 6 3 8 4 1
PHA
Depolarization 8 17 6 8 3 9
Normal 75 68 73 73 55 78
Hyperpolarization 17 15 21 18 42 13
PHA + OUA
Depolarization 12 32 9 30 42 15
Normal 80 60 77 67 54 75
Hyperpolarization 8 8 14 3 4 10
6 h
Number of Events
A
CONTROL OUA PHA
PHA + OUA
MTG Fluorescence
24h
B
6 h
Number of Events
DiOC
6(3) Fluorescence
FCCP OUA
PHA PHA + OUA
24h
Fig. 4 – Mitochondrial mass and membrane potential in PBL treated with PHA and/or ouabain. The black line profile indicates control and the gray histograms indicate cells exposed to PHA and/or OUA for 6h or 24h. The auto-fluorescence profile of cells treated with PHA or OUA was not different from that seen with untreated cells. (A) Cells were incubated with 50nM mitotraker green (MTG) to observe mitochondrial mass. (B) Mitochondrial membrane depolarization was measured with DiOC6(3) after cells were cultured for 6 or 24h. 50µM FCCP was used as a positive control and changes to the left (decreased fluorescence) indicate depolarization. Fig. 4A is representative of four experiments. Fig. 4B is representative of three experiments. PHA=5µg/ml, OUA = 100nM ouabain.
DISCUSSION
The molecules Fas and FasL are expressed in PHA-activated lymphocytes independent of their expo-sure to ouabain. Nevertheless, the induction of the apoptotic process using anti-Fas as an agonist, led to an increased amount of apoptotic cells in PHA-activated cultures in the presence of ouabain. In the Jurkat cell line, ouabain potentiates Fas-induced apoptosis and the death program triggered by this molecule (Bortner et al. 2001, Nobel et al. 2000). In a different system, glucocorticoid induced
apop-tosis of thymocytes, both spontaneous and gluco-corticoid-driven apoptosis were dependent on a de-crease in Na+/K+ATPase activity and ouabain po-tentiated this effect (Mann et al. 2001).
pro-duced by PHA. An increased sensitivity of activated cells to ouabain has been described before (Brodie et al. 1995).
One of the earliest evidences of apoptosis is cell shrinkage, which seems to precede caspase activation and nuclear fragmentation (Bortner et al. 1997). Stimulation of the Fas receptor leads to in-hibition of K+uptake (Bortner et al. 2001) and acti-vates outwardly rectifying Cl–channels, via tyrosine kinase phosphorylation (Szàbo et al. 1998). Fur-thermore, by blocking volume regulatory Cl– chan-nels it was possible to rescue cells from apoptosis (Maeno et al. 2000, Szàbo et al. 1998). The release of K+from the cells, activation of chloride channels and efflux of water produce the characteristic loss of volume (Bortner and Cidlowski 1996, Bortner et al. 1997).
A central role for K+ ions in apoptosis has been advanced. Hughes et al. (1997) described that reduced intracellular K+ concentration is a pre-requisite for apoptosis as normal concentrations of this ion inhibits caspase and nuclease activi-ties. This reduction, however, is not sufficient to trigger the apoptotic process, an apoptotic stimuli being necessary. It is worth mentioning that ouabain was shown to increase the production of IL-1β. The enzyme capable of cleaving pro-interleukin 1β to the biologically active form is the caspase ICE (IL-1β converting enzyme) and its activation was re-ported to be enhanced by K+ depletion (Perregaux and Gabel 1994, Walev et al. 1995). It is quite possible therefore, that the processes of caspase ac-tivation for the induction of apoptosis and for IL-1β production are a reflection of the same mechanism.
A different view is put forward by Dallaporta et al. (1998). According to them loss of cytosolic K+occurs downstream of mitochondrial depolariza-tion, cytochrome c release and caspase activadepolariza-tion, but they also consider this step crucial for the acti-vation of endonucleases. In our experience, loss of mitochondrial membrane potential was clearly evi-dent only when PHA-activated cells were exposed to ouabain and appeared to be a late event.
In conclusion, treatment of activated PBL with ouabain potentiated apoptosis induced by an anti-Fas agonist antibody. A synergy between ouabain and PHA was also observed with regard to plasma membrane depolarization in agreement with the ob-servation that sustained plasma membrane depolar-ization favors apoptosis. The mitochondria path-way, resulting in depolarization and cytochrome c release, did not seem to be involved when only PHA was used. However, dissipation of mitochondrial membrane potential was observed when cells were also exposed to ouabain, and in this case it was a late event. It is possible that the inhibitory effect produced by ouabain on activated peripheral blood lymphocytes represents an exacerbation of the ef-fects seen during AICD.
ACKNOWLEDGMENTS
We would like to thank Dr Fernanda Mello de Queiroz for the gift of oxonol dye and for introduc-ing us to the technique of measurement of plasma membrane potential.
This work was supported by Conselho Nacio-nal de Desenvolvimento Científico e Tecnológico (CNPq), Programa de Apoio a Núcleos de Excelên-cia (PRONEX) and Fundação Carlos Chagas Filho de Amparo à Pesquisa do Estado do Rio de Janeiro (FAPERJ).
RESUMO
poten-ciou a apoptose induzida por um anticorpo anti-Fas fun-cionando como agonista. Um sinergismo entre ouabaína e PHA também foi observado com relação à despolariza-ção da membrana plasmática. Com reladespolariza-ção à membrana mitocondrial, PHA por si só não produziu despolarização, mas quando as células foram também expostas à ouabaina uma dissipação do potencial foi observado, mas isso foi um evento tardio. É possível que o efeito inibitório da ouabaína em linfócitos de sangue periférico ativados en-volva a potencialização de alguns aspectos do processo apoptótico e reflita uma exacerbação do mecanismo de AICD.
Palavras-chave: linfócitos, ouabaína, PHA, apoptose, despolarização de membrana.
REFERENCES
Anner BM, Lacotte D, Anner RM and Moosmayer M.1994. Interaction of hypothalamic Na,K-ATPase inhibitor with isolated human peripheral blood mono-nuclear cells. Biosci Rep 14: 231–242.
Bortner CD and Cidlowski JA.1996. Absence of vol-ume regulatory mechanism contributes to the rapid activation of apoptosis in thymocytes. Am J Physiol 271: C950-C961.
Bortner CD, Hughes FM and Cidlowski JA.1997. A primary role for K+ and Na+ efflux in the activation of apoptosis. J Biol Chem 272: 32436–32442.
Bortner CD, Gómez-Angelats M and Cidlowski JA.
2001. Plasma membrane depolarization without re-polarization is an early molecular event in anti-Fas-induced apoptosis. J Biol Chem 276: 4304–4314.
Brodie C, Tordai A, Saloga J, Domenico J and Gelfand EW.1995. Ouabain induces inhibition of the progression phase in human T-cell proliferation. J Cell Physiol 165: 246–253.
Brunner T, Kasibhatla S, Pinkoski MJ, Frutschi C, Yoo NJ, Echeverri F, Mahboubi A and Green
DR. 2000. Expression of Fas ligand in activated T cells is regulated by c-Myc. J Biol Chem 275: 9767– 9772.
Dallaporta B, Hirsch T, Susin SA, Zamzami N,
Larochette N, Brenner C, Marzo I and Kroe-mer G.1998. Potassium leakage during the apoptotic degradation phase. J Immunol 160: 5605–5615.
Dallaporta B, Marchetti P, Pablo MA, Maisse C, Duc H-T, Métivoer D, Zamzami N, Geuskens M
and Kroemer G. 1999. Plasma membrane
po-tential in thymocytes apoptosis. J Immunol 162: 6534–6542.
de Alboran IM, O’Hagan RC, Gartner F, Malynn B,
Davidson L, Ricket R, Rajewsky K, Depinho RA and Alt FW.2001. Analysis of C-Myc function in normal cells via conditional gene-targeted mutation. Immunity 14: 45–55.
Genestier L, Kasibhatla S, Brunner T and Green DR.1999. Transforming growth factorβ1 inhibits Fas ligand expression and subsequent activation-induced cell death in T cells via downregulation of c-Myc. J Exp Med 189: 231–239.
Hughes FM, Bortner CD, Purdy GD and Cidlowski
JA. 1997. Intracellular K+ suppresses the activa-tion of apoptosis in lymphocytes. J Biol Chem 272: 30567–30576.
Jensen P, Winger L and Nowell P.1977. The mito-genic effect of A23187 in human peripheral lympho-cytes. Biochim Biophys Acta 496: 374–383.
Kasibhatla S, Beere HM, Brunner T, Echeverri F
and Green DR. 2000. A ‘non-canonical’ DNA-binding element mediates the response of the Fas-ligand promoter to c-Myc. Curr Biol 10: 1205–1208.
Kaufmann SH and Hengartner MO. 2001.
Pro-grammed cell death: alive and well in the new mil-lennium. Trends Cell Biol 11: 526–534.
Kiefer H, Blume AJ and Kaback HR. 1980. Mem-brane potential changes during mitogenic stimula-tion of mouse spleen lymphocytes. Proc Natl Acad Sci USA 77: 2200–2204.
Latinis KM, Norian LA, Eliason SL and Koretzky
GA.1997. Two NFAT transcription factor binding sites participate in the regulation of CD95 (Fas) lig-and expression in activated human T cells. J Biol Chem 272: 31427–31434.
Lynch DH, Ramsdell F and Alderson MR.1995. Fas and FasL in the homeostatic regulation of immune responses. Immunol. Today 16: 569–574.
Maeno E, Ishizaki Y, Kanaseki T, Hazama A and
Okada Y.2000. Normotonic cell shrinkage because of disordered volume regulation is an early prereq-uisite to apoptosis. Proc Natl Acad Sci USA 97: 9487–9492.
Mann CL, Bortner CD, Jewell CM and Cidlo-wski JA. 2001. Glucocorticoid-induced plasma membrane depolarization during thymocyte apopto-sis: association with cell shrinkage and degradation of Na+/K+-adenosine triphosphatase. Endocrinol-ogy 142: 5059–5068.
Martin SJ and Green DR.1995. Protease activation during apoptosis: death by a thousand cuts? Cell 82: 349–352.
Moraes VLG, Olej B, de la Rocque L and Rumjanek VM.1989. Lack of sensitivity to ouabain in natural killer activity. FASEB J 3: 2425–2429.
Nagata S and Goldstein P.1995. The Fas death factor. Science 267: 1449–1456.
Nobel CSI, Aronson JK, van den Dobbelsteen DJ and Slater AFG.2000. Inhibition of Na+/K(+)-ATPase may be one mechanism contributing to potas-sium efflux and cell shrinkage in CD95-induced apoptosis. Apoptosis 5: 153–163.
Olej B, de la Rocque L, Castilho FPD, Mediano IF,
Campos MM and Rumjanek VM.1994. Effect of ouabain on lymphokine-activated killer cells. Int J Immunopharmacol 16: 769–774.
Olej B, dos Santos NF, Leal L and Rumjanek VM.
1998. Ouabain induces apoptosis on PHA – activated lymphocytes. Bioscience Reports 18: 1–7.
Orlov SN, Thorin-Trescases N, Kotelevtsev SV, Tremblay J and Hamet P.1999. Inversion of the intracellular Na+/K+ratio blocks apoptosis in vascu-lar smooth muscle at a site upstream of caspase-3. J Biol Chem 274: 16545–16552.
Perregaux D and Gabel CA. 1994. Interleukin-1 beta maturation and release in response to ATP and nigericin. Evidence that potassium depletion me-diated by these agents is a necessary and common feature of their activity. J Biol Chem 269: 15195– 15203.
Pires V, Harab RC, Olej B and Rumjanek VM.1997. Ouabain effects on activated lymphocytes: augmen-tation of CD25 expression on TPA-stimulated cells and of CD69 on PHA- and TPA-stimulated cells Int J Immunopharmac 19: 143–148.
Quastel MR and Kaplan JG. 1968. Inhibition by Ouabain of human lymphocyte transformation in-duced by phytohaemagglutinin in vitro. Nature 219: 198–200.
Redondo JM, Lopez Rivas A and Fresno M.1986. Activation of the Na+/K+-ATPase by interleukin-2. FEBS Lett 206: 199–202.
Skou JC. 1990. The fourth Datta lecture: the energy coupled exchange of Na+for K+across the cell mem-brane. The Na+, K+-pump. FEBS Lett 268: 314– 324.
Szabò I, Lepple-Wienhues A, Kaba NK, Zoratti M,
Gulbins E and Lang F. 1998. Tyrosine kinase-dependent activation of a chloride channel in CD95-induced apoptosis in T lymphocytes. Proc Natl Acad Sci USA 95: 6169–6174.
Szamel M, Schneider S and Resch K.1981. Func-tional interrelationship between (Na+,K+)-ATPase and lysolecithin acyltransferase in plasma mem-branes of mitogen-stimulated rabbit thymocytes. J Biol Chem 256: 9198–9204.
Szamel M, Leufgen H, Kurrle R and Resch K.1995. Differential signal transduction pathways regulating interleukin-2 synthesis and interleukin-2 receptor ex-pression in stimulated human lymphocytes. Biochim Biophys Acta 1235: 33–42.
Walev I, Reske K, Palmer M, Valeva A and Bhakdi S.1995. Potassium-inhibited processing of IL-1 beta in human monocytes. EMBO J 14: 1607–1614.