Transaction costs in beans market in Brazil
Custos de transação no mercado de feijão no Brasil
Paulo Eterno Venâncio AssunçãoI Alcido Elenor WanderII ISSN 0103-8478
ABSTRACT
This paper aimed to evaluate the presence of transaction costs in the beans market in Brazil. Therefore, threshold autoregressive (TAR) models were used to check co-integration and the existence of transaction costs in the Brazilian
beans market. The results confirmed the presence of transaction
costs in the beans market, which are mainly related to the freight component of production, since the markets are often far away from the producing regions.
Key words: co-integration, threshold autoregressive model, common bean.
RESUMO
O objetivo deste estudo foi avaliar a existência de custos de transação no mercado de feijão no Brasil. Para tanto
foram utilizados modelos de threshold autoregressivo para verificar
a cointegração e a existência de custos de transação no mercado
brasileiro de feijão. Os resultados confirmam a presença de custos
de transação no mercado de feijão, os quais estão relacionados principalmente aos custos de frete, considerando que os mercados consumidores podem estar distantes dos locais de produção.
Palavras-chave: cointegração, modelo de threshold autoregressivo, feijão comum.
INTRODUCTION
The bean production in Brazil is spread throughout the whole country. Beans are one of the staple foods of the Brazilian population, constituting the main source of plant-based protein. The world production of beans, comprising the genera Phaseolus
and Vigna, amounts to over 18 million tons. Brazil
ranks second in the world production and first when
only considering the genus Phaseolus.
The market studies began with the study of market integration, based on correlations between prices, to describe the way in which markets are related (CAMPENHOUT, 2007). RAVALLION
(1986), in a pioneering study in the field, was the first to consider the dynamic character of the process
of price adjustment and present the advantage of allowing the distinction between the integration of the short-term market and instant integration. It also gave the notion of integration as a less restrictive concept of long-run equilibrium.
In general terms, transaction costs are associated with exchange of goods or services and incurred in overcoming market imperfections. They cover a wide range: communication charges, legal
fees, informational cost of finding the price, quality,
and durability, etc., and may include transportation costs (BARZEL, 1982; WILLIAMSON, 1985; EGGERTSSON, 1995; NORTH, 1997; ALCHIAN & DEMSETZ, 1999). In this study transaction costs restrict the transmission of prices, an effect that only begins to occur when the gains from arbitrage outweigh the transaction costs. If they do not, isolated shocks are not transmitted between markets, which determine a situation in which prices are not related (GOODWIN & PIGOTT, 2001). Unlike the structure assumed by the standard analysis of co-integration in
IPrograma de Pós-graduação em Agronegócio, Universidade Federal de Goiás (UFG), Goiânia, GO, Brasil.
IIFaculdades Alves Faria (ALFA) & Centro Nacional de Pesquisa de Arroz e Feijão, Embrapa, Rodovia GO-462, Km 12, CP 179,
75375-000, Santo Antônio de Goiás, GO, Brasil. E-mail: [email protected]. Corresponding Author.
the presence of transaction costs, the process of price adjustment occurs in a discontinuous manner.
MATTOS et al. (2011) point out that, among all the models developed from the techniques of co-integration, vector error correction models (VEC) have been widely used. The authors emphasize that as the price adjustments that are induced by deviations from the long-term equilibrium can be considered as a linear function of such a deviation, the same very small deviations would lead to an adjustment process in each market.
The objective of this study is to broach an application of the threshold co-integration models to analyze the integration process of the national bean market. Therefore, a threshold co-integration technique is used. It consists of a combination of traditional co-integration methods with non-linearities and discontinuities in the relationship between prices.
Specifically, this study intended to ensure that bean
producers’ and traders’ markets are integrated.
MATERIAL AND METHODS
A model of co-integration with a threshold
GOODWIN & HOLT (1999) indicate that in studies of market integration, the threshold effect occurs as shocks of great magnitude, occurring when they are well above the threshold determined, inducing different responses from those resulting from relatively small shocks, below the threshold. RAVALLION (1986) points out that the threshold models are motivated by the existence of costs in the adjustment process, which may prevent the adjustment to shocks of small magnitude.
The autoregressive models with a threshold
belong to a specific class of models, also known
as autoregressive non-linear models, which have attracted attention in the recent literature on market integration. In determining the co-integration models with a threshold that can be used in the analysis of the integration k market, a traditional relation of co-integration, representing an economic balance, is considered (equation 1).
(1) where Pit (i = 1, 2,..., k) is the price observed in the i-th market at time t, βi are parameters that determine the relation between prices and Zt = pZt-1+εt, representing the derivation from equilibrium in period t. The co-integration between the prices p
is conditioned by the nature of the autoregressive process Zt. For the measurement as p approaches 1, the deviation from the equilibrium approaches a random walk process and a non-stationary situation in which the prices are not co-integrated.
BALKE and FOMBY (1997) use MATTOS et al.’s (2010) analysis of the chicken market, extending the basic structure of co-integration between variables – in the case of this study, the price of beans – for the case in which Zt follows an autoregressive process with a threshold (equation 2).
(2)
where represents the threshold that limits the alternative similarly and p (j), (j = 1,2) indicates that p varies according to the treatment applied.
The small deviations in the equilibrium relationship are characterized by the fact that
, in which case Zt is a random walk process (non-stationary), in which the prices are not co-integrated. In this case, there is no arbitrage and the markets are not integrated. At another point, the deviations from the equilibrium relationship are
relatively large, such that , leading
p(2) < 1, which features a stationary autoregressive process and a situation in which the prices are co-integrated; therefore, the markets are co-integrated.
The co-integrating non-linear process specified in (2)
is, as the co-linear integration, broadly stable.
Application to regional beans market in Brazil The TAR models are applied to the major regional markets for beans in Brazil. The procedure aims to study the nature of the autoregressive process relating to the series of deviations from equilibrium relationships, Zt, as shown in equation (1). The TAR models are considered the simplest models when compared with the more complete non-linear models, such as TVEC integration models with two or three regimes (MATTOS et al., 2010). The TAR models
used in the present research follow the specification
presented and used by GOODWIN & PIGOTT (2001) and MATTOS et al. (2010), for example (equation 3):
(3)
where Zt is the residue of the co-integration relationship between the prices that are estimated
between pairs of markets. The TAR models defined (3)
have two regimes. HANSEN (1999) emphasizes that
the first “inner system” is defined by the observations
that the deviations from the equilibrium relation (Zt) at a time lag ([Zt-1]) are smaller than or equal to the value of the threshold parameter ( . The “external
system” is estimated using the observations of which
For the econometric estimation of the model presented previously (3), the study follows the model proposed by HANSEN (1999) and replicated by MATTOS et al. (2010). The complete procedure,
involving the specification, estimation and analysis of statistical significance, is held in major swathes. The first step consists of the analysis of integration among
the markets studied. For this analysis, the analysis of the stationarity of the price series considered is developed initially; as a result, it is possible to identify their order of integration. At this point, the null hypothesis that markets are not co-integrated can be tested against the hypothesis of integrated co-linearly markets.
Following the script, the second step is conducted by obtaining the threshold parameter, which determines the boundary between the regimes that may be involved in price adjustments.
The determination of the parameter γ follows that
proposed by BALKE & FOMBY (1997). The parameter consists of initially sorting the data according to the value of the variable threshold and
Zt-1, as highlighted by MATTOS et al. (2010), rather than arranging them over time, giving rise to what is
known in the literature as “orderly” autoregression. “Orderly” autoregression is useful for detecting the
threshold, due to the fact that the TAR model changes its structure according to the value that Zt-1 takes.
In the latter instance, the parameter γ is obtained to
minimize the sum of markets of the residuals of the TAR model. To minimize the squared residuals, a
standard procedure is followed to construct a “two-dimensional grid search”. The grid search should be
restricted, so that a minimum number of observations are guaranteed (GOODWIN & HOLT, 1999). A
search is made of γ such that each system contains
at least 5% of the number of possible observations. After meeting the threshold parameter, the TAR
model found and specified (equation 3) is estimated
by ordinary least squares in order to constrain the
process to the value of γ.
The third and final step in estimating the
TAR model is equivalent, as highlighted by MATTOS
et al. (2010), to a test of statistical significance of the
presence of a threshold effect. It is the test of the null hypothesis of linearity, which retraces the AR model, against the alternative hypothesis of non-linearity, at the point at which the TAR model is recommended. This entire process can be performed through the statistical Sup-Wald F12, proposed by HANSEN (1999) (equation 4).
(4)
where T is the sample size and S1 and S2 are respectively the sum of markets of the residuals of the AR and TAR models.
The trading activities of beans in the
wholesale market are more concentrated in specific
localities, the markets, which are generally in the producing areas. Accordingly, it is advisable to use time series of prices in these markets. As an additional criterion for a higher sales volume, it was used a test of weak exogeneity, so that it can sustain the assumption that a market is determined as the price setter. The
price that the market sets should not be influenced by
the price of the others, which are free in their pricing (ASCHE et al., 2001).
In markets in which a space is considered with n markets to test whether a number i price is
weakly exogenously influenced, the study tests the null hypothesis that all the coefficients of the line
corresponding to the i-th price are statistically equal to
zero, as in equation 5.
(5) for all i, where i = 1,2, ..., n. The i price series is weakly exogenous if the hypothesis is not rejected.
Definition, description and data sources
The present study uses bean price series in the wholesale market, in which the spatial arbitrage, which is the factor leading to regional markets’ integration, occurs at this stage of the marketing process. The trading activities of beans in the
wholesale market are more concentrated in specific
localities, the squares, which are generally in the producing areas. Accordingly, it is advisable to use time series of prices in these markets, because the data state prices that are usually obtained by state secretaries, obtained by averaging the prices in several municipalities (MATTOS et al., 2010).
Eight production markets are considered in this study. They represent the largest bean-producing municipalities of Brazil. The bean-producing places considered are Unai (MG), Cristalina (GO), Castro (PR), Paracatu (MG), Euclides da Cunha (BA), Prudentópolis (PR), Brasilia (DF) and Luziania (GO). The data used are considered in their natural logarithms and are of daily frequency; we consider the 2003-2011 period. The data source is the price from Crops Market Consulting (www.safras.com.br).
RESULTS AND DISCUSSION
research. The results show that all the series are, at
a significance level of 1%, integrated of first order,
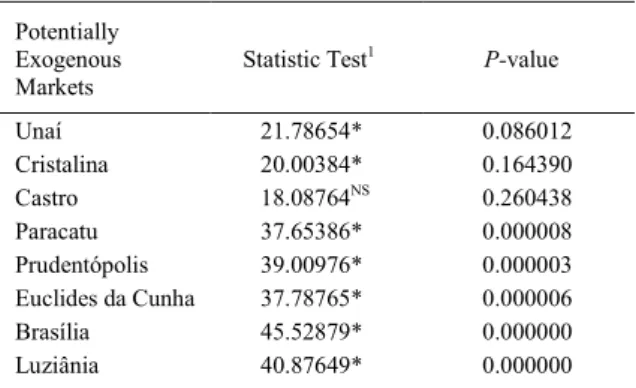
i.e. I (1). Despite being important bean-producing regions, the states of São Paulo and Mato Grosso do Sul are not included in our selection. They do not appear to be the major wholesale traders and price formation centres. To complement the criterion of greater trading volume, a test is conducted for weak exogeneity; the test results appear in table 1.
The results in table 1 show only the choice of the market with a higher trading volume as the price setter in the case of this study, and the marketing of Castro is weakly exogenous, since the hypothesis
that this price is not influenced by the other markets
in the long term cannot be rejected at the level of
statistical significance of 1%. Viewing table 1, the
markets of Cristalina and Unaí can also be considered weakly exogenous at the 1% level. This effect can be explained by the size of the production area of both cities that have a high level of wholesale marketing.
After identifying the central market, the test of co-integration between bean prices is performed. Such a test is conducted following the procedure of GOODWIN & PIGOTT (2001), adopting, as suggested by MATTOS et al. (2010), the two-step procedure developed by ENGLE & GRANGER (1987). The test is performed for the seven pairs of markets, formed by the combination of the central market and each of the other markets considered in the analysis. The results indicate that the prices in all the markets are co-integrated with the price in Paraná. This result suggests an inverse relationship between
the physical distance between the markets of Paraná and the degree of interdependence of prices in the long run. Markets that are a greater distance from Paraná have fewer market-related prices than that state.
After obtaining the co-integrating relationships and their residuals, the estimation of threshold autoregressive (TAR) models is carried out,
as specified in equation (4), as well as models (linear)
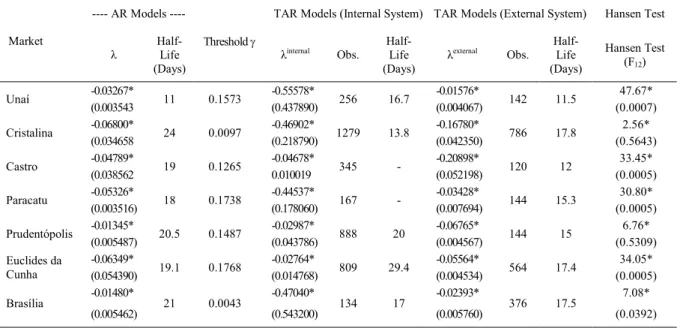
that do not consider the effects of transaction costs. Accordingly, the study attempted, like MATTOS et al. (2010), to provide subsidies to highlight the limitations of the analyses of Brazilian agricultural commodities. It was adopted the hypothesis that the transaction costs are higher in some markets than in others, depending mainly on the freight component, because it is directly related to the distance between the areas analyzed. The results are shown in table 2.
The first results presented are related to the estimation of linear AR models. The specification presents the autoregressive coefficients of the first order (λ). According to CAMPENHOUT (2007), the autoregression coefficients indicate the extent to
which the deviations from the long-term equilibrium
are fixed; therefore, they are considered as “adjustment speed coefficients”. MATTOS et al. (2010) point out that these coefficients are used to calculate the half-life, which is defined as the time required for half the
deviation of the ratio of co-integration to be eliminated.
The tests of the autoregressive coefficients of the estimated AR models are all significant at the 1% level.
The largest half-lives are associated with the more distant markets from Paraná, Bahia (38.8) and Goiás (26.3). The large amount of time required is consistent with the results of the tests showing the absence of co-integration between the prices of Bahia and those of Paraná. As for the markets that are present in Goiás, 24 days are required, so the value can be considered high, although for the markets of Goiás there is no co-integration with the markets of Paraná.
In relation to the inverse greater half-lives, which are considered the most distant from the lower half-lives, they are associated with the closest markets. As the court Paracatu has a half-life of 18 days and Unai has 11 days, a shock in respect to co-integration is eliminated.
The exception of a significant positive
relationship between the distance to the central market and the half-life is the market of Cristalina, which has a high half-life in relation to the other markets in the central market. One can attribute this effect to the fact that Cristalina is a city with large bean production; therefore, the region may have the greatest potential
Table 1 - Weak exogeneity test conducted for the regional bean markets for the period 2003-2011.
Potentially Exogenous Markets
Statistic Test1 P-value
Unaí 21.78654* 0.086012
Cristalina 20.00384* 0.164390
Castro 18.08764NS 0.260438
Paracatu 37.65386* 0.000008
Prudentópolis 39.00976* 0.000003 Euclides da Cunha 37.78765* 0.000006
Brasília 45.52879* 0.000000
Luziânia 40.87649* 0.000000
Source: Research results. 1 The test statistic follows x
² Distribution with degrees of freedom equal to the number of cointegrating vectors.
supply of beans. The positive relationship between the distance between the markets and the half-lives, as highlighted by MATTOS et al. (2010), indicates the existence of transaction costs that hinder or may even prevent the transmission of prices. Therefore, it is important to consider these costs, as is undertaken with the TAR models.
The threshold parameter values are shown in the fourth column of table 2. These parameters
define the boundary between the internal system,
estimated with the observations of which the residuals, in absolute value, are below the threshold, and the external arrangements, estimated with the observations of which the residuals are, in absolute values, larger than the threshold. As an example, the threshold estimated for Castro (0.1265) establishes that shocks less than 12.6% of the average price in the producing town are eliminated at a speed different from that presented by shocks that exceed this percentage of the price.
Regarding the autoregressive coefficients
of the internal regime, they are not statistically
significant for the more distant squares from Paraná,
such as Cristalina and Euclides da Cunha. However, when the deviations are relatively small, there is no co-integration between the prices of Paraná and those of each of these markets. At another point, the estimates
of the autoregressive coefficients in the external regime
show that in every market clashes in the equilibrium relationships that exceed the threshold values are eliminated over time. Regarding the calculated half-lives, it is clear that they are positively related to the distances between the markets and the city of Castro.
Under the internal system, for the markets closest to Paraná, such as Unaí and Paracatu, the time required for half of a shock in respect of co-integration to be eliminated is about 17 days less than the time required for distant markets such as Euclides da Cunha, with 30 days. In the external system, the largest half-lives refer to Cristalina, Euclides da Cunha and Brasília, which are markets located at greater distances from the central market. Those with smaller half-lives are Unaí and Castro, with an average of 12 days. These results are consistent, therefore, with the hypothesis of positive transaction costs related to the distance between markets. MATTOS et al. (2010) point
Table 2 - Estimates of autoregressive models (AR) and threshold autoregressive (TAR) models for residuals of the relations of co-integration between Paraná and the other markets, for the period 2003-2011.
---- AR Models ---- TAR Models (Internal System) TAR Models (External System) Hansen Test Market
λ Half-Life (Days)
Threshold γ
λinternal Obs.
Half-Life (Days)
λexternal Obs.
Half-Life (Days)
Hansen Test (F12)
Unaí -0.03267*
(0.003543 11 0.1573
-0.55578*
(0.437890) 256 16.7
-0.01576*
(0.004067) 142 11.5
47.67* (0.0007) Cristalina -0.06800*
(0.034658 24 0.0097
-0.46902*
(0.218790) 1279 13.8
-0.16780*
(0.042350) 786 17.8
2.56* (0.5643) Castro -0.04789*
(0.038562 19 0.1265
-0.04678*
0.010019 345
--0.20898*
(0.052198) 120 12
33.45* (0.0005) Paracatu -0.05326*
(0.003516) 18 0.1738
-0.44537*
(0.178060) 167
--0.03428*
(0.007694) 144 15.3
30.80* (0.0005) Prudentópolis -0.01345*
(0.005487) 20.5 0.1487
-0.02987*
(0.043786) 888 20
-0.06765*
(0.004567) 144 15
6.76* (0.5309) Euclides da
Cunha
-0.06349*
(0.054390) 19.1 0.1768
-0.02764*
(0.014768) 809 29.4
-0.05564*
(0.004534) 564 17.4
34.05* (0.0005) Brasília -0.01480*
(0.005462) 21 0.0043
-0.47040*
(0.543200) 134 17
-0.02393*
(0.005760) 376 17.5
7.08* (0.0392)
Source: Research results.
(1) The internal (external) regime is defined by the observations of which the deviations from equilibrium relationships, lagged in one period, in absolute values ([Zt-1]), are smaller (larger) than the value of the threshold parameter (γ);
(2) Test of the null hypothesis that the appropriate model is an AR (linear) model against the alternative hypothesis of a TAR with two regimes, from the Sup-Wald statistic F12; the figures in brackets refer to the standard errors of the statistical estimated parameters;
The values in brackets refer to the statistical p-value of F12 obtained from the bootstrap to waste, 2,000 simulations, according to the procedure proposed by HANSEN (1999);
out that the higher the transaction costs, the greater the time required for the elimination of price shocks.
These findings point out that, like the
results obtained by GOODWIN & PIGOTT (2001), CAMPENHOUT (2007) and MATTOS et al. (2010), the adjustments for possible deviations from equilibrium relationships not occurring with
long-term external arrangements are significantly faster
than those that occur in the internal system. Another point also highlighted by the authors is that the model with a threshold (TAR) presents adjustments faster than the AR model, which ignores the presence of the threshold. The last column listed in table 2 shows the linearity test of Hansen, used to test the statistical
significance threshold effect, namely the significance
for the model of the non-linear model imposed by the TAR. The threshold model, with the results being
significant at the 1% level, is the most suitable.
CONCLUSION
There are significant transaction costs
between the studied markets. Thus, the price adjustment to any changes in relative prices occurs differently depending on the magnitude of the deviation from the long-run equilibrium. Measures aiming to reduce transaction costs, such as improving infrastructure of transportation and communication,
reduced fees and financial costs and technical barriers
may contribute to the increased integration of markets, which possibly become more competitive.
ACKNOWLEDGEMENTS
The authors express their gratitude to Fundação de Amparo à Pesquisa do Estado de Goiás (FAPEG) for supporting
the first author with a scholarship during his Master in Agribusiness
at Federal University of Goiás.
REFERENCES
ALCHIAN, A.A.; DEMSETZ, H. Production, information costs, and economic organization. In: WILLIAMSON, O.E.; MASTEN, S.E. The economics of transaction costs. Cheltenham/UK, Northampton/MA: An Elgar Critical Writings Reader, [1972]1999. p.35-53. Available from: <http://www.jstor.org/stable/2527284>. Accessed: Dec. 19, 2013.
ASCHE, F. et al. Derived demand and price relationships: an analysis of the Norwegian cod sector. Stavanger (Norway): Centre for Fisheries Economics, 2001. 23p.
BALKE, N.S.; FOMBY, T.B. Threshold cointegration. International Economic Review, v.88, n.3, p.627-645, 1997. Available from: <http://www.jstor.org/stable/2527284>. Accessed: Feb. 22, 2014.
BARZEL, Y. Measurement cost and the organization of markets.
Journal of Law & Economics, v.25, p.27-78, 1982. Available from: <http://www.jstor.org/stable/725223>. Accessed: Jan. 23, 2014. CAMPENHOUT, B.V. Modelling trends in food market integration: Method and an application to Tanzanian maize markets. Food Policy, v.32, n.1, p.112-127, 2007. Available from: <http://www. sciencedirect.com/science/article/pii/S030691920600042X>. Accessed: Apr. 23, 2014. doi: 10.1016/j.foodpol.2006.03.011. EGGERTSSON, T. Economic behavior and institutions. New York: Cambridge University, 1995. 385p. (Cambridge Surveys of Economic Literature).
ELLIOT, G. et al. Efficient Tests for an Autoregressive Unit Root.
Econometrica, v.64, n.4, p.813-836, 1996. Available from: <http:// www.nber.org/papers/t0130.pdf>. Accessed: Jan. 23, 2014. doi: 10.3386/t0130.
ENGLE, R.F.; GRANGER, C.W. Co-integration and error-correction: representation, estimation and testing. Econometrica, v.55, n.2, p.251-276, 1987. Available from: <http://www.jstor.org/ stable/1913236>. Accessed: Nov. 08, 2013.
GOODWIN, B.K.; HOLT, M.T. Price transmission and asymmetric adjustment in the U.S. beef sector. American Journal of Agricultural Economics, v.81, n.3, p.630-637, 1999. Available from: <http://www.jstor.org/stable/1244026>. Accessed: Feb. 23, 2014. GOODWIN, B.K.; PIGOTT, N.E. Spatial market integration in the presence of threshold effects. American Journal of Agricultural Economics, v.83, n.2, p.302-317, 2001. Available from: <http:// ajae.oxfordjournals.org/content/83/2/302.short>. Accessed: Mar. 03, 2014. doi: 10.1111/0002-9092.00157.
HANSEN, B.E. Testing for linearity. Journal of Economic Surveys, v.13, n.5, p.551-576, 1999. Available from: <http:// onlinelibrary.wiley.com/doi/10.1111/1467-6419.00098/abstract>. Accessed: Apr. 08, 2014. doi: 10.1111/1467-6419.00098.
MATTOS, L.B. et al. Uma aplicação de modelos TAR para o mercado de carne de frango no Brasil. Revista Economia, v.11, n.3, p.537-557, 2010. Available from: <http://www.anpec.org.br/ revista/vol11/vol11n3p537_557.pdf>. Accessed: Feb. 19, 2014. MATTOS, L.B. et al. Modelos de cointegração com um ou dois limiares: uma aplicação para o preço do frango inteiro resfriado em mercados atacadistas no Brasil. Revista de Economia e Sociologia Rural, v.48, n.4, p.597-617, 2011. Available from: <http://www.scielo.br/scielo.php?pid=S0103-20032010000400005&script=sci_arttext&tlng=es>. Accessed: Mar. 12, 2014. doi: 10.1590/S0103-20032010000400005.
NORTH, D.C. Transaction costs through the time. In: MENARD, C. Transaction cost economics: recent developments. Cheltenham
(UK), Brookfield (US): Edward Elgar, 1997. p.149-160.
RAVALLION, M. Testing market integration. American Journal of Agricultural Economics, v.68, n.1, p.102-109, 1986. Available from: <http://ajae.oxfordjournals.org/content/68/1/102.short>. Accessed: Jan. 12, 2014. doi: 10.2307/1241654.
WILLIAMSON, O.E. The economic institutions of capitalism:
firms, markets and relational contracting. New York: The Free,