Sample size for estimate the average of
Passiflora caerulea
fruits traits
Dimensionamento amostral para estimação da média de caracteres de frutos de Passiflora caerulea
Cirineu Tolfo BandeiraI Sabrina Kitina Giordano FortesII Marcos ToebeIII Luciano SaifertIV Clevison Luiz GiacobboV Leocir José WelterVI
ISSN 1678-4596
ABSTRACT
The aim of this research was to determine the sample size needed to estimate the average of wild passion fruit (Passiflora caerulea) traits. It was collected randomly, 133, 99 and 133 fruit of wild passion fruit in 30, 21 and 29 plants, located respectively, in the cities of São Borja, Itaqui and Uruguaiana, on the west border of Rio Grande do Sul, Brazil, totaling 365 fruits harvested in 80 plants. In each fruit were measured ten traits: width, length, fruit, skin, and pulp weight, pulp yield, luminosity and tone of skin and pulp. Then, central tendency, dispersion and distribution measures were calculated and the normality of the data checked. After, it was determined the sample size needed to estimate the average for each character, assuming estimation errors equal to 1, 2, ...,
10% of the mean estimate with confidence levels of 95% and 99%. In wild passion fruit, 12 fruits are sufficient to estimate the mean
of luminosity and tone of the skin and pulp, with an estimation
error of 5% of the mean and 95% confidence, regardless of the
evaluation location (São Borja, Itaqui or Uruguaiana). In this same level of accuracy 36 fruits are needed to estimate the width and length, 52 fruits to estimate the pulp yield and 319 fruits for the evaluation of the fruit, skin and pulp weight.
Key words: wild passion fruit, experimental precision, experimental planning.
RESUMO
O objetivo deste trabalho foi determinar o tamanho de amostra necessário para a estimação da média de caracteres de frutos de maracujá-do-mato (Passiflora caerulea). Foram colhidos, aleatoriamente, 133, 99 e 133 frutos de maracujá-do-mato em 30, 21 e 29 plantas localizadas, respectivamente, nos municípios de São Borja, Itaqui e Uruguaiana, na fronteira oeste do estado do
Rio Grande do Sul, Brasil, totalizando 365 frutos colhidos em 80 plantas. Em cada fruto, foram mensurados dez caracteres: largura, comprimento, massa do fruto, da casca e da polpa, rendimento de polpa, luminosidade e tonalidade da casca e da polpa. A seguir, foram calculadas medidas de tendência central, de dispersão e de
distribuição e verificada a normalidade dos dados. Posteriormente,
foi determinado o tamanho de amostra necessário para a estimação da média de cada caractere, assumindo erros de estimação iguais
a 1, 2, ..., 10% da estimativa da média com graus de confiança de 95% e 99%. Em maracujá-do-mato, 12 frutos são suficientes para
a estimação da média de luminosidade e tonalidade da casca e da
polpa, com erro de estimação de 5% da média e 95% de confiança,
independentemente do local de avaliação (São Borja, Itaqui ou Uruguaiana). Nesse mesmo nível de precisão, são necessários 36 frutos para a estimação da largura e do comprimento, 52 frutos para a estimação da média de rendimento de polpa e 319 frutos para a avaliação das massas do fruto, da casca e da polpa.
Palavras-chave: Maracujá-do-mato, precisão experimental, planejamento experimental.
INTRODUCTION
The species Passiflora caerulea belongs to the Passifloraceae family and it is popularly
known as wild passion, blue passion flower or
red-pulp passion. According to MENDIONDO & AMELA GARCIA (2006), P. caerulea is
the Passifloraceae family species most widely
distributed in Latin America in the last century. As
IPrograma de Pós-graduação em Agronomia, Universidade Federal de Santa Maria (UFSM), Santa Maria, RS, Brasil. IIRicetec, Santa Maria, RS, Brasil.
IIICurso de Agronomia, Universidade Federal do Pampa (UNIPAMPA), Campus Itaqui, Rua Luiz Joaquim de Sá Britto, s/n, 97650-000,
Itaqui, RS, Brasil. E-mail: [email protected]. Corresponding author.
IVPrograma de Pós-graduação em Recursos Genéticos Vegetais, Universidade Federal de Santa Catarina (UFSC), Florianópolis, SC, Brasil. VDepartamento de Agronomia, Universidade Federal da Fronteira Sul (UFFS), Campus Chapecó, Chapecó, SC, Brasil.
VIDepartamento de Agronomia, Universidade Federal de Santa Catarina, Campus Curitibanos, Curitibanos, SC, Brasil
stated in DHAWAN et al. (2004), P. caerulea is native from Brazil and the fruit has been used for diuretics, painkillers, and sedatives purposes. The authors also pointed out that this species roots have been used due to its anthelmintic action. As reported by BUSILACCHI et al. (2008), the aerial part of P.
caerulea is used in the Argentinean pharmaceutical industry and traditional medicine to obtain compounds related to its sedative action. Moreover,
FELIÚ-HEMMELMANN et al. (2013) verified
that animals that received P. caerulea infusion decreased biomarkers associated with physiological stress, proving the phytotherapic action of this plant species. The wild passion plant has also been used as rootstocks of commercial passion fruit plants. In this sense, FUHRMANN et al. (2014) emphasized that
P. caerulea demonstrated high degree of resistance to bacterial spot disease caused by Xanthomonas
axonopodis pv. passiflorae, allowing it to be used as a disease resistance source.
The correct sample size dimensioning (number of plants and/or number of fruits) is required to have reliability in results obtained in research involving P. caerulea and other crops. According to BUSSAB & MORETTIN (2011), the sample size is proportional to the variability of the data and the desired reliability, being inversely proportional to the a priori error allowed by the researcher. The sample size dimensioning has been studied in several fruits, such as for the evaluation of fruit traits of peach (TOEBE et al., 2011, 2012) and apple cultivars (MIRANDA et al., 2007; TOEBE et al., 2011, 2014), evaluated at harvest and post-harvest. Furthermore, AVANZA et al. (2010) established the sample size for measuring the growth pattern and diameter of orange fruits ‘Valencia late’ and BARRY et al. (1999) reported the sample size required to estimate the juice content, total soluble solids, acidity, and ratio of orange fruits ‘Valencia’.
In Passifloraceae family species, the
sample size was determined to characterize the postharvest quality (COELHO et al., 2011) and for the characterization of pulp residues of yellow passion fruit (Passiflora edulis f. flavicarpa) (OLIVEIRA et al., 2011). Further, STORCK et al. (2014) determined the number of plants per plot and the plot number required for the evaluation of yellow passion fruit genotypes. However, sample size dimensioning studies to evaluate wild passion fruits were not found in the literature. Therefore, the aim of this research was to determine the sample size required to estimate the mean of fruit traits of wild passion (Passiflora caerulea).
MATERIALS AND METHODS
In November 2011, 133, 99, and 133 wild passion fruits (Passiflora caerulea) were randomly harvested in 30, 21, and 29 plants located, respectively, in the cities of São Borja, Itaqui, and Uruguaiana, on the west border of Rio Grande do Sul, Brazil, totaling 365 fruits harvested in 80 plants. All evaluated plants were georeferenced and they were located at the coordinates 28º40’S and 55º58’W of São Borja and 29º33’S and 56º51’W of Uruguaiana, with altitude ranging from 58.0 to 97.5 meters above the sea level. The 80 plants were randomly chosen
and a maximum of five fruits per plant was harvested.
These fruits were also randomly chosen at the physiological maturity stage in a single harvest. In some plants, the total number of fruits was less than
five because they did not have that number of fruits in
physiological maturity stage.
Immediately after harvest, the fruits were transported to the Interdisciplinary Biology Laboratory of the Universidade Federal do Pampa (Unipampa), campus of Itaqui, state of Rio Grande do Sul, located in the geographical coordinates of 29º09’S and 56º33’W. Subsequently, it was held measurements of the following traits in each fruit: width and length of the fruit, in mm, utilizing a caliper; fruit, skin, and pulp weight, in grams, utilizing a digital scale; pulp yield in % obtained from the ratio between pulp weight and total fruit weight; and, luminosity and tone of the skin and pulp, determined by electronic colorimeter with the Minolta CR310 model, as described by TOEBE et al. (2011), wherein two measurements were performed in opposite equatorially areas of each fruit to measure the luminosity and tone of the skin.
For each of the ten traits measured at each location (São Borja, Itaqui, and Uruguaiana), and overall (sum of the evaluated fruits in the three locations), it was calculated the statistics: minimum and maximum values, mean, median, standard
deviation, variance, coefficient of variation, kurtosis,
skewness and the p-value of normality Kolmogorov-Smirnov test. Subsequently, the means for each of the ten traits evaluated in the cities of São Borja, Itaqui, and Uruguaiana were compared through the
t test for independent samples, adopting α=5% of the
probability of error and bootstrap resampling with 10,000 simulations.
For each trait evaluated at each location (São Borja, Itaqui, and Uruguaiana) and overall, it was calculated the sample size (
h
) for theerrors) equal to 1, 2, ..., 10% of the estimated
mean (m) with degrees of confidence (1-α) of 95%
and 99%. For this, it was used the expression:
h=(t2 a/2.s
2)/(estimation error)2 (BUSSAB &
MORETTIN, 2011), being tα/2 the critical value of Student’s t-test distribution, whose area on the right is
equal to α/2 with (n-1) degrees of freedom, adopting α=5% and α=1% of the probability of error and an
estimated variance of s2. Thereafter, η was fixed in
133, 99, 133, and 365 fruits, respectively, for the evaluation sites of São Borja, Itaqui, Uruguaiana, and in overall. Moreover, the estimation error as a percentage of the estimated mean (m) was calculated
for each trait through the expression: estimation error=
(100ta/2. s)/(√hm), where s is the estimated standard deviation. Statistical analyzes were performed using the GENES program (CRUZ, 2013) and Microsoft
Office Excel® application.
RESULTS AND DISCUSSION
Overall, the means of the fruits evaluated in Itaqui and Uruguaiana were not statistically different (P>0.05) in length and fruit, skin, and pulp
weights. These values are greater (P≤0.05) than the means verified for these traits in fruits collected
in São Borja (Table 1). Pulp yield did not differ between the three locations, as well as the tone of the skin. Luminosity of the skin and pulp presented the greatest mean in fruits collected in Uruguaiana and tone of the pulp exhibited higher means in fruits collected in São Borja. The mean of fruit length
(39.58mm≤mean≤45.18mm) was lower than the
value obtained by SOUSA et al. (2012) in an access of P. cincinnata with mean of 50.36mm. Moreover,
the mean of fruit width (31.54mm≤mean≤35.92mm) and the mean of fruit weight (14.25g≤mean≤17.67g)
were also lower than those obtained by SOUSA et al. (2012) of 53.14mm and 74.41g, respectively. However, it has to be emphasized that it was not found data in the literature characterizing fruits of P.
caerulea that could be compared and discussed with the data of this study.
It was found that four, three and three of
the ten evaluated traits presented greater coefficients
of variation scores (CV), respectively, in the cities of São Borja, Itaqui, and Uruguaiana (Table 1). These data indicated that there was no tendency of greater or lower variability among evaluation sites and the CV scores were similar to those obtained with the data from the three sites combined. At the three sites and in the overall, there was wide variability of the
coefficient of variation among the ten measured traits
and the CV values increased in the following order:
skin luminosity (3.88%≤CV≤4.20%); skin tone, luminosity and tone of pulp (6.60%≤CV≤8.59%); width and length of fruits (11.28%≤CV≤15.11%); pulp yield (14.69%≤CV≤18.16%); and fruit, skin, and pulp weight (34.95%≤CV≤44.94%). The lowest CV score
of skin luminosity in relation to the pulp luminosity
can be explained in terms of the first obtained by
averaging two measurements at opposite fruit areas and the second one obtained from a single measurement. These data point to increasing variability and possibly increasing sample size for luminosity and tone of skin and pulp, fruit length and width, and pulp yield measurements, and greater variability between traits related to fruit, pulp, and skin weight.
With the exception of pulp tone assessed in fruits of São Borja and Uruguaiana, all other traits
adjusted to the normal distribution (P≥0.13), even with some cases statistically significant (P≤0.05) of
kurtosis (platykurtic or leptokurtic) and skewness (negative or positive) (Table 1). Considering the three locations combined, the normality of the data
was not verified only for skin weight and tone of
the skin and pulp, which can be related to the high
number of evaluated fruits (n=365 fruits). Thus, it can
be inferred that the data are suitable to estimate the sample size by the Student’s t-test distribution.
The sample size to estimate the mean of ten traits, with estimation error equal to 1% of the
mean and 95% of confidence, in fruits from São Borja fluctuated between 59 and 6,128 fruits, respectively
for the evaluation of skin luminosity and skin weight
(Table 2). In the same precision and confidence level,
the sample size ranged among 70 and 7,953 fruits, among 59 and 6,098 fruits, and among 62 and 6,832 fruits, respectively, to evaluate the skin luminosity and pulp weight of fruits deriving from Itaqui, Uruguaiana, and in the overall mean. For the mean estimation of ten traits with estimation error equal to
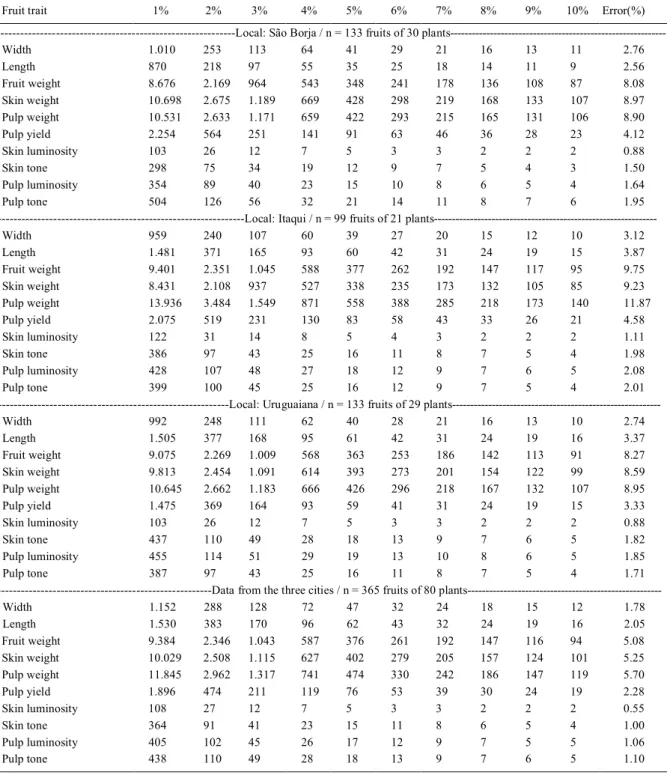
1% of the mean and 99% of confidence, the sample
size ranged among 103 and 10,698 fruits, among 122 and 13,936 fruits, among 103 and 10,645 fruits, and among 108 and 11,845 fruits, respectively, to evaluate fruits deriving from São Borja, Itaqui, Uruguaiana, and in the overall mean (Table 3). Sample sizes (number of fruits) were similar among the evaluation sites for the same trait and precision level.
Table 1 - Measurement unit (Un), minimum (Min), maximum (Max), mean, median, standard error (SE), variance (Var), coefficient of variation (CV%), kurtosis (KT), skewness (SK) and p-value of the Kolmogorov-Smirnov test for ten traits of wild passion fruits (Passiflora caerulea) evaluated in three cities of the west border of Rio Grande do Sul, Brazil.
Fruit trait Un Min Max Mean(1) Median SE Var CV% KT(2) SK(3) p-value
---Local: São Borja / n=133 fruits of 30
plants---Width mm 23.88 41.55 31.54c 31.35 0.33 14.70 12.16 2.86ns 0.38ns 0.71 Length mm 29.68 49.92 39.58b 39.20 0.39 19.94 11.28 2.42ns 0.11ns 0.80 Fruit weight g 5.02 30.27 14.25b 13.67 0.44 25.78 35.64 3.46ns 0.65* 0.61 Skin weight g 3.21 18.37 7.21b 6.60 0.25 8.14 39.57 5.60* 1.33* 0.25 Pulp weight g 1.19 14.22 7.04b 6.92 0.24 7.64 39.26 2.54ns 0.16ns 0.97 Pulp yield % 23.52 69.30 48.89ª 49.03 0.77 78.85 18.16 2.87ns -0.27ns 0.74 Skin luminosity un. 57.86 74.09 66.26ab 66.29 0.22 6.62 3.88 4.03* -0.37ns 0.59 Skin tone º 52.47 73.66 62.34ª 62.18 0.36 16.95 6.60 3.12ns 0.49* 0.54 Pulp luminosity un. 26.87 42.08 32.34b 32.03 0.20 5.41 7.19 4.78* 0.79* 0.43 Pulp tone º 25.88 40.33 30.42ª 30.10 0.23 6.83 8.59 5.32* 1.31* 0.03
---Local: Itaqui / n = 99 fruits of 21
plants---Width mm 24.50 44.03 35.92ª 36.79 0.43 17.91 11.78 3.02ns -0.66* 0.29 Length mm 29.49 63.69 45.04ª 45.45 0.66 43.52 14.65 3.81ns 0.23ns 0.27 Fruit weight g 5.50 34.89 17.67ª 18.16 0.66 42.52 36.91 2.36ns -0.01ns 0.46 Skin weight g 3.36 20.54 9.11ª 8.84 0.32 10.14 34.95 4.20* 0.71* 0.68 Pulp weight g 1.59 17.52 8.56ª 8.42 0.39 14.78 44.94 2.31ns 0.08ns 0.64 Pulp yield % 22.30 63.26 46.85ª 47.16 0.82 65.97 17.34 3.57ns -0.62* 0.62 Skin luminosity un. 58.72 73.20 65.60b 65.47 0.28 7.59 4.20 2.95ns 0.04ns 0.85 Skin tone º 53.63 76.89 62.63ª 61.47 0.47 21.94 7.48 2.78ns 0.46ns 0.16 Pulp luminosity un. 25.81 38.67 32.54ab 32.35 0.26 6.55 7.87 2.97ns 0.23ns 0.36 Pulp tone º 25.25 35.46 29.68b 29.13 0.23 5.08 7.60 2.90ns 0.56* 0.24
---Local: Uruguaiana / n = 133 fruits of 29
plants---Width mm 22.62 43.79 34.35b 33.87 0.36 17.13 12.05 3.05ns -0.01ns 0.60 Length mm 33.39 59.85 45.18ª 43.94 0.58 44.94 14.84 2.05* 0.24ns 0.39 Fruit weight g 3.97 32.95 16.20ª 14.85 0.51 34.86 36.45 2.97ns 0.43* 0.14 Skin weight g 2.49 16.92 8.40ª 7.65 0.28 10.15 37.90 2.88ns 0.64* 0.13 Pulp weight g 1.18 19.92 7.79ª 7.64 0.27 9.46 39.47 4.36* 0.51* 0.87 Pulp yield % 27.84 62.07 47.62ª 47.75 0.61 48.95 14.69 2.99ns -0.25ns 0.90 Skin luminosity un. 59.84 72.88 66.52ª 66.54 0.22 6.65 3.88 2.84ns 0.01ns 0.99 Skin tone º 50.58 79.76 62.76ª 61.70 0.44 25.17 7.99 3.95* 0.78* 0.18 Pulp luminosity un. 26.26 40.55 32.95ª 32.60 0.23 7.23 8.16 3.22ns 0.29ns 0.54 Pulp tone º 25.95 37.93 29.43b 29.02 0.19 4.90 7.52 5.56* 1.36* 0.04 ---Data from the three cities / n = 365 fruits of 80 plants
---Width mm 22.62 44.03 33.75 33.65 0.23 19.57 13.11 2.44* 0.01ns 0.96 Length mm 29.49 63.69 43.10 42.60 0.34 42.38 15.11 2.97ns 0.47* 0.22 Fruit weight g 3.97 34.89 15.89 14.94 0.31 35.32 37.41 2.77ns 0.42* 0.09 Skin weight g 2.49 20.54 8.16 7.70 0.17 9.96 38.67 3.75* 0.85* 0.03 Pulp weight g 1.18 19.92 7.73 7.51 0.17 10.54 42.03 3.18ns 0.37* 0.74 Pulp yield % 22.30 69.30 47.87 48.04 0.42 64.79 16.81 3.20ns -0.32* 0.88 Skin luminosity un. 57.86 74.09 66.18 66.27 0.14 6.99 4.00 3.22ns -0.13ns 0.92 Skin tone º 50.58 79.76 62.57 61.80 0.24 21.21 7.36 3.53* 0.64* 0.03 Pulp luminosity un. 25.81 42.08 32.62 32.30 0.13 6.42 7.77 3.51* 0.44* 0.08 Pulp tone º 25.25 40.33 29.86 29.36 0.13 5.81 8.07 5.06* 1.18* 0.01
(1)The means of each trait measured in three cities (São Borja, Itaqui and Uruguaiana), followed by the same letter not differ by t test, at 5% probability and bootstrap resampling with 10,000 simulations. (2) * Kurtosis differs from three by t test at 5% probability. ns = non-significant. (3) * Skewness differs from zero by t test at 5% probability. ns = non-significant.
Table 2 - Sample size (i.e., number of fruits) to estimate the mean of ten traits of wild passion fruits (Passiflora caerulea) with estimation error equal to: 1, 2, ..., 10% of estimated mean with 95% confidence level and semiamplitude of the confidence interval (Error %), based on 133, 99, 133 and 365 fruits, respectively, in the cities of São Borja, Itaqui and Uruguaiana and in general.
Fruit trait 1% 2% 3% 4% 5% 6% 7% 8% 9% 10% Error(%)
---Local: São Borja / n = 133 fruits of 30
plants---Width 579 145 65 37 24 17 12 10 8 6 2.09
Length 499 125 56 32 20 14 11 8 7 5 1.94
Fruit weight 4.970 1.243 553 311 199 139 102 78 62 50 6.12
Skin weight 6.128 1.532 681 383 246 171 126 96 76 62 6.79
Pulp weight 6.033 1.509 671 378 242 168 124 95 75 61 6.74
Pulp yield 1.292 323 144 81 52 36 27 21 16 13 3.12
Skin luminosity 59 15 7 4 3 2 2 1 1 1 0.67
Skin tone 171 43 19 11 7 5 4 3 3 2 1.14
Pulp luminosity 203 51 23 13 9 6 5 4 3 3 1.24
Pulp tone 289 73 33 19 12 9 6 5 4 3 1.48
---Local: Itaqui / n = 99 fruits of 21
plants---Width 547 137 61 35 22 16 12 9 7 6 2.36
Length 845 212 94 53 34 24 18 14 11 9 2.93
Fruit weight 5.365 1.342 597 336 215 150 110 84 67 54 7.37
Skin weight 4.811 1.203 535 301 193 134 99 76 60 49 6.98
Pulp weight 7.953 1.989 884 498 319 221 163 125 99 80 8.97
Pulp yield 1.184 296 132 74 48 33 25 19 15 12 3.46
Skin luminosity 70 18 8 5 3 2 2 2 1 1 0.84
Skin tone 221 56 25 14 9 7 5 4 3 3 1.50
Pulp luminosity 244 61 28 16 10 7 5 4 4 3 1.57
Pulp tone 228 57 26 15 10 7 5 4 3 3 1.52
---Local: Uruguaiana / n = 133 fruits of 29 plants
---Width 569 143 64 36 23 16 12 9 8 6 2.07
Length 862 216 96 54 35 24 18 14 11 9 2.55
Fruit weight 5.199 1.300 578 325 208 145 107 82 65 52 6.26
Skin weight 5.621 1.406 625 352 225 157 115 88 70 57 6.51
Pulp weight 6.098 1.525 678 382 244 170 125 96 76 61 6.78
Pulp yield 845 212 94 53 34 24 18 14 11 9 2.53
Skin luminosity 59 15 7 4 3 2 2 1 1 1 0.67
Skin tone 251 63 28 16 11 7 6 4 4 3 1.38
Pulp luminosity 261 66 29 17 11 8 6 5 4 3 1.40
Pulp tone 222 56 25 14 9 7 5 4 3 3 1.30
---Data from the three cities / n = 365 fruits of 80 plants
---Width 665 167 74 42 27 19 14 11 9 7 1.35
Length 883 221 99 56 36 25 19 14 11 9 1.56
Fruit weight 5.412 1.353 602 339 217 151 111 85 67 55 3.86
Skin weight 5.785 1.447 643 362 232 161 119 91 72 58 3.99
Pulp weight 6.832 1.708 760 427 274 190 140 107 85 69 4.33
Pulp yield 1.094 274 122 69 44 31 23 18 14 11 1.74
Skin luminosity 62 16 7 4 3 2 2 1 1 1 0.42
Skin tone 210 53 24 14 9 6 5 4 3 3 0.76
Pulp luminosity 234 59 26 15 10 7 5 4 3 3 0.80
Table 3 - Sample size (i.e., number of fruits) to estimate the mean of ten traits of wild passion fruits (Passiflora caerulea) with estimation error equal to: 1, 2, ..., 10% of estimated mean with 99% confidence level and semiamplitude of the confidence interval (Error %), based on 133, 99, 133 and 365 fruits, respectively, in the cities of São Borja, Itaqui and Uruguaiana and in general.
Fruit trait 1% 2% 3% 4% 5% 6% 7% 8% 9% 10% Error(%)
---Local: São Borja / n = 133 fruits of 30
plants---Width 1.010 253 113 64 41 29 21 16 13 11 2.76
Length 870 218 97 55 35 25 18 14 11 9 2.56
Fruit weight 8.676 2.169 964 543 348 241 178 136 108 87 8.08
Skin weight 10.698 2.675 1.189 669 428 298 219 168 133 107 8.97
Pulp weight 10.531 2.633 1.171 659 422 293 215 165 131 106 8.90
Pulp yield 2.254 564 251 141 91 63 46 36 28 23 4.12
Skin luminosity 103 26 12 7 5 3 3 2 2 2 0.88
Skin tone 298 75 34 19 12 9 7 5 4 3 1.50
Pulp luminosity 354 89 40 23 15 10 8 6 5 4 1.64
Pulp tone 504 126 56 32 21 14 11 8 7 6 1.95
---Local: Itaqui / n = 99 fruits of 21
plants---Width 959 240 107 60 39 27 20 15 12 10 3.12
Length 1.481 371 165 93 60 42 31 24 19 15 3.87
Fruit weight 9.401 2.351 1.045 588 377 262 192 147 117 95 9.75
Skin weight 8.431 2.108 937 527 338 235 173 132 105 85 9.23
Pulp weight 13.936 3.484 1.549 871 558 388 285 218 173 140 11.87
Pulp yield 2.075 519 231 130 83 58 43 33 26 21 4.58
Skin luminosity 122 31 14 8 5 4 3 2 2 2 1.11
Skin tone 386 97 43 25 16 11 8 7 5 4 1.98
Pulp luminosity 428 107 48 27 18 12 9 7 6 5 2.08
Pulp tone 399 100 45 25 16 12 9 7 5 4 2.01
---Local: Uruguaiana / n = 133 fruits of 29
plants---Width 992 248 111 62 40 28 21 16 13 10 2.74
Length 1.505 377 168 95 61 42 31 24 19 16 3.37
Fruit weight 9.075 2.269 1.009 568 363 253 186 142 113 91 8.27
Skin weight 9.813 2.454 1.091 614 393 273 201 154 122 99 8.59
Pulp weight 10.645 2.662 1.183 666 426 296 218 167 132 107 8.95
Pulp yield 1.475 369 164 93 59 41 31 24 19 15 3.33
Skin luminosity 103 26 12 7 5 3 3 2 2 2 0.88
Skin tone 437 110 49 28 18 13 9 7 6 5 1.82
Pulp luminosity 455 114 51 29 19 13 10 8 6 5 1.85
Pulp tone 387 97 43 25 16 11 8 7 5 4 1.71
---Data from the three cities / n = 365 fruits of 80 plants
---Width 1.152 288 128 72 47 32 24 18 15 12 1.78
Length 1.530 383 170 96 62 43 32 24 19 16 2.05
Fruit weight 9.384 2.346 1.043 587 376 261 192 147 116 94 5.08
Skin weight 10.029 2.508 1.115 627 402 279 205 157 124 101 5.25
Pulp weight 11.845 2.962 1.317 741 474 330 242 186 147 119 5.70
Pulp yield 1.896 474 211 119 76 53 39 30 24 19 2.28
Skin luminosity 108 27 12 7 5 3 3 2 2 2 0.55
Skin tone 364 91 41 23 15 11 8 6 5 4 1.00
Pulp luminosity 405 102 45 26 17 12 9 7 5 5 1.06
traits of apple ‘Royal Gala’, with estimation error of 1% of the mean, ranged from 137 to 1,200 fruits at harvest and from 63 to 2,194 fruits after cold storage. Further, in ‘Fuji’ apples, the authors reported that the sample size varied between 259 and 2,559 fruits at harvest and between 46 and 4,739 fruits after cold storage. In the same precision level, TOEBE et al. (2012) observed that to estimate the mean of traits of peach ‘Eldorado’, it is necessary to measure 31 to 1,954 fruits at harvest and from 33 to 4,213 fruits
after cold storage. For measurement of pulp firmness,
luminosity, intensity and tone of the background color of peach epidermis of ‘Eragil’ and apple ‘Royal Gala’ under different storage conditions; it was observed sample sizes from 52 to 11,933 fruits and from 111 to 539 fruits, respectively, for peach and apple (TOEBE et al., 2011).
In the present study, high variability of the sample size was observed among traits, requiring 70, 251, 261, 289, 665, 883, 1,292, 5,412, 6,128, and 7,953 fruits, respectively, to evaluate the skin luminosity, skin tone, pulp luminosity, pulp tone, fruit width, fruit length, pulp yield, fruit weight, skin weight, and pulp weight, with a maximum error of no more than 1% of the mean
and 95% of confidence, regardless of the evaluation
site (Table 2). In general, there was an increase in the sample size in the measurements of luminosity and tone of the skin, luminosity and tone of the pulp, fruit width and length, and pulp yield and greater sample size to measure the weight of fruit, skin, and pulp.
In peach and apple, TOEBE et al. (2011) reported the necessity of larger sample size to assess
the pulp firmness when compared to the epidermis
background color. In peach ‘Eldorado’, TOEBE et al. (2012) observed that larger sample sizes are required
to estimate the mean of pulp firmness, followed by
the mass, ratio, and acidity. In the same study, smaller sample sizes were required to estimate the mean of juice content, length, diameter (greater and smaller), coloring, and total soluble solids. In two apple cultivars, TOEBE et al. (2014) reported that a larger sample size is required to estimate the ethylene production, ratio, respiration, weight, and acidity in relation to the one required for
measuring length, pulp firmness, total soluble solids,
diameters (greater and smaller), and juice content. Moreover, in orange ‘Valencia’, BARRY et al. (1999) recommended the measurement of 80 fruits (four fruits/ plant×20 plants) to determine the juice content, total soluble solids, acidity, and ratio. Furthermore, in orange ‘Valencia late’, AVANZA et al. (2010) recommended the measurement of 210 fruits (30 fruits/plant×7 plants) to determine the growth pattern and fruit diameter with estimation error of 2 to 3% of the mean.
It was verified in this research that the measurement of 12 fruits is sufficient to estimate
the mean of luminosity and tone of the skin and pulp, regardless the evaluation site with maximum estimation error of 5% of the mean and 95% of
confidence. In the same precision, 36 fruits are
required to estimate the mean of fruit width and length, 52 fruits to estimate mean of pulp yield, and 319 fruits to evaluate the weight of fruit, skin and pulp (Table 2). Further, the estimation error committed with the use of 133 fruits collected in
São Borja fluctuated between 0.67% and 6.79% to
measure the luminosity and weight of the skin, with
95% of confidence. In Itaqui, the estimation error
committed based on 99 evaluated fruits varied from 0.84% to 8.97%, respectively, for skin luminosity and pulp weight. In Uruguaiana, the estimation error
based on 133 evaluated fruits fluctuated between
0.67% and 6.78%, respectively, for skin luminosity and pulp weight. In general, the estimation error based on 365 evaluated fruits ranged from 0.42% to 4.33%, respectively, for skin luminosity and pulp
weight, with 95% of confidence.
CONCLUSION
In wild passion fruit, 12 fruits are
sufficient to estimate the mean of luminosity and tone
of the skin and pulp, with an estimation error of 5%
of the mean and 95% confidence, regardless of the
evaluation location (São Borja, Itaqui or Uruguaiana). In this same level of accuracy 36 fruits are needed to estimate the width and length, 52 fruits to estimate the pulp yield and 319 fruits for the evaluation of the fruit, skin and pulp weight.
ACKNOWLEDGEMENTS
To the Universidade Federal do Pampa (UNIPAMPA)
for financial and laboratory support.
REFERENCES
AVANZA, M.M. et al. Optimal sample size for evaluate the growth pattern of ‘Valencia late’ orange fruit. Revista Brasileira de Fruticultura, v.32, n.4, p.1154-1163, 2010. Available from: <http:// dx.doi.org/10.1590/S0100-29452010005000132>. Accessed: Dec. 29, 2015. doi: 10.1590/S0100-29452010005000132.
BARRY, G.H. et al. Estimating optimal sample size for sweet orange fruit quality experiments. HortScience, v.34, n.3, p.483-484, 1999. Available from: <http://hortsci.ashspublications.org/ content/34/3/483.5.abstract>. Accessed: Dec. 29, 2015.
BUSILACCHI, H. et al. Field culture of micropropagated
Latinoamericano y del Caribe de Plantas Medicinales y Aromaticas, v.7, n.5, p.257-263, 2008. Available from: <http://www.
redalyc.org/articulo.oa?id=85670504>. Accessed: Dec. 29, 2015.
BUSSAB, W.O.; MORETTIN, P.A. Estatística básica. 7.ed. São Paulo: Saraiva, 2011. 540p.
COELHO, A.A. et al. Sample size for postharvest quality characterization of yellow passion fruits. Revista Ceres, v.58, n.1, p.23-28, 2011. Available from: <http://dx.doi.org/10.1590/S0034-737X2011000100004>. Accessed: Dec. 29, 2015. doi: 10.1590/ S0034-737X2011000100004.
CRUZ, C.D. GENES - a software package for analysis in experimental statistics and quantitative genetics. Acta Scientiarum Agronomy, v.35, n.3, p.271-276, 2013. Available from: <http:// dx.doi.org/10.4025/actasciagron.v35i3.21251>. Accessed: Dec. 29, 2015. doi: 10.4025/actasciagron.v35i3.21251.
DHAWAN, K. et al. Passiflora: a review update. Journal of Ethnopharmacology, v.94, n.1, p.1-23, 2004. Available from: <http://dx.doi.org/10.1016/j.jep.2004.02.023>. Accessed: Dec. 29, 2015. doi: 10.1016/j.jep.2004.02.023.
FELIÚ-HEMMELMANN, K. et al. Melissa officinalis and
Passiflora caerulea infusion as physiological stress decreaser.
International Journal of Clinical and Experimental Medicine, v.6, n.6, p.444-451, 2013. Available from: <http:// www.ncbi.nlm.nih.gov/pmc/articles/PMC3703115/>. Accessed: Dec. 29, 2015.
FUHRMANN, E. et al. Reaction of interspecific hybrids of
Passiflora spp. to Xanthomonas axonopodis pv. passiflorae.
Ciência Rural, v.44, n.8, p.1404-1410, 2014. Available from: <http://dx.doi.org/10.1590/0103-8478cr20121092>. Accessed: Dec. 29, 2015. doi: 10.1590/0103-8478cr20121092.
LÚCIO, A.D. et al. Relations between variables in passion fruit.
Ciência Rural, v.43, n.2, p.225-232, 2013. Available from: <http:// dx.doi.org/10.1590/S0103-84782013000200006>. Accessed: Dec. 29, 2015. doi: 10.1590/S0103-84782013000200006.
MENDIONDO, G.M.; AMELA GARCÍA, M.T. Emergence of
Passiflora caerulea seeds simulating possible natural destinies.
Fruits, v.61, n.4, p.251-258, 2006. Available from: <http://dx.doi.
org/10.1051/fruits:2006022>. Accessed: Dec. 29, 2015. doi: 10.1051/fruits:2006022.
MIRANDA, C. et al. Random sample estimates of tree mean for fruit size and colour in apple. Scientia Horticulturae, v.112, n.1, p.33-41, 2007. Available from: <http://dx.doi.org/10.1016/j. scienta.2006.12.006>. Accessed: Dec. 29, 2015.doi: 10.1016/j. scienta.2006.12.006.
OLIVEIRA, E.M.S.de et al. Characterization of yellow passion fruit pulp wastes. Ciência Rural, v.41, n.4, p.725-730, 2011. Available from: <http://dx.doi.org/10.1590/S0103-84782011005000031>. Accessed: Dec. 29, 2015. doi: 10.1590/ S0103-84782011005000031.
SOUSA, L.B.de et al. Characterization and genetic divergence of access of Passiflora edulis and P. cincinnata based on physical and chemical characteristics of fruits. Revista Brasileira de Fruticultura, v.34, n.3, p.832-839, 2012. Available from: <http:// dx.doi.org/10.1590/S0100-29452012000300024>. Accessed: Dec. 29, 2015. doi: 10.1590/S0100-29452012000300024.
STORCK, L. et al. Scaling the number of plants per plot and number of plots per genotype of yellow passion fruit plants. Acta Scientiarum. Agronomy, v.36, n.1, p.73-78, 2014. Available from: <http://dx.doi.org/10.4025/actasciagron.v36i1.17697>. Accessed: Dec. 29, 2015. doi: 10.4025/actasciagron.v36i1.17697.
TOEBE, M. et al. Sample size to evaluate the flesh firmness and
epidermis color in peach and apple. Revista Ciência Agronômica, v.42, n.4, p.1026-1035, 2011. Available from: <http://dx.doi. org/10.1590/S1806-66902011000400027>. Accessed: Dec. 29, 2015. doi: 10.1590/S1806-66902011000400027.
TOEBE, M. et al. Sample size to estimate the average peach characters at harvest and after cold storage. Ciência Rural, v.42, n.2, p.209-212, 2012. Available from: <http://www.scielo.br/ pdf/cr/v42n2/a5912cr4891.pdf>. Accessed: Dec. 29, 2015. doi: 10.1590/S0103-84782012000200004.