Sample size for estimating average productive traits of pigeon pea
Tamanho de amostra para a estimação da média de caracteres produtivos de feijão guandu
Giovani FaccoI Alberto Cargnelutti FilhoII Bruna Mendonça AlvesI Cláudia BurinI
Gustavo Oliveira dos SantosIII Jéssica Andiara KleinpaulIV Ismael Mario Márcio NeuIV
ISSN 1678-4596
ABSTRACT
The objectives of this study were to determine the sample size, in terms of number of plants, needed to estimate the average values of productive traits of the pigeon pea and to determine whether the sample size needed varies between traits and between crop years. Separate uniformity trials were conducted in 2011/2012 and 2012/2013. In each trial, 360 plants were demarcated, and the fresh and dry masses of roots, stems, and leaves and of shoots and the total plant were evaluated during blossoming for 10 productive traits. Descriptive statistics were calculated, normality and randomness were checked, and the sample size was calculated. There was variability in the sample size between the productive traits and crop years of the pigeon pea culture. To estimate the averages of the productive traits with a 20% maximum estimation error and 95% confidence level, 70 plants are sufficient.
Key words: Cajanus cajan L., sample size, experimental precision.
RESUMO
Os objetivos deste trabalho foram determinar o tamanho de amostra, em número de plantas, para a estimação da média de caracteres produtivos de feijão guandu e verificar se há variabilidade do tamanho de amostra entre caracteres e anos agrícolas. Foram conduzidos dois ensaios de uniformidade, um em 2011/2012 e o outro em 2012/2013. Em cada ensaio, foram demarcadas 360 plantas e, no florescimento, foram avaliadas as massas verde e seca de raiz, caule, folha, parte aérea e total, totalizando dez caracteres produtivos. Foram calculadas estatísticas descritivas, verificada a normalidade e a aleatoriedade e calculado o tamanho de amostra. Na cultura de feijão guandu, há variabilidade do tamanho de amostra entre os caracteres produtivos e entre os anos agrícolas. Para a estimação da média dos caracteres
produtivos, com erro de estimação máximo de 20% da média e com grau de confiança de 95%, 70 plantas são suficientes.
Palavras-chave: Cajanus cajan L., dimensionamento amostral, precisão experimental.
INTRODUCTION
The pigeon pea (Cajanus cajan (L.) Millsp.) is a legume used in green manure that produces fresh and dry material for soil coverage (SUZUKI & ALVES, 2006; FINHOLDT et al., 2009; CAVALCANTE et al., 2012) used in the recovery of degraded areas (RAYOL & ALVINO-RAYOL, 2012) and as livestock feed (ALENCAR et al., 2014).
The assessment of a large number of traits in all individuals of a population may be unfeasible in agricultural experiments due to
limited personnel, financial and time resources.
Thus, sampling techniques offer advantages, as they enable the estimation of parameters of plant population to the desired precision (BUSSAB & MORETTIN, 2011). Appropriate sample size for each agricultural crop should be investigated, and is dependent on the variability of the traits being estimated and the researcher’s desired precision. Larger sample sizes provide higher experimental precision since they decrease the variance of the
IPrograma de Pós-graduação em Agronomia, Universidade Federal de Santa Maria (UFSM), Santa Maria, RS, Brasil.
IIDepartamento de Fitotecnia, Centro de Ciências Rurais (CCR), Universidade Federal de Santa Maria, 97105-900, Santa Maria, RS,
Brasil. E-mail: [email protected]. Corresponding author.
IIIPrograma de Pós-graduação em Engenharia Agrícola, Universidade Federal de Santa Maria (UFSM), Santa Maria, RS, Brasil. IVCurso de Agronomia, Universidade Federal de Santa Maria (UFSM), Santa Maria, RS, Brasil.
sample mean. However, large sample sizes may not be feasible, as they need larger experimental
areas and more financial resources and personnel.
Conversely, smaller sample sizes reduce experimental precision (STORCK et al., 2011).
Studies to determine the sample size of productive traits have been carried out for castor bean (CARGNELUTTI FILHO et al., 2010), white lupine (BURIN et al., 2014), forage turnip (CARGNELUTTI FILHO et al., 2014), and black oat crops (CARGNELUTTI FILHO et al., 2015). However, no studies were found in the literature that determines the sample size required to estimate averages of the productive traits of pigeon pea crops. Thus, the objectives of this study were to determine the sample size, in terms of number of plants, needed to estimate the average of the productive traits of pigeon pea (Cajanus cajan (L.) Millsp.) crops and to check whether the necessary sample size varies between traits and between crop years.
MATERIAL AND METHODS
Two uniformity trials (control tests, i.e., without treatment) were conducted with the pigeon pea (Cajanus cajan (L.) Millsp.) cultivar ‘BRS Mandarim’. In the uniformity trials, sowing, fertilization, culturing, harvesting, and evaluations were conducted uniformly across the experimental
area. The first trial was carried out in the 2011/2012
crop year, and the second in 2012/2013. Both trials were conducted in the same experimental area of the Department of Plant Science of the Universidade Federal de Santa Maria, Rio Grande do Sul (latitude
29°42′S, longitude 53°49′W, elevation 95m). According to Köppen’s classification, the regional climate is classified as Cfa, humid subtropical with hot summers and no defined dry season (HELDWEIN
et al., 2009), and the soil is a dystrophic red sandy latosol (SANTOS et al., 2006).
On 26 January 2012, during the first crop
year (2011/2012), broadcast seeding with a density of 20 seeds m-2 was carried out in a 28m×66m (1,848m2)
area. On 20 November 2012, during the second crop year (2012/2013), in the same 28m×66m (1,848m2)
area, seeds were sown at a density of 20 seeds m-2
in rows spaced 0.50m apart. The basal fertilization applied in both crop years was 40kg ha-1 of N, 160kg
ha-1 of P
2O5, and 160kg ha -1 of K
2O (only N-P-K at
a 05-20-20 ratio). In both crop years, the number of plants was counted daily, and the emergence date
was defined as the date when 50% of the plants were visible. In the first and second crop years,
seeds emerged on 31 January 2012 and 1 December 2012, respectively. In each crop year, 360 points were demarcated in a central 1,440-m2 part of the
experimental area (growth area). These points were spaced 2m×2m apart; therefore, each point accounted for a 4-m2 area. These 360 points formed a matrix of
30 rows and 12 columns. A stake demarcated each point, and the closest plant to the stake was selected for evaluation. The 360 plants were assumed to be representative of all plants in the 1,440-m2 area.
Evaluations were carried out during the
blossoming of the plants, that is, in the first crop year,
at 125 days after sowing (DAS) (30 May 2012), and in the second year, at 162 DAS (1 May 2013). In each crop year, the tagged plants (360 plants) were harvested, the root fresh mass (RFM), stem fresh mass (SFM), and leaf fresh mass (LFM) were weighed, and the fresh mass of shoots (FMOS=SFM+LFM) and total fresh mass (TFM=RFM+SFM+LFM) were calculated in grams per plant. After that, the plants were wrapped in packing paper, labeled, and placed in a forced-air circulation oven at 60°C until a constant weight was reached. Subsequently, the root dry mass (RDM), stem dry mass (SDM), and leaf dry mass (LDM) were weighed, and the dry mass of shoots (DMOS=SDM+LDM) and total dry mass (TDM=RDM+SDM+LDM) were calculated in grams per plant.
Throughout the crop’s growth cycle in both crop years, the minimum and maximum air temperatures in °C and rainfall in mm were recorded daily at the Automatic Experimental Station of the Universidade Federal de Santa Maria, located 30m from the experimental area. The average daily air temperature, in °C, was calculated as the arithmetic mean of the minimum and maximum air temperatures.
The following statistics were calculated for each of the 10 traits evaluated in each crop year: minimum (min), maximum (max), mean (x), median (med), standard deviation (s), standard error of the
mean (se), coefficient of variation (CV, as a percentage),
Subsequently, for each trait in each crop year, the sample size (n) was calculated for the
semi-amplitude of the confidence interval (estimation error), set at 2%, 4%, 6%, 8%, 10%, 12%, 14%, 16%, 18%, and 20% of the average (x) of each trait, that is, from 0.02x (high precision) up to 0.20x
(low precision), with a 95% confidence level (1-α).
The expression n=
[
(
tá/2s)
(estimationerror)]
2 wasused (BUSSAB & MORETTIN, 2011), in which tα/2
is the critical value of the Student’s t distribution, such that P(t>tα/2)=α/2, with a 5% probability of
error and n-1 degrees of freedom (359 degrees of freedom in this study), where s is the estimate of the standard deviation.
From the equation used to calculate the sample size, n was set at 360 plants, which was the number of sampled plants each year, and the estimation
error (semi-amplitude of the confidence interval)
was calculated as a percentage of the estimated average (x, for each trait, using the equation:
. The statistical analyses were conducted using the GENES application (CRUZ, 2013) and Microsoft
Office Excel®.
RESULTS AND DISCUSSION
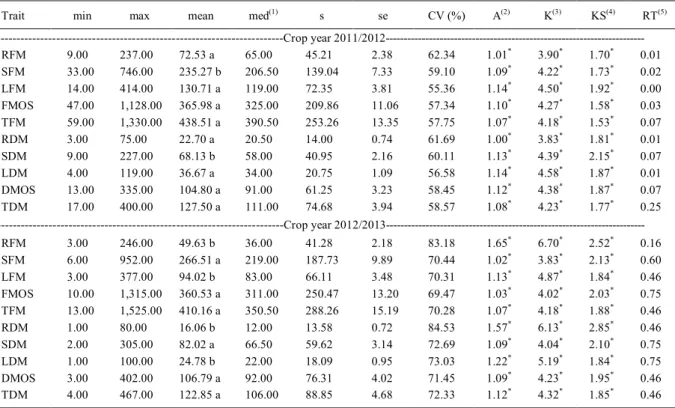
The minimum and maximum values of root fresh mass (RFM), stem fresh mass (SFM), leaf fresh mass (LFM), fresh mass of shoots (FMOS), total fresh mass (TFM), root dry mass (RDM), stem dry mass (SDM), leaf dry mass (LDM), dry mass of shoots (DMOS), and total dry mass (TDM) traits in grams per plant (Table 1), in both crop years, showed variability among the sampled plants. The variability among the 360 plants in each crop year, and between crop years, is important in determining the
appropriate sample size, as it reflects real situations in field conditions. In addition to environmental
variations between crop years (Figure 1A and 1B), this variability is likely associated with the fact that distinct sowing systems were used (broadcast and row seeding), and the different durations for
which plants were in the field prior to evaluation
(125 and 162 DAS).
In the 2011/2012 crop year, the 360 plants
sampled had an average RFM (72.53g∙plant-1) and
LFM (130.71g∙plant-1) higher than the average RFM
(49.63g∙plant-1) and LFM (94.02g∙plant-1) obtained in
the 360 plants sampled in the 2012/2013 crop year. The SFM showed the opposite behavior, i.e., the
average in the 2011/2012 crop year (235.27g∙plant-1)
was lower than that in the 2012/2013 crop year
(266.51g∙plant-1) (Table 1). This change in behavior
possibly explains the fact that the average of the fresh mass of shoots (FMS=SFM+LFM) and the total fresh mass (TFM=RFM+SFM+LFM) did not differ between crop years. Consequently, as expected, the traits related to the dry mass (RDM, SDM, LDM, DMOS, and TDM) exhibited the same behavior between the crop years as the traits related to the fresh mass (RFM, SFM, LFM, FMOS, and TFM).
On average between the two crop years, the root dry mass (RDM), stem dry mass (SDM), leaf dry mass (LDM), dry mass of shoots (DMOS),
and total dry mass (TDM) accounted for 31.83% of RFM, 29.87% of SFM, 27.21% of LFM, 29.13% of FMOS, and 29.51% of TFM, respectively. Studies by
SUZUKI & ALVES (2006) and FINHOLDT et al.
(2009) found pigeon pea dry masses of 19.8% and 16.8% of the fresh masses, respectively. Conversely,
CAVALCANTE et al. (2012) found percentages
closer to those obtained in this study, that is, 26.0% for dwarf pigeon pea and 29.5% for forage pigeon
pea. These dry mass percentages convey the important contributions of this culture as a cover crop.
In the 2011/2012 and 2012/2013 crop years, the traits related to the fresh mass (RFM, SFM, LFM, FMOS, and TFM) had standard deviations that varied between 41.28
and 288.26g∙plant-1, standard errors that varied
between 2.18 and 15.19g∙plant-1, and coefficients of variation (CVs) that varied between 55.36 and 83.18%
(Table 1). For the dry mass traits (RDM, SDM, LDM, DMOS, and TDM), the standard deviations varied
between 13.58 and 88.85g∙plant-1, the standard
errors varied between 0.72 and 4.68g∙plant-1, and the CVs between 56.58 and 84.53%. In general,
among the traits in each crop year, higher CVs were obtained for the RFM and RDM than for the
other traits. This difference was more significant in the 2012/2013 crop year, with a CV of 83.18% for RFM and 84.53% for RDM, while the CVs of the other eight traits varied between 69.47% and 73.03% (Table 1). In the second crop year
(row seeding, and evaluation at 162DAS), the productive traits of the fresh and dry pigeon pea masses exhibited higher variability (mean CV of
the 10 traits = 73.77%) than in the first crop year
(broadcast seeding and evaluation at 125DAS; mean
CV of the 10 traits = 58.73%). This suggests that
to estimate the averages of the productive traits of pigeon pea with the same precision, the sample size needs to be different between traits and between
traits with a similar magnitude were also obtained in the sample size studies with cover crops such
as white lupine (47.58≤CV≤57.58%) (BURIN et al., 2014), forage turnip (62.47≤CV≤77.07%)
(CARGNELUTTI FILHO et al., 2014), and black
oat (31.58≤CV≤67.96%) (CARGNELUTTI FILHO
et al., 2015).
For 10 traits, in both crop years, the high mean scores in relation to the median, the positive and non-zero estimates of asymmetry, and kurtosis
values other than 3, as well as the significance of the Kolmogorov-Smirnov test (P≤0.05), indicate that the data do not fit the normal distribution. According to the randomness test (run test), in 70% of the
cases (10 traits × 2 crop years) the distribution was random (P>0.05) (Table 1). Although the assumption
of normality was not satisfied, the large number
of sampled plants (360 plants in each crop years)
and the high percentage of cases with randomness associated with the broad variability between agricultural traits and crop years, gives credibility to the use of this database for the sample size study (SIEGEL & CASTELLAN JR, 2006; BUSSAB & MORENTTIN, 2011).
The sample size, in number of plants, for estimating the average of the 10 productive traits in both crop years, with an estimation error equal
to 2% from the estimated average (x) and a 95%
confidence level, varied between 2,963 plants for LFM (first crop year) and 6,909 plants for RDM
(second crop year) (Table 2). In general, in each crop year, larger sample sizes were needed for RFM and RDM than for the other traits (Table 2). In the second crop year, the sample sizes needed for estimating the average of the productive traits of pigeon pea fresh
and dry masses were higher than in the first crop year. Table 1 - Minimum (min), maximum (max), mean, median (med), standard deviation (s), standard error (se), coefficient of variation (CV, in
%), asymmetry (A), kurtosis (K), Kolmogorov-Smirnov normality value test (KS), and p-value of the run test (RT, a randomness
test) for root fresh mass (RFM), stem fresh mass (SFM), leaf fresh mass (LFM), fresh mass of shoots (FMOS), total fresh mass (TFM), root dry mass (RDM), stem dry mass (SDM), leaf dry mass (LDM), dry mass of shoots (DMOS), and total dry mass (TDM), in g·plant-1, of 360 pigeon pea (Cajanus cajan L.) plants evaluated at 125 days after sowing in the 2011/2012 crop year, and of 360 plants evaluated at 162 days after sowing in the 2012/2013 crop year.
Trait min max mean med(1) s se CV (%) A(2) K(3) KS(4) RT(5)
---Crop year
2011/2012---RFM 9.00 237.00 72.53 a 65.00 45.21 2.38 62.34 1.01* 3.90* 1.70* 0.01
SFM 33.00 746.00 235.27 b 206.50 139.04 7.33 59.10 1.09* 4.22* 1.73* 0.02
LFM 14.00 414.00 130.71 a 119.00 72.35 3.81 55.36 1.14* 4.50* 1.92* 0.00
FMOS 47.00 1,128.00 365.98 a 325.00 209.86 11.06 57.34 1.10* 4.27* 1.58* 0.03
TFM 59.00 1,330.00 438.51 a 390.50 253.26 13.35 57.75 1.07* 4.18* 1.53* 0.07
RDM 3.00 75.00 22.70 a 20.50 14.00 0.74 61.69 1.00* 3.83* 1.81* 0.01
SDM 9.00 227.00 68.13 b 58.00 40.95 2.16 60.11 1.13* 4.39* 2.15* 0.07
LDM 4.00 119.00 36.67 a 34.00 20.75 1.09 56.58 1.14* 4.58* 1.87* 0.01
DMOS 13.00 335.00 104.80 a 91.00 61.25 3.23 58.45 1.12* 4.38* 1.87* 0.07
TDM 17.00 400.00 127.50 a 111.00 74.68 3.94 58.57 1.08* 4.23* 1.77* 0.25
---Crop year
2012/2013---RFM 3.00 246.00 49.63 b 36.00 41.28 2.18 83.18 1.65* 6.70* 2.52* 0.16
SFM 6.00 952.00 266.51 a 219.00 187.73 9.89 70.44 1.02* 3.83* 2.13* 0.60
LFM 3.00 377.00 94.02 b 83.00 66.11 3.48 70.31 1.13* 4.87* 1.84* 0.46
FMOS 10.00 1,315.00 360.53 a 311.00 250.47 13.20 69.47 1.03* 4.02* 2.03* 0.75
TFM 13.00 1,525.00 410.16 a 350.50 288.26 15.19 70.28 1.07* 4.18* 1.88* 0.46
RDM 1.00 80.00 16.06 b 12.00 13.58 0.72 84.53 1.57* 6.13* 2.85* 0.46
SDM 2.00 305.00 82.02 a 66.50 59.62 3.14 72.69 1.09* 4.04* 2.10* 0.75
LDM 1.00 100.00 24.78 b 22.00 18.09 0.95 73.03 1.22* 5.19* 1.84* 0.75
DMOS 3.00 402.00 106.79 a 92.00 76.31 4.02 71.45 1.09* 4.23* 1.95* 0.46
TDM 4.00 467.00 122.85 a 106.00 88.85 4.68 72.33 1.12* 4.32* 1.85* 0.46
(1)
For each trait (RFM, SFM, LFM, FMOS, TFM, RDM, SDM, LDM, DMOS, and TDM) averages not followed by the same letter in the
column (mean comparison between crop years) are different at a 5% level of probability by the Student’s t-test for independent samples, with
718 degrees of freedom. (2)*Non-zero asymmetry, by t-test, at a 5% level of probability. (3)*Kurtosis other than three, by t-test, at a 5% level of
probability. (4)*Significant at 5% probability (normal distribution). (5)P-value = 0.05 (non-random data series) and P-value > 0.05 (random
data series).
Thus, it can be inferred that, in order to estimate the average of the productive traits of pigeon pea with the same precision, different sample sizes are required for different traits and crop years.
Sample size variability between seed, seedling, and adult plants for castor bean production traits was observed by CARGNELUTTI FILHO et al. (2010). In addition, sample size variability between
Figure 1 - Minimum, maximum, and average daily air temperatures, in °C, and rainfall, in mm, for the 2011/2012 crop year (A) and the 2012/2013 crop year (B) during which experiments were carried out with pigeon pea (Cajanus cajan L.). Data were
morphological and productive traits was observed in cover crops, such as white lupine (BURIN et al., 2014), forage turnip (CARGNELUTTI FILHO et al., 2014), and black oat (CARGNELUTTI FILHO et al., 2015). Additionally, sample size variability between evaluation periods was observed for the black oat (CARGNELUTTI FILHO et al., 2015).
In practice, estimating the average of these productive traits of pigeon pea with high precision,
i.e., with a 2% maximum estimation error, requires
an unfeasibly large number of plants (6,909 plants, Table 2). Alternatively, smaller sample sizes may be used, but these are associated with higher estimation errors, so the estimate of the average will have lower
precision. With a 2% decrease in precision, that is, with an estimation error of 4%, there is a 75%
reduction in the sample size for all traits in both
crop years. For the semi-amplitude of the confidence interval equal to 20% of the average (lower precision,
in this study), at least 70 plants are required for the productive traits of fresh and dry mass for both crop years (Table 2). In practice, in sample survey studies, these 70 plants would be taken at random from the experimental area. In an experimental design with,
for instance, five replicates per treatment, 14 plants
per repetition would be sampled.
Researchers can use the data obtained from this study for the planning of appropriate samples for pigeon pea research. The traits being evaluated, the desired precision, the availability of personnel,
financial resources, and time are important aspects to
be considered in the experimental design. In addition to the approach suggested by this study, one can, if needed, estimate the sample size for other estimation errors.
CONCLUSION
The necessary sample size varies with the productive traits being assessed and the crop years of the pigeon pea. To estimate the averages of the
productive traits with a 20% maximum estimation error and 95% confidence level, 70 plants are sufficient.
ACKNOWLEDGEMENTS
To the Conselho Nacional de Desenvolvimento
Científico e Tecnológico (CNPq) and the Coordenação de
Aperfeiçoamento de Pessoal de Nível Superior (CAPES), for granting
Table 2 - Necessary sample size, in number of plants, for estimating the average of root fresh mass, (RFM), stem fresh mass (SFM), leaf fresh mass (LFM), fresh mass of shoots (FMOS), total fresh mass (TFM), root dry mass (RDM), stem dry mass (SDM), leaf dry
mass (LDM), dry mass of shoots (DMOS), and total dry mass (TDM). Estimation errors were of 2%, 4%, 6%, 8%, 10%, 12%, 14%, 16%, 18%, and 20% of the average for each trait, based on the 360 pigeon pea (Cajanus cajan L.) plants evaluated in each crop year.
Trait 2% 4% 6% 8% 10% 12% 14% 16% 18% 20% Error (%)
---Crop year
2011/2012---RFM 3,758 940 418 235 151 105 77 59 47 38 6.46
SFM 3,377 845 376 212 136 94 69 53 42 34 6.13
LFM 2,963 741 330 186 119 83 61 47 37 30 5.74
FMOS 3,180 795 354 199 128 89 65 50 40 32 5.94
TFM 3,226 807 359 202 130 90 66 51 40 33 5.99
RDM 3,680 920 409 230 148 103 76 58 46 37 6.39
SDM 3,494 874 389 219 140 98 72 55 44 35 6.23
LDM 3,096 774 344 194 124 86 64 49 39 31 5.86
DMOS 3,303 826 367 207 133 92 68 52 41 34 6.06
TDM 3,318 830 369 208 133 93 68 52 41 34 6.07
---Crop year
2012/2013---RFM 6,691 1,673 744 419 268 186 137 105 83 67 8.62
SFM 4,798 1,200 534 300 192 134 98 75 60 48 7.30
LFM 4,781 1,196 532 299 192 133 98 75 60 48 7.29
FMOS 4,667 1,167 519 292 187 130 96 73 58 47 7.20
TFM 4,776 1,194 531 299 192 133 98 75 59 48 7.28
RDM 6,909 1,728 768 432 277 192 141 108 86 70 8.76
SDM 5,110 1,278 568 320 205 142 105 80 64 52 7.53
LDM 5,157 1,290 573 323 207 144 106 81 64 52 7.57
DMOS 4,937 1,235 549 309 198 138 101 78 61 50 7.41
scholarships to the authors. To the Fundação de Amparo à Pesquisa do
Estado do Rio Grande do Sul (FAPERGS), for the financial support.
REFERENCES
ALENCAR, D.P. et al. Raw pigeon pea in the diet of free-range broilers reared in a semi-intensive system. Pesquisa Agropecuária Brasileira, v.49, p.737-744, 2014. Available from: <http://www.scielo.br/pdf/pab/v49n9/0100-204X-pab-49-09-00737.pdf>. Accessed: Jun. 11, 2015. doi: 10.1590/ S0100-204X2014000900010.
BURIN, C. et al. Sample size for estimating the average and median character of white lupine (Lupinus albus L.). Comunicata Scientiae, v.5, p.205-212, 2014. Available from: <http:// comunicatascientiae.com.br/comunicata/article/view/317/246>. Accessed: Jun. 11, 2015.
BUSSAB, W.O.; MORETTIN, P.A. Estatística básica. 7. ed. São Paulo: Saraiva, 2011. 540p.
CARGNELUTTI FILHO, A. et al. Sample size to evaluate morphological and productive characters in black oat in evaluation times. Ciência Rural, v.45, p.9-13, 2015. Available from: <http://www.scielo.br/scielo.php?script=sci_arttext&pid =S0103-84782015000100009>. Accessed: Jun. 11, 2015. doi: 10.1590/0103-8478cr20140504.
CARGNELUTTI FILHO, A. et al. Sample size of the characters in castor bean. Ciência Rural, v.40, p.250-257, 2010. Available from: <http://www.scielo.br/scielo.php?script=sci_arttext&pid=S0103-84782010000200005&lng=pt&nrm=iso&tlng=pt>. Accessed: Jun. 11, 2015. doi: 10.1590/S0103-84782010000200005.
CARGNELUTTI FILHO, A. et al. Sample size to estimate the average of morphological and productive traits of turnip. Ciência Rural, v.44, p.223-227, 2014. Available from: <http://www.scielo.br/scielo.php?script=sci_arttext&pid =S0103-84782014000200005>. Accessed: Jun. 11, 2015. doi: 10.1590/S0103-84782014000200005.
CAVALCANTE, V.S. et al. Biomass production and nutrient removal by plant cover. Revista Brasileira de Engenharia Agrícola e Ambiental, v.16, p.521-528, 2012. Available from: <http://www. scielo.br/pdf/rbeaa/v16n5/v16n05a08.pdf>. Accessed: Jun. 11, 2015. doi: 10.1590/S1415-43662012000500008.
CRUZ, C.D. GENES - a software package for analysis in experimental statistics and quantitative genetics. Acta Scientiarum Agronomy, v.35, p.271-276, 2013. Available from: <http://periodicos.uem.br/ojs/index.php/ActaSciAgron/article/ view/21251/pdf>. Accessed: Jun. 11, 2015.
FINHOLDT, R.S. et al. Green fertilizers potential of production: biomass and soil cover. FAZU em Revista, n.6, p.11-14, 2009. Available from: <http://www.fazu.br/ojs/index.php/fazuemrevista/ article/view/36/30>. Accessed: Jun. 11, 2015.
HELDWEIN, A.B. et al. O clima de Santa Maria. Ciência & Ambiente, v.38, p.43-58, 2009.
RAYOL, B.P.; ALVINO-RAYOL, F.O. Use of pigeon pea (Cajanus cajan (L.) Millsp.) as green manure in the integrated weed management in reforestation in Pará State. Revista Brasileira de Agroecologia, v.7, p.104-110, 2012. Available from: <http:// orgprints.org/22977/1/Rayol_Uso.pdf>. Accessed: Jun. 11, 2015.
SANTOS, H.G. et al. Sistema brasileiro de classificação de solos. 2.ed. Rio de Janeiro: Embrapa Solos, 2006. 306p.
SIEGEL, S.; CASTELLAN JÚNIOR, N.J. Estatística não-paramétrica para ciências do comportamento. 2.ed. Porto Alegre: Artmed, 2006. 448p.
STORCK, L. et al. Experimentação vegetal. 3.ed. Santa Maria: UFSM, 2011. 200p.