Analysis of coastal lagoon metabolism as a basis for management
P. Duarte
1, J.M. Bernardo
2, A.M. Costa
2, F. Macedo
3, G. Calado
4and L. Cancela da Fonseca
5 1Universidade Fernando Pessoa, Praça 9 de Abril, 349, 4249-004 Porto, Portugal (E-mail: [email protected].); 2Universidade de ´Evora, Departamento de Ecologia, 7000, ´Evora, Portugal; 3Universidade Nova de Lisboa,Faculdade de Ciências e Tecnologia, Quinta da Torre, 2825 Monte de Caparica, Portugal;4Instituto Português de Malacologia. Apart. 52, S.Pedro do Estoril, 2925, Estoril, Portugal;5IMAR, UCTRA, Gambelas, 8000 Faro, Portugal
Accepted 18 July 2001
Key words:mesocsom, microcosm, modelling, primary productivity
Abstract
This work was carried out in a shallow eutrophic coastal lagoon (St. André lagoon, SW Portugal) which is artifi-cially opened to the sea each year in early spring. Macrophytes, mainlyRuppia cirrhosa, are keystone species in this ecosystem covering up to 60% of its total area with peak biomasses over 500 g DW m−2. The main objectives
were to study ecosystem metabolism, to evaluate the metabolic contribution to the community of the macrophyte stands and their influence in the development of thermal stratification and bottom oxygen depletion.
The work combined an experimental and a modelling methodology. The experimental approach included open water, mesocosm and microcosm seasonal experiments. During these experiments several physical, chemical and biological parameters were monitored in the lagoon and in plastic enclosures (mesocosms) for periods of 24 hours. The microcosm experiments followed the light-dark bottle technique. The simultaneous use of these different methodologies allowed the analysis of the contribution of the planktonic and benthic compartments to the ecosystem’s oxygen budget.
The modelling work was based on the mathematical simulation of heat and gas exchanges in a vertically resolved water column, under different macrophyte densities. Several simulations were carried out, in order to investigate the importance of the macrophytes in the development of water column stratification and anoxia.
The simulation results suggest that macrophytes may greatly influence thermocline and oxycline development. This influence is proportional to their biomass and canopy height. It is suggested that controlled macrophyte biomass removal of up to 25% of available biomass in summer, may be useful in preventing bottom anoxia without compromising benthic net primary production.
Introduction and objectives
The metabolism of coastal lagoons is strongly influ-enced by freshwater inputs and the exchange processes with the adjacent sea (Barnes, 1980; Postma, 1981). Most lagoons located in the Portuguese West Coast are usually separated from the sea by a sand barrier. Natural opening processes are irregular and strictly dependent on the rainfall (Heydorn & Tinley, 1980; Hervé & Bruslé, 1981). In very rainy winters the high water level of the lagoons may cause discharges to the sea, opening a channel through the sand barrier
(Cancela da Fonseca, 1989). Usually the lagoon-sea exchange depends on a man-made channel for a period lasting from days to several weeks. The opening of these channels may prevent eutrophication and anoxia development, through the wash-out of organic matter and nutrients from the lagoons to the sea. Then, the un-interrupted sand barrier re-establishes and the lagoons return to their isolated condition.
in each tidal cycle. The efficiency of this washing-out process apparently depends on the lagoon water level before the opening process and on the local sea conditions. The macrophyte biomass decreases due to salinity shock and air exposure during low tide. Moreover, the brackish conditions of the lagoon are maintained.
The utmost importance of the lagoon-sea connec-tion is related to the fact that many of these lagoons are dystrophic, i.e. eutrophic and thus subject to summer critical events involving intense nutrient releases from the sediment and faunal mortalities (Bamber et al., 1992).
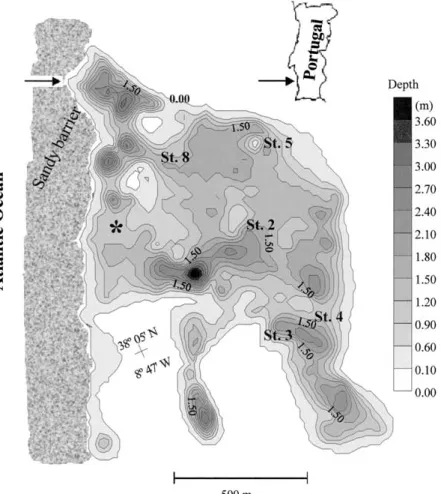
St. André lagoon (Figure 1) (SW Portugal) is a land-locked coastal lagoon with a temporary connec-tion to the sea. Usually in late March, when the lagoon water level is highest, a channel through the sand barrier is artificially opened, promoting water exchange with the sea. The juveniles of several ma-rine species (e.g., Anguilla anguilla, Dicentrarchus labrax, Sparus aurata, Mugilsp.) enter into the lagoon during the short opening period (1–2 weeks). Annu-ally, by 10–100 tons of these species (mainlyAnguilla anguilla) are harvested. The lagoon is also used for recreational activities as beach visiting and bathing. The low average depth and the high water residence time are responsible for a strong macrophyte develop-ment dominated byRuppia cirrhosa(Petagna) Grande andPotamogeton pectinatusL., and a high sediment organic content. Large accumulations of these plants and organic matter often cause ‘dystrophic crises’, especially during summers, when massive mortality among benthos and fish may occur (Bernardo, 1990). These events usually occur in years with weak con-nection to the sea and following several days of high temperatures and no wind.
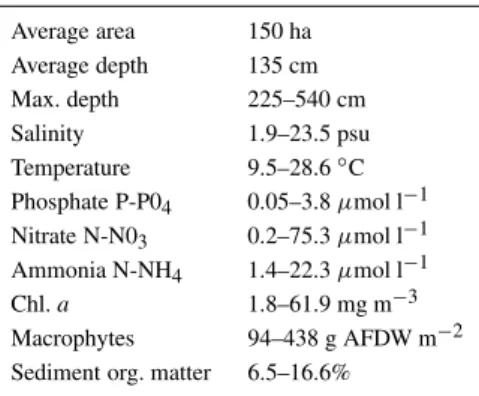
High nutrient levels and shallow depth provide ideal conditions for high rates of primary produc-tion. In Table 1 the ranges of some physico-chemical and biological parameters of St. André lagoon are summarised.
During summer, under high temperature condi-tions due to shallow depth and isolation from the sea, the macrophyte biomass and the organic rich muds support intense respiration, and consequently anoxic conditions may occur. The high macrophyte biomass also restricts vertical mixing of the water column, further contributing to anoxic conditions.
In winter, episodic inputs of seawater overwash-ing the sand barrier create density stratification in the deeper zones of the lagoon. Bottom waters
of-Table 1. Main characteristics of St. Andr´e lagoon (data from Bernardo, 1990)
Average area 150 ha Average depth 135 cm Max. depth 225–540 cm Salinity 1.9–23.5 psu Temperature 9.5–28.6◦C Phosphate P-P04 0.05–3.8µmol l−1 Nitrate N-N03 0.2–75.3µmol l−1 Ammonia N-NH4 1.4–22.3µmol l−1 Chl.a 1.8–61.9 mg m−3 Macrophytes 94–438 g AFDW m−2 Sediment org. matter 6.5–16.6%
ten become anoxic. Similarly, watershed inputs of freshwater during storms may also cause stratification (Cancela da Fonseca et al., 1989).
Photosynthetic organisms may intercept as much as 50% of incident light (Odum, 1971), thus blocking radiant energy transfer to depth. This bottom shading effect has been demonstrated in marine ecosystems by several authors (e.g., Taylor, 1993). It seems rea-sonable to expect that high-density stands of benthic macrophytes may produce a similar effect in shallow water ecosystems, such as the St. André lagoon, due to the shadowing of their leaves on the underlying water. Eutrophication could possibly be reduced by har-vesting macrophytes, therefore removing important quantities of nutrients and organic matter. This “clean-ing” of the lagoon could contribute to its sustainable management, improving fish production and recre-ational usage. Macrophyte harvest for fertiliser has been a traditional activity in Portugal since at least the Middle Ages (Veiga de Oliveira et al., 1975). It is well established that macrophyte harvesting may prevent eutrophication phenomena in semi-enclosed water bodies (Thornton et al., 1995). It is also im-portant to know the influence of this activity on water column stratification and bottom anoxia.
Figure 1. St. Andr´e Lagoon average depths reported to the lagoon margins (0.00), that are approximately 1.5 m above sea level. The arrow on the upper left corner shows the place where the Lagoon is artificially opened to the sea every Spring. The asterisk shows the place where the mesocosm experiments were carried out (see text).
The objective of this work in the St. André lagoon is to answer the following questions:
(1) What is the relative contribution of the dif-ferent autotrophic compartments in the community metabolism?
(2) What are the time-scales for the development of thermal stratification?
(3) What is the influence of the macrophytes in the development of water column thermal stratification and bottom anoxia?
Materials and methods
Several experimental and modelling approaches were used. Mesocosm and microcosm experiments were carried outin situ. Also six sampling campaigns were carried out in Santo André lagoon covering all sea-sons - July 1996, December 1996, September 1997,
December 1997, March 1998 and June 1998. The ex-perimental results obtained from the mesocosm and the microcosm experiments were used to compute la-goon metabolism in terms of oxygen production and consumption.
Mesocosm experiments
inside the mesocosm walls to reinforce the whole structure. The diameter of the mesocosms was 45 cm. Their height depended on the depth of the lagoon at the place where the experiments took place (Figure 1) and varied from ca. 50 to 100 cm, corresponding to a volume of 79 to 159 dm3. Three replicates were used in all mesocosm experiments.
After placing the mesocosms in the lagoon near the sandy barrier (Figure 1), sampling for dissolved oxygen (D.O.) was carried out every 3 hours for a 24-hour period, in the lagoon and in the mesocosms. Simultaneously, sensors were used to measure under-water light intensity just below the surface and above the bottom (Quantum sensor LI-COR mod. 193AS), pH (pH meter ESD, Engineered Systems & Designs, model 69), temperature and salinity (S-C-T meter YSI model 33). Dissolved oxygen samples were chemi-cally fixed in situ and analysed in the laboratory by the Winkler method (A.P.H.A., 1992). Each meso-cosm was sampled nine times per sampling campaign, for all the parameters described above, except in the first campaign, in July 1996, when eight samples were taken. At the end of each campaign the mesocosms were removed.
At the end of the experiments water samples were collected for pigment analysis. These were analysed by fluorimetry according to Strickland & Parsons (1968). Sediment samples for macrophyte biomass were also collected from inside the area previously covered by the BP-mesocosms, using a 16 cm diam-eter cylindrical sampler “core” (Menéndez & Comín, 1989). Plants and sediment were sorted from the core through a 5 mm mesh bag and sieved in the water. Samples were transported to the laboratory and frozen (−18◦C) until subsequent analysis. Plant material was then separated, dried at 105◦C for about 24 hours and finally weighed.
Oxygen budget calculations
The diurnal oxygen curves obtained for each meso-cosm and for the lagoon were used to calculate oxy-gen diffusion across the surface (D), net primary production (NPP), respiration (R) and gross primary production (GPP). Equation (1) describes the D.O. depth integrated mass balance. In the mesocosms the horizontal diffusion and advection terms are zero.
dC
dt = GP P −R+kair−water
C
s−Co
Cs
+k∂Cw
∂x + k
∂Cw ∂y +A,
(1)
where,Cs andCoare saturation and depth integrated oxygen concentrations (g O2m−2) in the time interval
δt; GPP, gross primary production (g O2 m−2 h−1);
R, respiration (g O2m−2h−1);Kair−water, gas-transfer
coefficient (g O2m−2h−1);∂Cx/∂xand∂Cx/∂y, hor-izontal D.O. concentration gradients (g O2m−3m−1);
k, horizontal eddy diffusion (m−2h−1);A, net oxygen advection (g O2m−2h−1).
Overnight oxygen dynamics in the mesocosm at two different time intervals (1 and 2) is described by (2) and (3):
dC1
dt1
= −R+kair−water
C
sl−Col Csl
, (2)
dC2
dt2
= −R+kair−water
C
s2−Co2
Cs2
. (3)
Assuming that community respiration and the gas transfer coefficient are constant over the experimental period, both may be estimated from Equations (2) and (3) (Odum, 1956). Hereafter this will be referred to as Method 1.
Another approach used was to measure planktonic respiration rate (R) in microcosms isolated from the atmosphere (see below), and then solve Equations (2) and (3) for k, from the night D.O. variations in the P-mesocosms. This will be referred to as Method 2. Eight diffusion and eight NPP values were obtained for each mesocosm (seven in the July 1996 campaign) and for the lagoon.
There are several methods for the estimation of the oxygen gas transfer coefficients. These were described and compared by Kosinski (1984). The methods used in our work, however, were chosen because more sophisticated formulations based on night-time regres-sions or on quasi-continuous oxygen measurements are very demanding in terms of data points. In the present study, dissolved oxygen was measured by Winkler titration and therefore it was not possible to collect a very large number of samples without reduc-ing significantly the mesocosms volume. In fact, the experiments were designed to favour replication, mea-surement accuracy and precision in stead of sampling frequency.
Data analysis
Figure 2. Schematic drawing of Bentho-pelagic (BP) and pelagic (P) mesocosms. The former are partially buried into the sediments. Meso-cosms were fixed to the bottom with stakes and their walls reinforced with a plastic net. Their height depended on water depth and varied from ca. 50 to 100 cm.
and their interactions on dissolved oxygen saturation concentration. The post-hoc Newman–Keuls test and the Kruskal–Wallis test were used to contrast different campaigns or treatments.
The data from the lagoon was not included in the statistical tests because there was no replication in it. In spite of the fact that samples from the lagoon were taken in triplicate they were merely subsamples, since they were collected in the same area. Due to logistic constraints it was not possible to sample more stations during the experiments.
Microcosm experiments
Microcosm experiments were carried out in order to measure planktonic and benthic respiration and pho-tosynthesis by the light-dark bottle technique (Vollen-weider, 1974). Winkler flasks were used for water col-umn measurements whereas benthic chambers were used in the sediments.
Water column measurements
During all sampling campaigns the oxygen method was used to measure respiration in dark bottles. In the first two campaigns it was also used to measure photosynthesis in transparent bottles. However, since September 1997, photosynthetic rates were measured
by standard14C techniques (Steemann Nielsen 1962) following the ICES (1996) recommendations. Water samples were placed in 60 ml Winkler bottles and in-oculated with 1 ml of NaH14CO3with 10µCi sodium
(Carbon 14 Centralen). A dark bottle was used for the blank determination. Upon removal, samples were filtered through 0.45µm pore membrane filters. Fil-ters were acidified with HCl and placed in vials with 10 ml scintillation fluid (Insta-Gel Plus, Packard). Ra-dioactivity was then counted in a liquid scintillation analyser (Tri-Carb Model 1600CA). Primary produc-tion (mg C m−3h−1) was calculated following ICES
(1996) and then divided by the phytoplankton bio-mass to calculate the primary production rate (mg C mg Chl a−1 h−1). Values obtained were converted into oxygen units assuming a photosynthetic quotient (P.Q.) of 1.00. Respiration incubations were carried out for up to 5 hours, whereas incubations for the mea-surement of productivity were carried out for periods of 2.5 hours.
time-series of light intensities fitted to the measured values (with a 3-hour interval):
I0=Imaxsin ((Hour−
(SolarNoon−Photoperiod/2))/(Photoperiod/2)), (4)
whereI0, surface light intensity inµE m−2s−1;Imax,
light intensity at solar noon inµE m−2s−1.
The photoperiod and the solar noon were calcu-lated from standard formulations described in Brock (1981). Imax was obtained from the light intensity
measurements carried out during the experiments to adjust equation 4 to the observed data. Productivity was calculated from light intensity (equation 4) by a depth integrated Michaelis–Menten equation:
P =B
0
z Pmax
z
I0e−kz
Ik+I0e−kz
∂z
=BPmax kz ln
|Ik+I0| |Ik+I0e−kz|
,
(5)
whereP, gross productivity (mg C m−3h−1);B, Phy-toplankton biomass (mg C m−3); k, light extinction coefficient (m−1);z, depth (m).
The value forPmaxwas based on the results of the
in situ incubations. It was assumed that the produc-tivity value measured under full sunlight was a good estimate ofPmax. TheIk value was based on labora-tory incubations under controlled light intensities and temperatures. These results were be discussed else-where (Macedo et al., 2001). The hourly productivities calculated from equation 5 were integrated over a day and reported to m2. Carbon units were converted to oxygen units assuming a P.Q. of 1.00. The choice of a saturation model for the calculation of productivity, rather than an inhibition model was justified based on laboratory results, from which there was no evidence of light inhibition in phytoplankton samples from St. André lagoon (Macedo et al., 2001).
Benthic chambers
Benthic chambers were 4 l plastic jars with an opened bottom. The area covered by the jars was 0.02 m2. A plastic tube was attached to the upper end and the wa-ter samples were extracted from the chamber through this tube using a hand pump. Triplicate samples for D.O. were taken at the beginning of the experiments. The lower part of the chambers was buried 5 cm into the sediment. Each incubation lasted 3 hours. Three dark and three transparent chambers were used. Res-piration and net production of oxygen were calculated
from the dissolved oxygen changes observed in the dark and in the transparent jars, respectively.
Ruppia cirrhosacontribution to the community metabolism
The contribution of the keystone speciesR. cirrhosa
to the community metabolism was calculated similarly to what was described for phytoplankton.R. cirrhosa
is considered a keystone species because it strongly determines the community structure in the lagoon (cf., Krebs, 1994). Equations (4) and (5) were employed with parameters derived from Menéndez & Peñuelas (1993), Calado (1997) and Calado & Duarte (2000). According to these authorsPmaxandIkvalues for this species may range from 5.50 to 21.04 mg O2g−1h−1
and 13.20 to 58.36 µE m−2 s−1, respectively. In the present case, the median value of each interval was chosen for the calculations. A similar approach was followed for respiration that ranges from 0.56 to 4.80 mg O2g−1h−1(Menéndez & Peñuelas, 1993).
Modelling
Modelling was used to evaluate the potential contribu-tion of the macrophyte biomass to thermal stratifica-tion and anoxia development. A vertically resolved hy-drodynamic model was used to simulate water column stratification. The model was described by (Price & Weller, 1986) and applied by Janowitz & Kamykowski (1991) to Lake Titicaca and by Duarte & Ferreira (1997) to simulate oceanic stratification. It is a one-dimensional vertical exchange model, forced by wind stress at the surface, by solar and long wave radiation and by sensible and latent heat transfer across the sur-face. Estimation of light intensity and radiation fluxes between the water and the atmosphere – atmospheric long-wave radiation, water leaving radiation, latent and sensible heat transfers - and their influence on water temperature, were based on standard formula-tions described in Brock (1981) and Portela & Neves (1994). The calculated photosynthetically active radi-ation (PAR) was used to compute photosynthesis. The number of vertical layers is variable; in the present case 12 layers of 10 cm were used. The model has three phases:
variable, it is not considered in the density determina-tion because the vertical density structure of the water column is considered to be temperature dependent.
(ii) A convective mixing phase, which looks for vertical instability in the water column. This stage uses a stepwise approach, examining adjacent water layers for densimetric instability, and re-initialising all the layers above with the average values for the horizon-tal velocity components, temperature, salinity and any other dissolved or particulate properties.
(iii) A dynamic mixing phase, which is respon-sible for turbulent mixing between layers, based on the shear stress at the interface. This is calculated by means of the Richardson number obtained for each layer. The Richardson number is a nondimensional ra-tio of the density gradient to the velocity shear and is a measure of the vertical mixing in a fluid (Knauss, 1997).
Model simulations were carried out for periods of over 5 days with a time step of 0.1 hours under summer solar heating, with an average air tempera-ture of 25◦C and with no wind, as to simulate the most likely conditions for the occurrence of stratifi-cation. These conditions are frequent in SW Portugal during summer. Therefore, the water was still and dynamic mixing did not occur. Considering that mole-cular diffusivity of heat is 1.5×10⁻⁷m2s−1it may be estimated that the time it would take for heat to be transferred over a distance of 10 cm – the spatial scale of the model – is about 18.5 hours (less then the time scale of the model runs). Therefore, molecular diffusion of heat became significant in the present case and was also included in the model.
Model simulations were carried out in order to quantify the time needed for stratification to develop, under the conditions described in the previous para-graph and in the presence of different macrophyte biomasses. The effect of the macrophyte canopy was taken into account by imposing different extinction coefficients over depth, as a function of macrophyte density and canopy height. The extinction coeffi-cient influences light penetration and therefore water heating processes (model phase (i)).
The effect of the macrophyte canopy on light pen-etration was previously studied by Calado (1997). The light extinction coefficient in the lagoon has val-ues around 1–2 m−1. However, under a macrophyte
canopy with a biomass of 400 g DW m−2it may reach
10 m−1. In the model simulations carried out in the
present work, a value of 1.6 m−1was used for the light extinction coefficient, in the absence of macrophytes,
based on historical data (Bernardo, 1990). The model computed the extinction coefficient for each layer, us-ing the mentioned value in the absence of macrophytes or a canopy value calculated from Calado (1997):
kcanopy=
Biomass
227.3+Biomass16.3, (6)
Wherekcanopyis the canopy light extinction coefficient
(m−1) and biomass is in g DW m−2. Equation (6) predicts a linear increase inkcanopywith biomass until
an asymptotic value of 10 m−1. Whenever the top of
the canopy was between the top and the bottom of a layer, light intensity was calculated using the water extinction coefficient from the top of the layer until the top of the canopy, and using the canopy extinction coefficient from the top of the canopy until the bottom of the layer.
Regarding the influence of the macrophytes on the oxygen dynamics, the approach used was the same as described above for the estimation of the role ofR. cirrhosaon the oxygen budget. The oxy-gen produced/consumed by the macrophytes at every time-step was added/removed from all the vertical layers occupied by the canopy. The oxygen concentra-tions in each layer were also exchanged by convective mixing and in the upper layer, by diffusion to/from the atmosphere. Different macrophyte biomasses and canopy heights were tested to evaluate their effects on temperature and oxygen vertical dynamics. The general equations describing the oxygen budget in the model are:
dC0
dt = GP0−R0+kgas
Cs−Co Cs
±Convection,
(7)
dCi
dt =GPi−Ri±Convection, (8)
whereGPi, gross production of oxygen in layeri;Ri, consumption of oxygen in layeri;Kgas,Cs andC0as
in Equation (1).
The first equation (Equation 7) applies to the upper water layer and it includes a term to represent diffusion with the atmosphere. For the gas transfer coefficient a value of 0.4 g O2m−2h−1was chosen, according to
the value calculated in the present work for a summer situation in September 1997 (Table 3). There was no need to include a term for molecular diffusion between the different layers since its value for oxygen in water ranges from 1.2 to 2.3×10⁻⁹m2s−1(Libes, 1992),
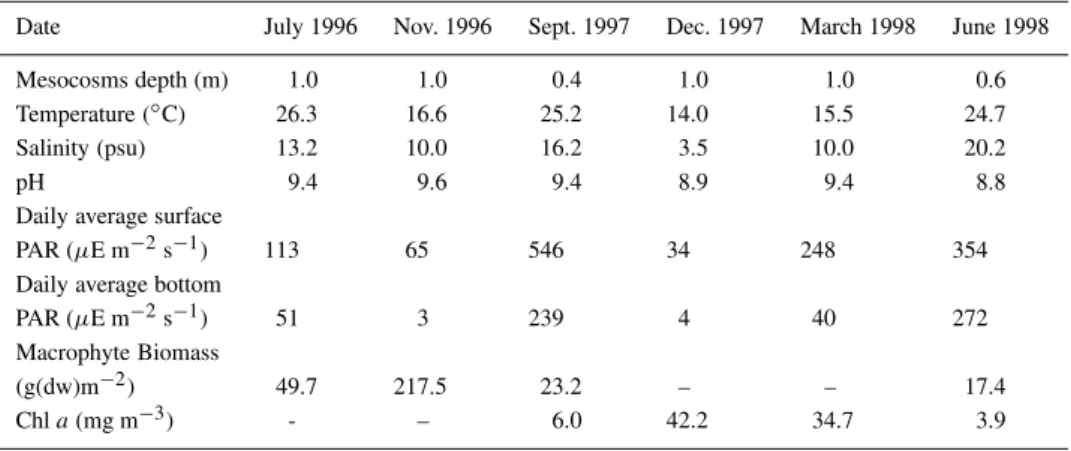
Table 2. Mean values for the reference parameters measured in St. Andr´e Lagoon during the mesocosm experiments (PAR – Photosynthetically Active Radiation)
Date July 1996 Nov. 1996 Sept. 1997 Dec. 1997 March 1998 June 1998
Mesocosms depth (m) 1.0 1.0 0.4 1.0 1.0 0.6
Temperature (◦C) 26.3 16.6 25.2 14.0 15.5 24.7
Salinity (psu) 13.2 10.0 16.2 3.5 10.0 20.2
pH 9.4 9.6 9.4 8.9 9.4 8.8
Daily average surface
PAR (µE m−2s−1) 113 65 546 34 248 354
Daily average bottom
PAR (µE m−2s−1) 51 3 239 4 40 272
Macrophyte Biomass
(g(dw)m−2) 49.7 217.5 23.2 – – 17.4
Chla(mg m−3) - – 6.0 42.2 34.7 3.9
Table 3. Gas-transfer coefficients (mean values) calculated for the mesocosm experiments with Method 1 and Method 2 (see text)
Date Gas transfer coefficients (g O2m−2h−1) Method 1 Method 2
July 1996 1.0 0.2
November 1996 2.6 0.9 September 1997 1.7 0.4
diffusion of heat. Therefore, the time scale for molec-ular diffusion of oxygen to take an effect is larger then the time-scale of the model runs.
The first two terms in Equations (7) and (8) rep-resent the gains and losses of oxygen through macro-phyte gross production and respiration. The last term in both equations corresponds to the gains/losses through convective mixing, which occurs mainly dur-ing overnight cooldur-ing of the surface layer.
The model was implemented using the modelling software EcoWin (Ferreira, 1995). EcoWin uses Ob-ject Oriented Programming (OOP) to relate a set of ‘ecological’ objects by means of a server, or shell, which allows these to interact with each other, and dis-plays the results of their interaction. Both the EcoWin shell and the different objects have been implemented in C++for WindowsTM.
Results and discussion
Mesocosm experiments
In Table 2 the reference parameters measured in the lagoon during the experiments are presented. Data on oxygen dynamics obtained during the mesocosm ex-periments, are shown in Figure 3. Some of the oxygen curves exhibit a ‘normal’ behaviour (e.g., July 1996, November 1996 and September 1997), with a clear decrease in dissolved oxygen during the night and a clear increase during the day, whereas others show less clear patterns (December 1997, March 1998 and June 1998). These patterns are difficult to justify when there are positive oxygen variations during the night that can not be explained by diffusion, as is the case when oxy-gen concentrations are above saturation. A possible explanation for these ‘abnormal’ results could be the bubble air injection of oxygen by the wind (Emerson et al., 1993) and/or rain in the case of the December 1997 campaign.
In Table 3 the gas transfer coefficients estimated with Methods 1 and 2 are shown. In Table 4 the daily integrated production, respiration and diffusion for the mesocosms and for the lagoon (neglecting advection), computed with Methods 1 and 2, are presented.
Table 4.Summary of metabolism measurements (g O2m−2day−1) in the lagoon and in the mesocosms (mesocosms values are means of three replicates) calculated with Methods 1 and 2 (see text). D - Diffusion, GPP - Gross Primary Production, R – Respiration and NPP – Net Primary Production
Lagoon Pelagic mesocosms Bentho-pelagic mesocosms Date Method 1 Method 2 Method 1 Method 2 Method 1 Method 2
July 1996 D −8.0 −2.8 −10.8 −2.9 −7.9 −1.6
GPP 12.4 12.5 7.6 4.9 7.1 8.1
R 4.0 9.3 5.8 7.5 3.8 10.2
NPP 8.4 3.2 1.8 −2.6 3.3 −2.1
November 1996 D – −5.8 – −5.5 −2.3 −1.1
GPP – 9.1 – 2.4 3.0 3.8
R – 6.9 – 2.4 9.3 10.4
NPP – 2.2 – 0.0 −6.6 −6.6
September 1997 D −0.2 −0.1 −4.3 −0.9 0.7 1.5
GPP 15.6 14.5 5.1 5.6 12.6 6.2
R 14.3 13.3 3.2 10.0 15.1 12.3
NPP 1.3 1.2 1.9 −4.4 −2.5 −6.1
tion across the air-water interface (Kemp & Boynton, 1980; Emerson et al., 1993). In Table 4, the results regarding the lagoon and the P-mesocosms of the No-vember campaign calculated with Method 1, are not shown because overnight oxygen net production gave positive results. This is probably a consequence of un-derestimating respiration or overestimating diffusion, or both, and it is more likely to occur when the oxy-gen curve does not have a very clear dusk maximum and dawn minimum. Another problem with the data from Table 4 is the higher respiration rate, calculated with Method 1, in the P-mesocosms than that of the BP-mesocosms of the July 1996 campaign.
The gas transfer coefficients reported in Table 3 are well within the values obtained by other authors (e.g., Odum, 1956; Hornberger & Kelly, 1975; Kemp & Boynton, 1980; Reyes & Merino, 1991). Diffu-sion rates are generally negative (Table 4) as a result of the oversaturated D.O. concentrations commonly observed in the lagoon and in the mesocosms, the unique exception being the BP-mesocosms in Septem-ber 1997, when night D.O. values were well below saturation (Figure 3).
The lowest oxygen values were measured in Sep-tember 1997, when the water level was very low, ca. 60 cm, the water temperature high, 25.2◦C, and the bottom of the lagoon covered with macrophytes, mainly Ruppia cirrhosa. During summer months, the oxygen dynamics observed in the BP-mesocosms
was closer to the results obtained in the lagoon and quite different from the results observed in the P-mesocosms. These differences are less important in the other months, when the lagoon is generally deeper due to rainfall, and physical processes become more important as suggested by the absence of a typical oxygen curve.
result of the negative differences between the final and the initial D.O. values in the mesocosms.
The assumptions of the applied three way ANOVA were checked prior to analysis. There were no signifi-cant correlations between the means and the variances. However, there was a significant heterogeneity of vari-ances among samples (p < 10−5 with the Cochran test). This heterogeneity could not be removed by any of the transformations indicated for percentage data (Underwood, 1981, 1997) and it was probably a re-sult of the different relative behaviour of the replicate mesocosms in different campaigns. This is to be ex-pected in a highly heterogeneous environment, where for example the macrophyte biomasses enclosed in the three replicate BP-mesoscoms in different cam-paigns can differ significantly, leading to different variances. Therefore, any results leading to the rejec-tion of the null hypothesis must be taken with care in spite of the robustness of the ANOVA to the hetero-geneity of variances (Underwood, 1997). The ANOVA results revealed significant differences for all the in-dependent effects – campaign, treatment (Pelagic vs. Bentho-pelagic) and time of sampling – for a proba-bility level (p < 10−10) several orders of magnitude lower than the one leading to the rejection of variance homogeneity, confirming the reliability of the rejec-tion of the null hypothesis (Underwood, 1981). These results were confirmed by planned comparisons con-trasting treatments and campaigns, post-hoc compar-isons with the Newman–Keuls test and the non para-metric Kruskal–Wallis ANOVA by ranks. The mean D.O. saturation value of the P-mesocosms, 129%, was significantly higher than that of the BP-mesocosms, 110.0%. Analysis of Figure 3 supports the results of the statistical tests, with most of the D.O. con-centration values of the P-mesocosms, being higher than those of the BP-mesoscosms. These differences could be partially attributed to sediment resuspension caused by the placing of the BP-mesocosms at the bottom of the lagoon. This phenomenon could induce high oxygen consumption leading to lower oxygen levels in the BP-mesocosms. However, analysis of Figure 3 does not reveal any systematic differences between the initial D.O. values in both treatments. Therefore, from the results obtained, it may be in-ferred that in the BP-mesocosms the higher respiration rates are compensated by their higher gross produc-tions in relation to the P-mesocosms. This increase in the relative importance of community respiration led generally to lower net productions, lower saturation D.O. levels and lower diffusive fluxes from the water
to the atmosphere in the Bmesocosms then in the P-mesocosms. The interaction effect – campaignversus
treatment – was also significant but at a higher proba-bility level (p <2×10⁻⁴). From this it can be inferred
that the differences between the treatments changed significantly with the campaign factor. This result may be explained by the changing relative importance of planktonic and benthic metabolism.
Analysis of the data presented in Table 4 suggests that the pelagic contribution to community respiration may be between ca. 20 and 80% of total respira-tion. These results are in good agreement with similar estimates for other Ruppia dominated communities (Murray & Wetzel, 1987). The high contribution of plankton to total respiration may result from high dissolved organic matter (DOM) levels and bacterial activity. In the literature there seems to be no infor-mation regarding the exudation rates of the dominant macrophyte species found in St. André lagoon. How-ever, considering the high exudation rates reported for macroalgae, that may be above 15% of gross produc-tion (Khailov & Burlakova, 1969), it seems plausible to hypothesise that macrophytes may also contribute with large amounts of DOM. In this case, the macro-phyte release of DOM could serve as a major pathway to link benthic primary production to pelagic food webs and secondary production, similarly to what is described by Khailov & Burlakova (1969) for coastal ecosystems.
of benthic and pelagic respiration on an areal basis in the September 1997 experiment.
The results of the mesocosm experiments may be useful to understand the relative importance of the pelagic and benthic contributions to community metabolism. Method 2 gave more reliable results than Method 1, with the former giving net oxygen pro-duction during the night (see above), although the assumption of a constant gas transfer coefficient and respiration rate is probably not very adequate. In fact, the high gross productions calculated for the pelagic mesoscosms with Method 2 (Table 4) are probably a result of overestimating the diffusion rates, specially during the September 1997 experiment (see below).
Microcosm experiments
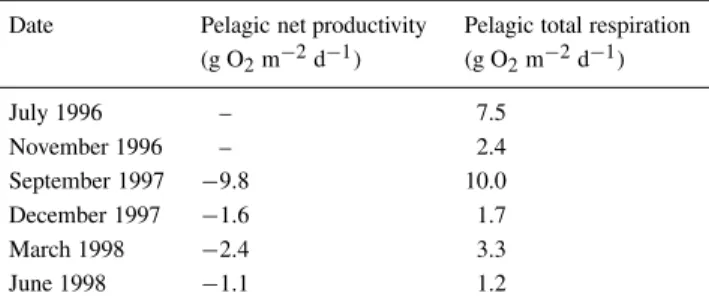
The results of the microcosm experiments and phy-toplankton productivity estimates are summarised in Table 5. During the first two campaigns it was not pos-sible to estimate pelagic primary production, because the difference between the final and the initial oxygen values both in the dark and in the transparent bottles was always negative. This and the negative pelagic net productivities of Table 5, clearly suggest that pelagic metabolism was mainly heterotrophic.
Assuming a photosynthetic quotient (P.Q.)1 of 1.00, the values presented in Table 5 correspond to a range of 37 to 337 mg C m−2 d−1. The upper limit of this range is well within the phytoplankton productivity values reported for fertile inland wa-ters (Likens, 1975) and within the range of values measured in e.g., the Lagoon of Venice (Marcomini et al., 1995). The comparison of the P-mesocosm gross productivity of September 1997, shown in Table 4 (Method 2), with the value presented in Table 5, cal-culated from short-term incubations, shows an order of magnitude difference between both results. If it is assumed that net production is around 40% of gross production (Likens, 1975), the 0.2 g O2 m−2 d−1
of Table 5 would correspond to a gross production of 0.5 g O2 m−2 d−1, whereas the value from
Ta-ble 4 (Method 2) is 5.6 g O2 m−2d−1. Considering
that chlorophyll concentrations in the St. André la-goon may reach values of over 150 mg Chl a m−3 (Bernardo, 1990), the latter gross production value is theoretically possible. However, it was very un-likely to occur in the September 1997 campaign when chlorophyll concentration was 6 mg m−3 (Table 2).
1The molar ratio between oxygen production and carbon dioxide fixation by photosynthesis (Vollenweider, 1974).
These higher metabolic estimates based on open-water techniques seem to be a common result (Kemp & Boynton, 1980). Another possible explanation may be taken from Oviatt et al. (1986) who estimated P.Q. values as high as 5.00 from dawn-dusk dis-solved oxygen and inorganic carbon measurements in mesocosms. According to these authors, higher or lower than ‘normal’ (i.e., close to 1.00) P.Q. val-ues may result from e.g. denitrification, sulphate re-duction/oxidation and calcium carbonate solution. A P.Q. value of 5 would result in a gross production of 2.5 g O2 m−2 d−1. This is the same order of
magnitude of the 5.6 g O2 m−2 d−1 calculated from
the mesoscosms. The difference between these last two values could easily be explained by a chloro-phyll concentration closer to the one measured in the mesocosms. It could be hypothesised that the value of 6 mg m−3measured at the end of the experiment
was lower than the average concentration during the experiment.
In the benthic chamber experiments, the differ-ences between the initial and the final oxygen con-centrations were generally negative even under full sun-light. The respiration rates measured in the dark chambers were generally of the order of a few 0–10 g day−1 m−2, i.e., of the same order of magnitude as the respiration rates obtained for the BP-mesocosms. However, the obtained values had a large error vari-ance, reason why they were not considered in any calculations. In some occasions, the results obtained in the transparent chambers could give positive net oxygen productions in some replicates and negative in other replicates. The reason for the large error variance might be a patchy distribution of organic mat-ter, autotrophic and heterotrophic activity within the sediments.
The estimated contribution of R. cirrhosato the community metabolism during the field experiments is summarised in Table 6. From the results shown in Table 5 it is apparent that the contribution ofR. cir-rhosato the oxygen budget is positive, except in the November 1996 campaign. The order of magnitude of its respiration rates is comparable to the water column values (Table 4, Method 2), but the production values are much higher then those of Table 4.
Considering the results presented so far it seems clear that both the plankton and the sediment are net consumers of oxygen and therefore predominantly heterotrophic. The positive net oxygen production of
Table 5. Summary of pelagic net productivity and respiration integrated over one day
Date Pelagic net productivity Pelagic total respiration (g O2m−2d−1) (g O2m−2d−1)
July 1996 – 7.5
November 1996 – 2.4
September 1997 −9.8 10.0
December 1997 −1.6 1.7
March 1998 −2.4 3.3
June 1998 −1.1 1.2
Table 6.Summary of Ruppia cirrhosanet productivity and res-piration estimates (see text). There are no estimates for the De-cember 1997 and March 1998 campaigns, because there were no macrophytes at the study site
Date R. cirrhosanet R. cirrhosarespiration productivity (g O2m−2d−1) (g O2m−2d−1)
July 1996 4.2 3.2
November 1996 −1.8 14.1 September 1997 1.8 1.6
December 1997 – –
March 1998 – –
June 1998 2.1 1.1
heterotrophy and possibly has a determinant role in keeping lagoon metabolism autotrophic.
Model simulations
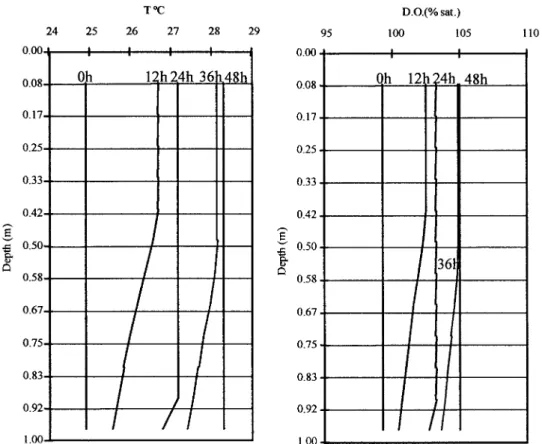
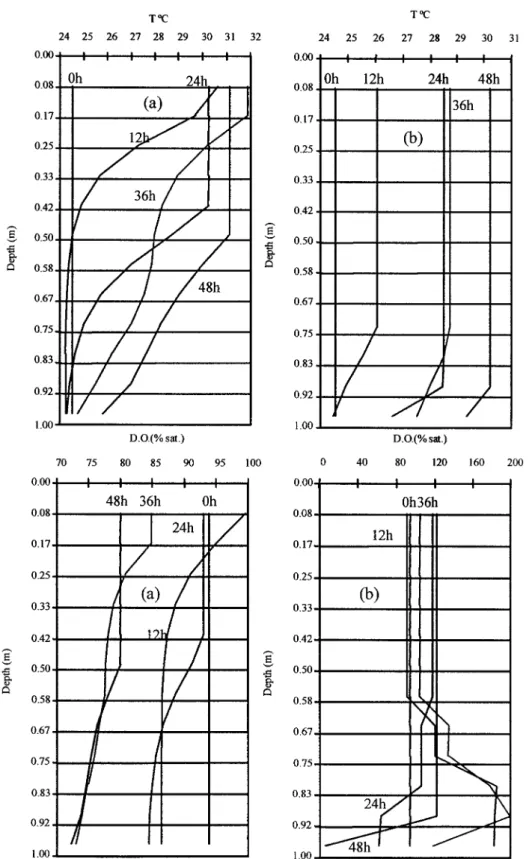
The results from the model simulations are sum-marised in Figures 4 and 5. Figure 4 corresponds to a simulation without macrophytes, whereas Figure 5 corresponds to simulations with a macrophyte biomass of 400 g DW m−2and two different canopy heights – 0.4 and 1 m. The results obtained with other biomass values are not shown since they would not add any further qualitative information.
In the absence of macrophytes (see Figure 4) the time scale for thermal stratification to develop is about half a day. However, during the night (24 hours after the beginning of the model run), due to night cooling, convective mixing and heat diffusion, stratification remains only at the bottom layer. Finally, after 48 hours, water column temperature becomes vertically homogeneous. Regarding oxygen saturation, the
verti-cal pattern is correlated to that of temperature since this simulation did not include any biogeochemical processes.
Figure 5 shows that the presence of macrophytes may produce a much stronger thermal stratification then that predicted in their absence, specially when the canopy height is 1 m. The observed temperature dif-ference between the surface and the bottom layers was 0.7◦C, in the model run without macrophytes, after 12 hours of simulation. In the model runs with macro-phytes, however, the difference was 6.0◦C, under a canopy height of 1 m, but only 1.5◦C under a canopy height of 0.4 m. In the simulations with macrophytes, the thermocline was situated higher during the day, and lower during the night due to convective mixing and heat diffusion. Regarding oxygen dynamics two different situations were found. Under a canopy height of 1 m (Figure 5a) bottom D.O. was always lower than in the top layers, whereas under a canopy height of 0.4 m (Figure 5b), bottom D.O. was higher than in the surface layers during the day, and lower during the night. The former result is a consequence of the shading effect of the higher fraction of the canopy over the lower one, reducing bottom photosynthesis. After a period of ca. 5 days, oxygen levels remained stable in all simulations, with night minima reaching zero in both simulations with macrophytes (not shown). These sharp oxygen gradients were also observed in other shallow water ecosystems (D’Avanzo & Kremer, 1994).
Figure 4. Model results: Temperature and dissolved oxygen distribution across the 12 model layers after 12, 24, 36 and 48 hours since the beginning of the simulation. These results were obtained without macrophytes.
temperature differences of 8.9◦C were calculated over a vertical distance of 1 m, giving a similar temperature gradient. This corresponds roughly to a difference of 3 sigma-t units, similar to values reported by D’Avanzo & Kremer (1994) in Waquoit Bay. The data presented in Table 7 show the two types of situations predicted by the model, regarding oxygen saturation concen-tration: Bottom minimal (e.g., Station 3) and bottom maximal values (e.g., Station 5).
The results presented in Table 7, however, are not directly comparable to model predictions because there is no data available on canopy height. These results give some empirical evidence of a causal re-lationship between macrophyte biomass loads and thermocline or oxycline development. The model re-sults demonstrate a strong dependence of water col-umn stratification on macrophyte biomass and canopy height. The general agreement between the model re-sults and the empirical data in Table 7 suggest the realism of the model.
Macrophyte harvest may therefore present an im-portant contribution to the sustainable management of
St. André lagoon, in the sense that it may help to sta-bilise the ecosystem preventing further eutrophication, by reducing the accumulation of organic matter and nutrients, the probability of thermal stratification and overnight anoxia.
Table 7. Summer thermal stratification under different macrophyte stands (stations shown in Figure 1) (data from Cancela da Fonseca (1989) and Bernardo (1990))
Station Date Hour Depth Dissolved Temp Macrophyte (m) oxygen ◦C biomass
(% sat) g(DW) m−2
Sta 8 30/8/1984 – 0.1 263.7 27.0
– 0.5 260.9 25.0 104.4
Sta 3 26/9/1984 16h30m 0.1 196.6 23.0
16h30m 0.6 49.1 18.3 332.1
Sta 5 26/9/1984 – 0.1 138.4 22.6
– 0.5 227.1 22.4 223.9
Sta 4 24/8/1985 17h30m 0.1 139.3 26.3
17h30m 1.1 203.3 25.6 181.2
Sta 2 28/9/1985 18h00m 0.1 146.3 25.4
18h00m 1.2 117.4 24.4 217.4
Sta 4 28/9/1985 17h50m 0.1 133.2 26.0
17h50m 1.0 89.0 23.5 174.6
Conclusions
Regarding the issue of the relative contribution of the different autotrophic compartments to the lagoon metabolism, the results obtained indicate that in terms of net contribution and at the time scales examined, the macrophytes are the most important group. Un-der summer conditions, in the absence of wind, a thermocline may develop in about half a day. Both empirical and model results indicate that macrophytes may influence thermocline and oxycline development to a great deal. These plants contribute significantly to bottom cooling and depending on their biomass and canopy height they may contribute to an increase or a decrease in bottom oxygen during the day. High canopy heights lead to stronger thermoclines. Lower macrophyte heights lead to weaker thermoclines and positive D.O. gradientes towards the bottom during the day, due to higher plant biomass in the bottom layers. The same high biomass explains the opposite trends observed during the night. From these results it follows that lower canopy heights induce greater os-cillations in D.O. saturation concentration than higher canopy heights while everything else being equal. Bottom cooling induced by the shading effect of the macrophyte canopy has the disadvantage of creating stratification and therefore reducing vertical mixing. Macrophyte harvest may help to prevent thermal
strat-ification and night anoxia contributing to stabilise the lagoon’s ecosystem.
Acknowledgements
This work was supported by Fundação para a Ciência e Tecnologia (Project PBICT/MAR/2245/95 – Devel-opment of a Model for Coastal Lagoon Management). The authors wish to thank the staff of Parque Natural do Sudoeste Alentejano e Costa Vicentina (site of St. André) and to the St. André Laboratory of Direcção Regional de Ambiente do Alentejo, for local support and facilities.
References
A.P.H.A. (1992) Standard Methods for the Examination of Wa-ter and WastewaWa-ter, 18th. Edition. American Public Health Organisation, Washington
Barnes RSK (1980) Coastal Lagoons. Cambridge University Press, Cambridge.
Bernardo JM, Costa AM and Cancela da Fonseca L (1988). Nutrient dynamics and dystrophy in a brackish coastal lagoon (St. André, SW Portugal). Rapp Comm Int Mer Médit 31: 61
Bernardo JM (1990) Dinâmica de uma lagoa costeira eutrófica (Lagoa de Santo André). PhD Dissertation, University of Lisbon Brix H and Lyngby JE (1985) Uptake and translocation of
phospho-rus in eelgrass (Zostera marinaL.). Mar Biol 90: 111–116 Brock TD (1981) Calculating solar radiation for ecological studies.
Calado GJP (1997) Desenvolvimento de um modelo de produção de Ruppia cirrhosa(Petagna) Grande. Aplicação à Lagoa de Santo André. Ms Dissertation, New University of Lisbon
Calado GJP and Duarte P (2000) Modelling growth of Ruppia cirrhosa. Aquatic Bot 68: 29–44
Cancela da Fonseca LMQ (1989) Estudo da influência da ‘abertura ao mar’ sobre um sistema lagunar costeiro: A Lagoa de Santo André. PhD Dissertation, University of Lisbon
Cancela da Fonseca LMQ, Costa AM and Bernardo JM (1989) Seasonal variation of benthic and fish communities in a shallow land-locked coastal lagoon (St. André, SW Portugal). Sci Mar 53: 663–669
D’Avanzo, C. and Kremer JN (1994) Diel oxygen dynamics and anoxic events in an eutrophic estuary of Waquoit Bay, Massa-chusetts. Estuaries 17: 131–139
Duarte P and Ferreira JG (1997) Dynamic modelling of photo-synthesis in marine and estuarine ecosystems. Environ Model Assessment 2: 83–93
Emerson S, Quay P, Stump C, Wilbur D., and Schudlich R (1993) Determining primary production from the mesoscale oxygen field. ICES Mar Sci Symp 197: 196–206
Ferreira JG (1995) EcoWin - An Object-oriented Ecological Model for Aquatic Ecosystems. Ecol Modelling 79: 21–34
Harlin MM (1995) Changes in major plant groups following nutri-ent enrichemnutri-ent. In: McComb AJ (ed.) Eutrophic Estuaries and Lagoons. CRC Press, London, pp. 173–188
Hervé P and Bruslé J (1981) L’Étang de Canet-Saint-Nazaire (P.O.), écologie génerale et ichthyofaune. Vie Milieu 31: 17–25 Heydorn AEF and Tinley KL (1980) Estuaries of the Cape, Part
I. Synopsis of the Cape Coast. Natural features, dynamics and utilization. C.S.I.R. Res Rep 380: 1–97
Hornberger GM and Kelly MG (1975) Atmospheric reaeration in a river using productivity analysis. J Environ Eng Div ASCE 101: 729–739
ICES (1996) Report of the working group on phytoplankton ecol-ogy. International Council for the Exploitation of the Sea. Biological Oceanography Committee. ICES CM 1996/L: 3 Janowitz GS and Kamykowski D. (1991) An eulerian model of
phy-toplankton photosynthetic response in the upper mixed layer. J Plankton Res 13: 983–1002
Kemp WM and Boynton WR (1980) Influence of biological and physical processes on dissolved oxygen dynamics in an es-tuarine system: Implications for measurement of community metabolism. Estuarine Coastal Shelf Sci 11: 407–431
Khailov KM and Burlakova ZP (1969) Release of dissolved organic matter by marine seaweeds and distribution of their total organic production to inshore communities. Limnol Oceanogr 14: 521– 527
Knauss JA (1997) Introduction to Physical Oceanography. Prentice Hall, New Jersey
Kosinski RJ (1984) A comparison of the accuracy and precision of several open-water oxygen productivity techniques. Hydrobiolo-gia 119: 139–148
Krebs CJ (1994) Ecology: The Experimental Analysis of Distribu-tion and Abundance, 4th ed. Harper Collins College Publishers, New York
Libes SM (1992) An Introduction to Marine Biogeochemistry. John Wiley & Sons, Inc., New York
Likens GE (1975) Primary production of inland aquatic ecosystems. In: Helmuth Lieth H & Whittaker R (eds.) Primary Productivity of the Biosphere. Springer-Verlag, Berlin, pp. 185–202 Macedo MF, Duarte P, Mendes P and Ferreira JG 2001.
An-nual variation of environmental variables, phytoplankton species
composition and photosynthetic parameters in a Coastal Lagoon. J Plankton Res 23: 719–732
Marcomini A, Sfriso A, Pavoni, B and Orio AA (1995) Eutrophica-tion of the Lagoon of Venice: Nutrient loads and exchanges. In: McComb AJ (ed.), Eutrophic Shallow Estuaries and Lagoons. CRC Press, London, pp. 59–80
Menéndez M and Comín FA (1989) Seasonal patterns of biomass variation ofRuppia cirrhosa(Petagna) Grande andPotamogeton pectinatusL in a coastal lagoon. In: Ros, J. D. (Ed.) Topics in marine biology. Sci Mar 53: 633–638
Menéndez M and Peñuelas J. (1993) Sesonal photosynthetic and respiratory responses ofRuppia cirrhosa(Petagna) Grande to changes in light and temperature. Arch Hydrobiol 129: 221–230 Murray L and Wetzel RW (1987) Oxygen production and consump-tion associated with the major autotrophic components in two temperate seagrass communities. Mar Ecol Prog Ser 38: 231–239 Odum HT (1956) Primary production in flowing waters. Limnol
Oceanogr 1: 102–117
Odum E (1971) Fundamentals of Ecology. Saunders Company, Philadelphia
Oviatt CA, Rudnick DT, Keller AA, Sampou PA and Almquist GT (1986) A comparison of system (O2and CO2) and C-14 mea-surements of metabolism in estuarine mesocosms). Mar Ecol Prog Ser 28: 57–67
Portela LI and Neves R. (1994) Modelling temperature distribu-tion in the shallow Tejo estuary. In: Tsakiris & Santos (ed.), Advances in Water Resources Technology and Management. Balkema, Rotterdam pp. 457–463
Postma H (1981) Processes in the sediments and in the water-sediment interface. UNESCO Tech Pap Mar Sci 33: 111–117 Price JF and Weller RA (1986) Diurnal cycling: observations and
models of the upper ocean response to diurnal heating, and wind mixing. J Geophys Res 91: 8411–8427
Reyes E and Merino M. (1991) Diel disolved oxygen dynamics and eutrophication in a shallow, web-mixed tropical lagoon (Cancún, México). Estuaries 14: 372–381
Short FT and McRoy CP (1984) Nitrogen uptake by leaves and roots of the seagrassZostera marinaL. Bot Mar 27: 547–555 Steemann Nielsen E (1962) Inactivation of the photochemical
mech-anism in photosynthesis as a means to protect cells against high light intensities. Physiol Plant 15: 161–171
Strickland JDH and Parsons TR (1968) A practical handbook of sea water analysis. Fish Res Bd Canada Bull 16: 311 pp.
Taylor AH (1993) Modelling climatic interactions of the marine biota. In: Willebrand & Anderson (ed.), Modelling Oceanic Cli-mate Interactions. NATO ASI Series, Springer-Verlag, Berlin pp. 373–413
Thornton JA, Beekman H, Boddington G, Dick R, Harding WR, Lief M, Morrison IR and Quick AJR (1995) The ecology and management of Zandvlei (Cape Province, South Africa), an enriched shallow African estuary. In: McComb AJ (ed.), Eu-trophic Shallow Estuaries and Lagoons. CRC Press, London, pp. 109–128
Thursby GB and Harlin M.M. (1984) Interaction of leaves and roots ofRuppia maritimain the uptake of phosphate, ammonia and nitrate. Mar Biol 83: 61–67
Veiga de Oliveira E, Galhano F and Pereira B (1975). Actividades Agro-Marítimas em Portugal. Instituto de Alta Cultura, Lisboa Vollenweider RA (1974) A Manual on Methods for Measuring