Rafaella Tecchio Klaus
Renovation of Brazilian Buildings to
Achieve Better Energy Efficiency and
Indoor Environmental Quality
Rafaella Tecchio Klaus
Renovation of Brazilian Buildings to
Achieve Better Energy Efficiency and
Indoor Environmental Quality
Master’s Dissertation
International Master in Sustainable Build Environment
Work supervised by
Doctor Sandra Maria Gomes Monteiro da Silva
Doctor Ricardo Filipe Mesquita da Silva Mateus
Este é um trabalho académico que pode ser utilizado por terceiros desde que respeitadas as regras e boas práticas internacionalmente aceites, no que concerne aos direitos de autor e direitos conexos.
Assim, o presente trabalho pode ser utilizado nos termos previstos na licença abaixo indicada.
Caso o utilizador necessite de permissão para poder fazer um uso do trabalho em condições não previstas no licenciamento indicado, deverá contactar o autor, através do RepositóriUM da Universidade do Minho.
Licença concedida aos utilizadores deste trabalho
[Caso o autor pretenda usar uma das licenças Creative Commons, deve escolher e deixar apenas um dos seguintes ícones e respetivo lettering e URL, eliminando o texto em itálico que se lhe segue. Contudo, é possível optar por outro tipo de licença, devendo, nesse caso, ser incluída a informação necessária adaptando devidamente esta minuta]
Atribuição CC BY
I hereby declare having conducted this academic work with integrity. I confirm that I have not used plagiarism or any form of undue use of information or falsification of results along the process leading to its elaboration. I further declare that I have fully acknowledged the Code of Ethical Conduct of the University of Minho.
Resumo
Ao longo dos anos as preocupações ambientais começaram a ganhar cada vez mais importância. Mundialmente, o setor da construção civil é um dos principais responsáveis pelo consumo de energia primária e emissão de dióxido de carbono (CO₂). A sustentabilidade dos edifícios é hoje um vetor de progresso e mitigar o impacto da construção, dos materiais e dos equipamentos e sistemas em funcionamento com o foco no aproveitamento dos recursos e poupanças energéticas é um desafio que várias organizações internacionais procuram resolver. No Brasil, após a implementação, em 2010, do Regulamento Técnico da Qualidade para Eficiência Energética de Edifícios Comerciais, de Serviços e Públicos – RTQC, considera-se que o próximo passo a ser dado em termos regulatórios seja analisar o padrão de consumo de energia das edificações. A reabilitação pode ser a chave para recuperar o setor da construção permitindo a otimização do desempenho energético de um edifício de modo a minimizar os consumos de energia da edificação e ao mesmo tempo ir de encontro às necessidades dos ocupantes. Assim, foi realizado um inquérito relacionado com o conforto dos trabalhadores de edifícios de escritórios localizados na cidade de Porto Alegre, estado do Rio Grande do Sul - Brasil, a fim de identificar os principais fatores de desconforto dos funcionários em seu local de trabalho, relacionados com o conforto térmico e acústico, iluminação, ventilação e qualidade do ar interior. O outro objetivo deste estudo foi criar um modelo virtual de edifício de escritórios, com características baseadas na revisão da literatura e nos resultados do inquérito, para realizar uma avaliação da demanda de energia. Diferentes soluções de reabilitação foram analisadas com o objetivo de identificar a mais adequada, com o melhor desempenho energético, para a renovação de edifícios de escritório. Os cenários com fachada com sistema ETICS, obtiveram os melhores e piores desempenho. A combinação com o pior desempenho foi a solução de reabilitação com sistema ETICS, vidro simples, sistemas de iluminação e HVAC conforme definido para o modelo base e sem adição de dispositivos de sombreamento. Enquanto as duas melhores soluções, ambas com bom desempenho energético total, também possuíam o sistema ETICS na sua composição, uma delas englobando vidro simples, sistemas de iluminação e HVAC (opção Best Practice) e sem nenhum sistema de sombreamento e a outra, contendo vidro duplo, sistemas de iluminação e HVAC (modelo base) e adição de sistema de sombreamento. Mediante os resultados obtidos neste estudo foi possível concluir que, por meio da aplicação de várias medidas de reabilitação, é viável tornar um edifício energeticamente mais eficiente, reduzindo as suas necessidades energéticas e melhorando a qualidade de vida dos ocupantes.
Palavras-chave: Eficiência Energética, Qualidade do Ambiente Interior, Conforto Térmico, Reabilitação, Bem-estar.
Abstract
Over the years, environmental concerns began to gain more and more importance. Worldwide, the construction sector is one of the main responsible for the consumption of primary energy and the emission of carbon dioxide (CO₂). The sustainability of buildings is now a vector for progress and mitigating the impact of construction, materials, equipment and systems in operation with a focus on the use of resources and energy savings is a challenge that several international organizations seek to solve. In Brazil, after the implementation, in 2010, of the Technical Quality Regulation for Energy Efficiency of Commercial, Office and Public Buildings - RTQC, it is considered that the next step to be taken in regulatory terms is to analyze the pattern of energy consumption of buildings. Rehabilitation may be the key to recover the construction sector, allowing the optimization of the energy performance of a building to minimize the energy consumption and at the same time meet the needs of the occupants. Thus, a survey related to the comfort of workers at office buildings in the city of Porto Alegre, located in the state of Rio Grande do Sul - Brazil was carried out in order to identify the main causes of employees’ discomfort at the workplace, related to thermal and acoustic comfort, lighting, ventilation and indoor air quality. The other objective of this study was to create a virtual model of an office building, with characteristics based on the literature review and the survey results, to carry out an energy demand assessment. Different renovation solutions were analyzed, aiming to identify the most adequate ones, with the best energy performance. The scenarios with façade with ETICS system obtained the best and worst performance. The combination with the worst performance was the renovation solution with ETICS system, simple glass, lighting systems and HVAC as defined for the base model and without the addition of shading devices. While the two best solutions, both with good total energy performance, also had the ETICS system in their composition, one of them encompassing simple glass, lighting systems and HVAC (Best Practice option) and without any shading system and the other, containing glass double, lighting and HVAC systems (base model) and addition of shading system. Based on the results obtained in this study, it was possible to conclude that, through the application of various renovation measures, it is feasible to make a building more energy-efficient, reducing its energy demand and improving the quality of life of the occupants.
Table of Contents
1. Introduction ... 1
1.1 Background ... 1
1.2 Objectives of the Work ... 4
1.3 Structure of the Document ... 5
2. State of the Art ... 6
2.1 Sustainability General Concepts ... 6
2.2 Energy Performance and CO₂ Emission Relevance at Global Level ... 9
2.3 Energy Consumption in Brazil ... 13
2.4 Indoor Environmental Quality ... 15
2.4.1 Thermal Comfort ... 15
2.4.2 Visual Comfort – Lighting Quality ... 18
2.4.3 Acoustic Quality ... 20
2.4.4 Indoor Air Quality ... 22
2.4.5 Ventilation ... 25
2.5 Energy Performance and Environmental Quality of Office Buildings ... 27
3. Methodology ... 31
3.1 Porto Alegre City Analysis and Climate ... 31
3.2 Questionnaire Application ... 33
3.3 Energy simulation tool ... 35
3.3.1 Building Model Definition ... 36
3.3.1.1 Geometry and Materials ... 38
3.3.1.2 Definition of Building Usage Characteristics ... 40
3.3.1.3 HVAC System... 40
3.4 Building Simulation ... 41
3.4.1 Energy Renovation Solutions... 42
3.4.1.1 Reinforcement of Thermal Insulation - Exterior Walls ... 42
3.4.1.2 Solar control ... 43
3.4.1.3 Double Glass... 44
3.4.1.4 Best Practice ... 45
4. Results ... 48
4.1 Analysis and Discussion of the Survey Results ... 48
4.1.1 Demographic Characterisation of the Survey ... 49
4.1.3 Thermal Comfort ... 51
4.1.4 Lighting Quality ... 53
4.1.5 Acoustic Quality ... 53
4.1.6 General Findings ... 55
4.2 Analysis and Discussion of the Energy Demand Simulation Results ... 57
4.2.1 Case Study Base Model Analysis ... 57
4.2.2 Building Performance with the Implementation of the Proposed Renovation Solutions ... 60
4.2.2.1 Solutions for the Renovation of the Façade – ETICS System Analysis ... 60
4.2.2.2 Solutions for the Renovation of the Façade - Shading System Device ... 62
4.2.2.3 Solutions for the Renovation of the Façade - Glazing Analysis ... 65
4.2.3 Defined Solution Packages of Renovation Solutions Analysis ... 67
4.3 Suggestion of Good Practices to Integrate with Previous Proposals ... 70
5. Conclusion ... 73
5.1 Limitations of the Work ... 75
5.2 Recommendations for Future Work ... 76
References ... 78
List of Figures
Figure 1 – Changes in global primary energy demand in the world, 2011-2018 ... 9
Figure 2 – Change in global final demand, by fuel, 2011-2018. ... 10
Figure 3 – Global share of buildings and construction final energy and emissions in 2018 ... 11
Figure 4 – Changes in floor area, population, building sector energy use and energy related emissions globally, 2010-2018. ... 12
Figure 5 – Domestic electricity supply by source. ... 13
Figure 6 – Electricity consumption share by sector in Brazil. ... 13
Figure 7 – Electricity consumption share by sector in Brazil. ... 14
Figure 8 – Acceptable operative temperature, to, ranges for naturally conditioned spaces ... 16
Figure 9 – Influence of the solar orientation for the positioning of the building ... 18
Figure 10 – Types of ventilation: Single-side ventilation (a), Crossflow ventilation (b), Stack ventilation (c), Top down ventilation (d) ... 26
Figure 11– Map of Brazil: Location of Porto Alegre. ... 32
Figure 12 – Average maximum temperature in Porto Alegre during 1985-2015 (ºC) ... 32
Figure 13 – Average minimum temperature in Porto Alegre during 1985-2015 (ºC) ... 33
Figure 14 – Average Precipitation in Porto Alegre during 1985-2015 (mm) ... 33
Figure 15 – Case study building reference floor plan and thermal zones ... 38
Figure 16 – Illustration of the horizontal shading devices. ... 44
Figure 17 – Location floor of the workplace inside the office buildings in Porto Alegre ... 49
Figure 18 – Main characteristics of the façade of the office buildings in Porto Alegre, accoding to the survey. ... 49
Figure 19 – Age of the employees, that answer the survey, in Porto Alegre ... 50
Figure 20 – Indoor air quality characteristics in office buildings, according to survey conducted in Porto Alegre ... 51
Figure 21 – Classification of thermal comfort conditions in the workplace, according to survey conducted in Porto Alegre ... 52
Figure 22 – Classification of lighting quality in the workplace, according to survey conducted in Porto Alegre ... 53
Figure 23 – How often noise in the workplace affects communication in office buildings, according to survey conducted in Porto Alegre. ... 54
Figure 24 – How often the performance at work is affected by acoustic problem in office buildings, according to survey conducted in Porto Alegre... 55 Figure 25 – Classification of level noise at the workplace, according to survey conducted in Porto Alegre ... 55 Figure 26 – Main indoor environmental quality factors which influence the work performance in office buildings, according to survey conducted in Porto Alegre ( ... 56 Figure 27 – How often is the computer used in the workplace, according to survey conducted in Porto Alegre ... 56 Figure 28 – Annual internal and solar thermal gains (kWh) for the reference floor plan (The Author, 2020). ... 59 Figure 29 – Annual internal and solar thermal gains (kWh) for the reference floor plan after adding an external shading system at the windows of the façade. ... 62 Figure 30 – Annual internal and solar thermal gains (kWh) for the reference floor plan after adding double glazing and external shading system at the windows of the façade. ... 63 Figure 31– Annual internal and solar thermal gains (kWh) for the reference floor plan after adding double glazing at the windows of the façade ... 66 Figure 32– Total energy demand at the reference floor plan for the base model characteristics (solution 1) comparing to the other 13 different renovation solution. ... 70
List of Tables
Table 1 - 17 UN Sustainable development goals for 2030 agenda ... 8
Table 2 – Building characteristics in Brazil. ... 37
Table 3 – Thermal property of the virtual office building elements ... 39
Table 4 – General parameters for the simulation of the case study building - base model ... 40
Table 5 – Exterior wall materials for ETICS. ... 43
Table 6 – Proposed renovation solutions for the façade – opaque part. ... 43
Table 7 - Comparison of characteristics for lighting and HVAC systems by DesignBuilder software and base model building ... 45
Table 8 - Matrix of the characteristics (variables) of the 14 simulated solutions. ... 45
Table 9 – Global energy demand for the reference floor plan for the base model characteristics ... 58
Table 10 – Energy demand for the main energy uses at the reference floor plan for the base model characteristics ... 58
Table 11 – Energy demand for the main energy uses at the reference floor plan for ETICS envelope system characteristics considering different thicknesses of insulation ... 60
Table 12 – Variation of energy demand for heating and cooling and the total energy demand at the reference floor plan comparing the base model with ETICS envelope system characteristics and the different thickness of insulation ... 61
Table 13 – Energy demand for the main energy uses at the reference floor plan after adding an external shading system to the windows of the façade ... 63
Table 14 – Energy demand for the main energy uses at the reference floor plan after adding double glazing and external shading system at the windows of the façade. ... 64
Table 15 - Variation of total solar gains at the reference floor plan comparing the use of single/double glazing when adding shading device system at the windows of the façade. ... 64
Table 16 – Energy demand for the main energy uses at the reference floor plan after adding double glazing at the windows of the façade ... 65
Table 17 - Variation of energy demand for heating and cooling and the total energy demand at the reference floor plan for the base model characteristics, comparing the single and double glazing ... 66
Table 18 – Energy demand for the main energy uses at the reference floor plan for 6 different solutions ... 67
Table 19 – Variation of energy demand for heating and cooling and the total energy demand at the reference floor plan for the base model characteristics (solution 1) comparing to the other 13 different renovation solution. ... 69
List of Abbreviations
ABNT - Associação Brasileira de Normas Técnicas / Brazilian Association of Technical Standards ASHRAE - American Society of Heating, Refrigerating and Air-Conditioning Engineers
BEN - Balanço Energético Nacional / National Energy Balance
CBCS – Conselho Brasileiro de Construção Sustentável / Brazilian Council for Sustainable Construction Cfa - Humid Subtropical Climate
CGIEE - Energy Efficiency Indicators and Levels Management Committee CO₂ - Carbon Dioxide
CO - Carbon Monoxide
COP – Coefficient of Performance dB - Decibels
DOE - North American Department of Energy
EPE - Empresa de Pesquisa Energética / Energy Research Company ETICS - External Thermal Insulation Composite System
GDP - Gross Domestic Product GHG - Greenhouse Gas
GtCO₂ - Gigatonne of Carbon Dioxide
HVAC - Heating, Ventilating and Air-Conditioning Systems IAQ - Indoor Air Quality
IEA - International Energy Agency IEQ - Indoor Environmental Quality
INMETRO - Instituto Nacional de Metrologia Normalização e Qualidade Industrial / National Institute of Metrology Standardization and Industrial Quality
ISO - International Organization for Standardization LBNL - Lawrence Berkeley National Laboratory
LEED - Leadership in Energy and Environmental Design LED - Light-Emitting Diodes
MIT - Massachusetts Institute of Technology
MME - Ministério de Minas e Energia / Ministry of Mines and Energy Mt - Megaton
NOx - Nitrogen Oxides O3 - Ozone
PM - Particulate Matter PV - Solar Photovoltaic Panel RHE - Rotating Heat Exchangers
RTQ-C - Regulamento Técnico da Qualidade para o. Nível de Eficiência Energética de Edificações. Comerciais, de Serviços e Públicas / Technical Quality Regulation for Commercial, Office and Public Buildings
SBS - Sick Building Syndrome
SDGs - Sustainable Development Goals UN - United Nations
UNCED - United Nations Conference on Environment and Development UNFCC - United Nations Framework Convention on Climate Change USA - United States of America
VOCs - Volatile Organic Compounds VRF - Variable Refrigerant Flow WHO - World Health Organization WWR - Window to Wall Ratio
WCED - World Commission on Environment and Development WGBC - World Green Building Council
1.
Introduction
1.1 Background
Throughout history, humankind has sought the way to perfection. The evolution of knowledge, such as science and technology, has allowed the society to understand how to transform energy and use it systematically, for the benefit of social welfare. The Industrial Revolution that started in the middle of the 1700s, and the major milestone of the energy use was originated in this period of the time, which redesigned not only lifestyles but also economic activity. The planet’s population increased significantly reaching 1 billion by 1800 and then doubling again by 1926. By the beginning of the 21st century, it had grown up to 6 billion (Folk, 2018).
The population growth has affected the production and consumption of products and services, the use of resources (renewable and non-renewable), mobility, transport, health, education, information, thus creating new behavior patterns in society. Due to the current energy paradigm, namely the global dependence of fossil fuels when using coal as a power source for industry, from energy generation to manufacturing, the challenge of climate change and environmental issues related to different sectors emerged (Folk, 2018).
The construction industry is one of several energy-consuming sectors worldwide (International Energy Agency [IEA] & United Nations [UN], 2017). The building sector has significant impacts on the environment, wellbeing and economy. Within this sector, there are two main types of buildings: residential and non-residential (commercial and office buildings). Commercial buildings represent 23% of the European Union (EU) building stock, according to the European Commission Website (2019). The Commission also states that 1 in every 6 Citizens works in offices. A healthy and comfortable indoor environment is a basic premise in all buildings, bearing in mind that people spend 90% of their lives indoors (Attema, Fowell, Macko & Neilson, 2018). When considering office buildings, employees spend 2 080 hours in office spaces every year (Attema, Fowell, Macko & Neilson, 2018), making the indoor environmental quality (IEQ) a significant aspect for their health and wellbeing.
According to the National Energy Balance (BEN) (Empresa de Pesquisa Energética [EPE], 2019), the industrial, residential and commercial sectors accounted for approximately 80% of the consumed
electricity in Brazil in 2018. About 42.3% of electricity consumption comes from the building sector, and commercial buildings represent 16.9% of the total electricity consumption (EPE, 2019). In Brazil, the electricity matrix is predominantly hydraulic, around 66.6% (EPE, 2019). However, in recent years the country has faced a severe water crisis that resulted in the replacement of hydroelectric by thermoelectric generation. Brazil also uses more non-renewable energy in its internal energy supply, about 54.7% (EPE, 2018).
The construction sector has an important role in terms of energy demand and carbon dioxide (CO₂) emissions, being one of the leading causes of the greenhouse effect. Therefore, energy savings and reduction of CO₂ emissions must be adequately addressed at the political level to mobilise the market for a low energy and greenhouse gas (GHG) society, which can bring significant benefits to the country, such as positive socio-environmental impacts.
This improvement can be achieved by adopting construction strategies that guarantee good indoor environmental quality, energy efficiency, and low CO₂ emission and is a way of minimising socio-environmental impacts and maximise the economic performance of buildings. Improving the energy performance of existing buildings is fundamental for reducing the emission of greenhouse gases as well as to mitigate climate changes (Giuli, Pos, & Carli, 2012). Besides that, the problems with indoor environmental quality at a building (thermal, acoustic, visual comfort and air quality) can be directly related to the comfort, health and productivity of the occupants (Giuli, Pos, & Carli, 2012).
To ensure a good indoor environment inside an office building where people feel good, perform well and minimise the risk of building related health problems, it is necessary to combine solutions that promote energy efficiency and contribute to a better indoor environmental quality. To guarantee the indoor environmental quality and a sustainable construction, the main comfort conditions as heating, cooling, lighting, indoor air quality (IAQ) and acoustic insulation must be considered. Projecting a future scenario, the National Energy Plan - 2030 (Ministério de Minas e Energia [MME] & EPE, 2007) predicts that with energy efficiency actions, the trend of increasing demand for energy consumption in Brazil may decrease if government policies in this sector continue. Regulations, studies and procedures to minimise this consumption have been elaborated, establishing parameters that describe the minimum efficiency of the buildings.
One of the reasons for the concern with the rationalisation of energy in buildings in Brazil began with the crisis in the electricity sector that occurred in 2001, which led the government to be also concerned with issues related to the rational end-use of electricity and its efficient use. Through Law No. 10.295 of December 19, 2001, the Energy Efficiency Indicators and Levels Management Committee (CGIEE) was established and regulated. In this law, it was accepted that “maximum levels of energy consumption, or minimum energy efficiency, should be created for energy-consuming equipment and devices manufactured or commercialised in the country, as well as for existing buildings”. Among its main actions, is the development of the Technical Quality Regulation for Energy Efficiency of Commercial, Office and Public Buildings - RTQ-C (Instituto Nacional de Metrologia Normalização e Qualidade Industrial [INMETRO], 2010).
The labelling of commercial, office and public buildings must meet the requirements regarding the performance of the envelope, installed lighting system power and the efficiency of the air conditioning system. The classification is made for each requirement ranging from A (most efficient) to E (least efficient). Next, weights are assigned to the evaluated items: envelope (30%), lighting system (30%) and air conditioning system (40%) (INMETRO, 2010). The highest weight (70%) is given to the aspects related to the thermal balance of the building - the envelope and the air conditioning system - in the energy efficiency assessment of the building. The envelope has the primary function of controlling thermal gains to generate a thermal balance that provides fewer hours in which the air conditioning systems are used. Thus, the colours, materials and the composition and thickness of the construction components used influences the electricity consumption in a building and, therefore, must be considered in the project (Santana, 2006; Carvalho, Rovere & Gonc, 2010; Dornelles, 2008; Santos & Souza, 2012; Sozer, 2010; Sun, Giles & Lian, 2014).
Lamberts et al. (2014) states that a building is considered more energy efficient than another when it provides the same environmental conditions of comfort to its user, with lower energy consumption. The definition of consumption milestones can be made through the determination of similar primary characteristics, such as activities, volumetric energy supply groups, year of construction and then compared with secondary characteristics such as the use pattern of the building, the number of occupants, air conditioning, lighting, lighting controls, within the same activity analysed (Carlo, 2008).
According to Carlo (2008), energy demand is a function of variables that directly use energy, such as artificial lighting, appliances and air conditioning systems, and variables that interfere in these systems, such as building parts and how the system is used. In addition, the building contributes to energy consumption through thermal exchanges between the internal and external environments. For example, in hot climates the thermal gains are higher and, together with the internal gains, due to occupancy, equipment and lighting, they produce a thermal load that must be compensated by the air conditioning system in artificially conditioned buildings.
1.2 Objectives of the Work
Based on the findings made previously and because there are no studies for the region under analysis that identify the main problems related to the indoor environmental quality in office buildings, the study aims to identify (with the help of an online survey) the main cause of employees’ discomfort at the workplace, related to thermal, visual and acoustic comfort, ventilation and indoor air quality. The other objective of this study is to create a virtual model of an office building, with characteristics based on the literature review and with the answers from the survey, to carry out an energy demand assessment (using computer simulation). Different renovation solutions will be analysed and among those that will be simulated, the goal is to identify the most adequate, with the best energy performance (considering only the energy demand), of the building’s renovation solution.
The city of Porto Alegre was chosen for the study as it has different and well-defined climates, summer is hot and humid, and winter is mild. Over the year, the weather is rainy and partly cloudy. Throughout the year, the temperature generally ranges from 10°C to 30°C and is rarely below 5°C or above 35°C (Instituto Nacional de Meteorologia [INMET], 2020), making a wide range of analyses, to cover the climate variability.
To achieve the defined objectives, it is necessary to understand the impact of an existing building in terms of the indoor environmental quality and the energy demand, in order to be able to propose different alternatives that can improve the final performance of the office building. Given the above, some points that deserve attention are highlighted, such as:
1) Need to identify the main indoor environmental quality problems in the existing office buildings. This was carried out through a survey to the occupants of several office buildings in Porto Alegre;
2) Characterize the most adequate renovation solutions for improving the energy efficiency of office buildings. The analysis was performed through dynamic simulation of a virtual reference building, determining the energy demand of the building considering different renovation solutions and packages (combination of solutions) for the envelope, lighting and HVAC systems.
1.3 Structure of the Document
The present work is organized into five chapters. The first chapter presents an introduction to the proposed theme, addressing the contribution of the construction sector to the environment and people. Thus, the justifications were developed, and the objectives of the work were established. The structure of the document is also presented in the first chapter.
The second chapter presents the review of the bibliography, highlighting the generic concepts of sustainability, impact of energy consumption and emission of carbon dioxide (internationally and nationally) on the construction sector and finally, the characterization of the main factors that influence the health and well-being of people who occupy office buildings.
In the third chapter, the methodological procedure used in this research is presented in order to meet the proposed objectives. It begins with a description of the survey for identifying the universe of buildings to be studied, as well as the selection of the building characteristics for the definition of the virtual office building to be analysed.
The fourth chapter presents the research results. In section 4.1, the outcome of the research carried out in Porto Alegre are shown and in section 4.2, the results of the simulation are presented. At section 4.3, some good practices that can help to improve the indoor environmental quality at workplaces.
Finally, the research conclusions developed based on the results, and the bibliographic review are presented in chapter five. The limitations of the research and recommendations for future work are also listed in the last chapter.
2.
State of the Art
2.1 Sustainability General Concepts
Due to the increase in global warming, there is a need to discuss sustainability. These concepts are widely used when seeking to mitigate environmental degradation and guarantee economic and social growth. But still, there is a lack of knowledge regarding these concepts that need to be clarified. Since they have broad definitions, it can be easily interpreted according to the vision and knowledge of each individual.
In the last two centuries, the imbalance between the human being and the environment has been felt more strongly (Meadows et al., 1972). Along with the growing human, social and economic development that took place throughout the twentieth century, the environmental impact has grown, becoming a problem with global consequences. Based on this approach, in 1972 the first alert to the planet, prepared by the Massachusetts Institute of Technology (MIT), appeared in "Club of Rome" report (a group that came together to discuss a wide range of issues related to politics, international economics and, above all, the environment and sustainable development) (Meadows et al., 1972). This report has concluded that Earth would not support population growth much longer due to the pressure on natural and energy resources and consequently pollution, even considering cleaner technologies (Meadows et al., 1972).
In 1972 the United Nations (UN) held the first world conference about Man and the Environment (UN, 1972). In 1987 a report entitled "Our Common Future" prepared by World Commission on Environment and Development (WCED) under the UN released the universally adopted concept of sustainable development, defined as: Development that meets the needs of the present without compromising the ability of future generations to meet their own needs. Sustainable development is not a fixed state of harmony, but rather a process of change in which exploitation of resources, the direction of investments, the orientation of technological development and institutional changes are made consistent both with the needs of the present and with those of the future. (World Commission on Environment and Development [WCED] &UN, 1987).
The principles to guide countries in future sustainable growth were established in 1992, in Rio de Janeiro, at the United Nations Conference on Environment and Development (UNCED), popularly known as the Earth Summit. One of the main agreements signed during this conference was the Agenda 21 program that describes the first steps for countries to start sustainable development at both local and global levels.
All signatories of the 179 countries present in Rio-92 have pledged to meet the challenge of sustainable growth in its three dimensions of sustainability: social, economic and environmental.
At Rio + 10, the term sustainable development reaffirms the quest to improve the quality of life for all the world's inhabitants without increasing the use of natural resources beyond the Earth capacity. Although sustainable development may require different actions in each region of the world, efforts to build a sustainable way of life include the integration of actions in three main areas, previously mentioned in Rio-92 but with a more elaborate description (UN, 2002):
• Growth and Economic Equity - Global economic systems, now interconnected, require an integrated approach to promote responsible long-term growth while ensuring that no nation or community is left behind.
• Conservation of Natural Resources and the Environment - To conserve the environmental heritage and natural resources for the future, economically viable solutions must be created to reduce the consumption of resources, prevent pollution and to preserve natural habitats.
• Social Development - All over the world, people need jobs, food, education, energy, health services, water and sanitation. While discussing these needs, a global community must also ensure that a rich array of cultural and social diversity and labour rights are respected and that all members of society can participate in determining their futures.
In June 2012, with the Rio + 20 Conference on Sustainable Development, where Governments decided to develop global Sustainable Development Goals (SDGs), building on the Millennium Development Goals but also including issues such as natural resources management, sustainable consumption and production, effective institutions, good governance, the rule of law and peaceful societies.
In 2015, at the 70th UN General Assembly on 25 September 2015, world leaders adopted a new global sustainable development framework, the 2030 Agenda for Sustainable Development, which represents a commitment to eradicate poverty and achieve sustainable development worldwide, by 2030 (European Commission, 2016), having at its core the SDGs. Seventeen SDGs (Table 1) and their 169 associated targets are universally applicable and interlinked.
Table 1 - 17 UN Sustainable development goals for 2030 agenda (Adapted from European Commission, 2016).
Goal Objective Goal Objective
End of poverty in all its forms everywhere End hunger, achieve food security and improved nutrition and promote sustainable agriculture
Ensure healthy lives and promote well-being for all at all ages
Ensure inclusive and equitable quality education and promote lifelong learning opportunities for all
Achieve gender equality and empower all women and girls
Ensure availability and sustainable management of water and sanitation for all
Ensure access to affordable, reliable, sustainable and modern energy for all
Promote sustained, inclusive and sustainable economic growth, full and productive employment and decent work for all
Build resilient infrastructure, promote inclusive and sustainable industrialization and foster innovation
Reduce inequality within and among countries
Make cities and human settlements
inclusive, safe, resilient and sustainable Ensure sustainable consumption and production patterns Take urgent action to combat climate
change and its impacts*
Conserve and sustainably use the oceans, seas and marine resources for
sustainable development Protect, restore and promote sustainable
use of terrestrial ecosystems, sustainably manage forests, combat desertification, and halt and reverse land degradation and halt biodiversity loss
Promote peaceful and inclusive societies for sustainable development, provide access to justice for all and build effective, accountable and inclusive institutions at all levels
Strengthen the means of implementation and revitalize the Global Partnership for
Sustainable Development
* Acknowledging that the United Nations Framework Convention on Climate Change is the primary international, intergovernmental forum for negotiating the global response to climate change.
In the same year, the Paris Climate Agreement (COP21), the Addis Ababa Action Agenda, as an essential part of the 2030 Agenda, and the Sendai Framework for Disaster Risk Reduction were also adopted (European Commission, 2016).
The current concept of sustainable development was mentioned in conferences such as COP-25, which took place in Madrid in 2019. The sustainable development concept still focuses the same three pillars, re-emphasizing the urgent need to address the significant gap between the aggregate effect of Parties’ mitigation efforts in terms of global annual emissions of greenhouse gases by 2020 and aggregate emission pathways consistent with holding the increase in the global average temperature to well below 2°C above pre-industrial levels and pursuing efforts to limit the temperature increase to 1.5°C above pre-industrial levels (United Nations Framework Convention on Climate Change [UNFCCC], 2019). As this approach has been developed, the concepts of sustainability and sustainable development continue to evolve. The following sections address energy performance and CO₂ emissions in the world and their direct link with sustainability in civil construction.
2.2 Energy Performance and CO₂ Emission Relevance at Global Level
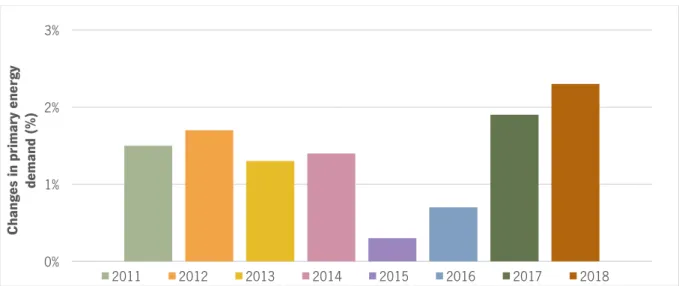
The twentieth century was characterised by significant technological advances and social developments that were supported by oil exploration, with an increased request for all fuels (IEA, 2019). Led by natural gas comprising 46%, oil 15%, and coal 9%, in total fossil fuels accounted for 70% of the demand growth. They outweighed the 24% increase from renewables in primary energy demand (IEA, 2019). Figure 1 shows that the global total primary energy demand (energy production plus energy imports, minus energy exports) grew by 2.3% in 2018 (IEA, 2019).Figure 1 – Changes in global primary energy demand in the world, 2011-2018 (Adapted from IEA, 2019). 0% 1% 2% 3% Ch an ge s in pri m ary en ergy dem an d (% ) 2011 2012 2013 2014 2015 2016 2017 2018
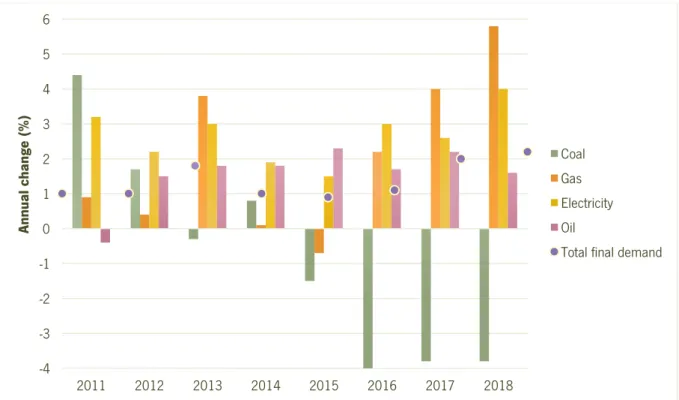
When related to final demand (refers to final consumption by the different end-use sectors and also includes non-energy use), also increased in 2018, by 2.2% (IEA, 2019). It is possible to verify, in Figure 2, that the highest growth was in gas (5.7%) and electricity (4.1%). The gas demand growth was driven by its use in industry and buildings for heating and cooling (IEA, 2019).
Figure 2 – Change in global final demand, by fuel, 2011-2018 (IEA, 2019).
The high energy demand is one of the main problems that modern society is facing. This is due, mainly, to the increased quality of life and comfort standards, leading to the use of not always energy-efficient products and equipment (air conditioning systems, appliances, among others).
In Europe, average daily temperatures in 2018 were 1.8°C above average. In North America, the temperatures in April, May, July and August were more than 2°C above average. While summer months were hotter than average, there were periods of the year when weather conditions were either close to or below historical averages (IEA, 2019). These exceptional weather events, as seen in temperature anomalies in many parts of the world, have motivated an additional energy demand.
Regarding the policies and energy-efficient measures from the European Commission, it is stated that: At present, buildings account for 40% of total energy consumption in the Union. The sector is expanding, which is bound to increase its energy consumption. Therefore, the reduction of energy consumption and
-4 -3 -2 -1 0 1 2 3 4 5 6 2011 2012 2013 2014 2015 2016 2017 2018 An nu al c ha nge ( % ) Coal Gas Electricity Oil
the use of energy from renewable sources in the buildings sector constitute important measures needed to reduce the Union’s energy dependency and greenhouse gas emissions ( European Union, 2018).
Electricity, generated mainly by coal and natural gas, has increased by more than 19% since 2010. This has become one of the most important sources due to the increasing use of energy and global emissions (IEA & UN, 2019). In 2018, a major exchange between coal and gas, driven by the economy and politics, contributed to reducing the carbon intensity of general energy use. With this transition to less carbon-intensive natural gas, 95 Megatons (Mt) of CO₂ emissions were avoided and almost 60 Mt of coal demand decreased (IEA, 2019).
Despite the reduction of the carbon intensity of global energy use, CO₂ emissions rose 1.7% in 2018 and hit a new record (IEA, 2019). As cities are responsible for over 70% of the emissions, an urban challenge is coming from several dimensions such as urban infrastructure, transport, buildings, and waste that can change the impact of CO₂ emissions on the environment (IEA & UN, 2017).
Decarbonising the buildings and construction sector is critical to achieving the Paris Agreement commitment and the United Nations Sustainable Developments Goals. Building construction and operations accounted for the largest share of both global final energy use (36%) and energy-related CO₂ emissions (39%) in 2018 (Figure 3) (IEA & UN, 2019). Energy is a key factor in global efforts to achieve sustainable development (Vera & Langlois, 2007), and buildings can be essential to achieving this goal (Rey et al., 2007).
Figure 3 – Global share of buildings and construction final energy and emissions in 2018 (Adapted from IEA & UN, 2019).
8% 22% 6% 32% 4% 28% ENERGY Non Residential Residential Construction Industry Other Industry Others Transport 8% 3% 11% 8% 11% 30% 7% 22% EMISSIONS Non Residential Indirect Non Residential Direct Residential Indirect Residential Direct Construction Industry
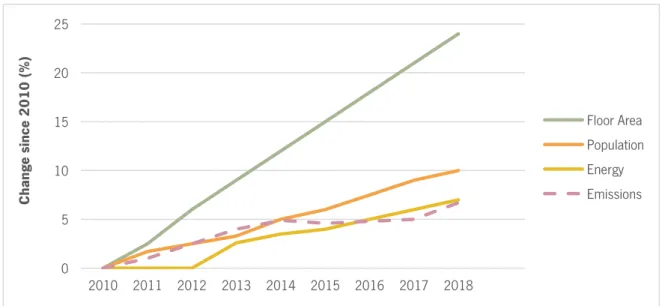
From the aspects that influence global buildings sector energy use, those that have contributed most to the growth in the energy demand since 2010 are floor area, population and building occupancy. Improvements in building envelopes (e.g. higher insulation level and better windows) and in the performance of building energy systems (e.g. heating, cooling and ventilation) and appliances (e.g. stove) have helped to offset energy demand growth (Figure 4).
Figure 4 – Changes in floor area, population, building sector energy use and energy related emissions globally, 2010-2018 (Adapted from IEA & UN, 2019).
The increase in floor area and the demand for electricity, which is still mainly generated by fossil fuels, also results in the growth of CO₂ emissions. In 2018, global emissions from the building sector grew for the second consecutive year, increasing 2% compared to 2017, to 9.7 Gigatonne of carbon dioxide (GtCO₂) (IEA & UN, 2019). From 2010 to 2018, changes in building sector energy consumption, per unit of floor area, show that the most significant reductions were in global average space heating (-20%) and lighting (-17%) (IEA & UN, 2019). Light-emitting diodes (LEDs) continue to be important in decreasing energy consumption for lighting. As the floor area increases and the energy use for space heating reduces indicating that building envelope has improved (IEA & UN, 2019).
Nevertheless, higher investments in efficiency and passive design strategies are needed to limit demand, reduce energy intensity and decrease the CO₂ emissions (IEA & UN, 2019). Among the ways to lower greenhouse gas emissions are the reduction of deforestation and protection of natural areas, the use of renewable energy sources, the use of biofuels, investing in reducing energy consumption and improving energy efficiency, reuse and recycling materials, investing in low carbon technologies.
0 5 10 15 20 25 2010 2011 2012 2013 2014 2015 2016 2017 2018 Ch an ge s in ce 20 10 ( % ) Floor Area Population Energy Emissions
2.3 Energy Consumption in Brazil
The Brazilian electricity matrix is one of the cleanest in the world, it has predominantly renewable origin, with emphasis on the hydropower that accounts for 66.6% of the domestic supply, as shown in Figure 5 (EPE, 2019). Renewable sources account for 83.3% of the domestic supply of electricity, which is the result of the sum of the amounts referring to domestic production plus imports, which are mainly of renewable origin (EPE, 2019).
Figure 5 – Domestic electricity supply by source (Adapted from EPE, 2019).
In Brazil, the industrial, residential and commercial sectors accounted for more than 80% of the electricity spent in the country in 2018 (EPE, 2019) as shown in Figure 6. According to the National Energy Plan 2030 (Brasil, 2007), the energy consumption of buildings is projected to grow by 3.7% by the year 2030. It is understood, therefore, that the factors that influence the electricity consumption in buildings will play a key role in setting goals for the constructions field.
Figure 6 – Electricity consumption share by sector in Brazil (Adapted from EPE, 2019). 7,6% 2,5%1,9% 8,6% 3,7% 0,5% 8,5% 66,6% Wind Nuclear Oil Natural Gas Coal Solar Biomass Hydraulic 16,92% 5,91% 0,40% 5,61% 8,21% 37,53% 25,42% Commercial Energy Sector Transportation Agricultural Public Industrial Residential
Energy consumption in buildings in Brazil has grown rapidly, due in part to the increase in the comfort standards inside the buildings. Recent peaks in energy consumption alongside with high construction rates, highlight the urgency in energy efficiency increase since the constructions and systems now being installed will be consuming energy over the next few decades. In Brazil, the data available on energy consumption in buildings shows that for residential, commercial and public buildings air conditioning is the largest energy-consuming system (EPE, 2019) as shown in Figure 7.
Figure 7 – Electricity consumption share by sector in Brazil (Adapted from EPE, 2019).
Available data indicates how crucial it is to make clean and renewable sources of energy accessible and to use more widely passive and low-energy designs in building construction. The implementation of energy efficiency strategies in buildings not only decrease peak energy consumption but also minimise overall energy use and its impact on the environment (Kneifel,2010; Nikolaou et al., 2015).
Projecting a future scenario, National Energy Plan 2030 (MME & EPE 2007) predicts that, with energy efficiency actions, the trend of increasing demand for energy consumption in Brazil tends to stabilise. The National Energy Efficiency Plan 2030 (MME & EPE, 2011) estimates a potential for energy consumption reduction of approximately 30% with the implementation of energy efficiency actions in the lighting, and air conditioning systems and architectural intervention in the building sector. The following sections address how the indoor environmental quality and the energy performance of office buildings in Brazil, and related energy consumption and CO₂ emissions.
0% 10% 20% 30% 40% 50% 60% 70% 80% 90% 100%
Residential Commercial and Public
Freezer Refrigerator Shower Other Equipment Lighting Air Condictioning
2.4 Indoor Environmental Quality
Ensuring the comfort of the occupants is the main requirement for the indoor environment of a building. The lack of comfort conditions can be caused by several factors, like: temperatures, airspeed, high or low relative humidity, odour presence, insufficient or excessive lighting levels, unacceptable noise levels, the concentration of pollutants, microorganisms or dust suspended in the air and others. According to Loder and Zaplatosch (2018):
“Spending regular time in safe, natural areas is associated with a variety of benefits, including physical health, mental health, cognitive function, social-emotional function and additional personal benefits”.
Thermal and acoustic comfort, lighting and indoor air quality are the parameters that must be considered when assessing the IEQ. Several factors, including building location and geometry, materials used, air conditioning and ventilation systems, occupation and activities, impacts on the indoor environmental quality (Silva, 2009).
2.4.1 Thermal Comfort
For occupants to produce to their full capability, their workspace needs to be thermally comfortable. However, thermal comfort is based on the thermal adaptation of individual occupants which is correlated to factors such as geographic location and climate, time of year, gender, race, and age (Quang, Hea, Knibbs, Dear, & Morawska, 2014). Ensuring a thermal environment that satisfies all occupants is a difficult task since individual comfort preferences vary greatly depending on their particular acclimatisation to the local environment, on quantifiable physiological conditions (air temperature, humidity, airspeed, etc.), and non-quantifiable factors, personal variants, such as habits, mental state, education, metabolism, clothing, etc..
The human being has a thermoregulatory mechanism that allows the body to remain at a temperature, practically constant, around 36.5ºC to 37.0ºC, creating a thermal balance between man and the environment (Silva, 2009). Occupants' discomfort arises whenever the thermal balance between the human body and the environment is not stable, that is when there are differences between body and building temperature. According to the American Society of Heating, Refrigerating and Air-Conditioning
Engineers - ASHRAE 55: 2017 Standard, an individual is in thermal comfort when he has neither feeling hot nor cold (ASHRAE, 2017).
ASHRAE 55: 2017 suggest that, in naturally ventilated buildings, without heating and cooling systems, an environment can be said to achieve “reasonable comfort” when at least 80% of its occupants are thermally comfortable, for that the indoor comfort temperature (the operative temperature) will change according to the outside temperature, as shown on Figure 8 (ASHRAE, 2017).
Figure 8 – Acceptable operative temperature, to, ranges for naturally conditioned spaces (ASHRAE 55:2017).
For Rupp & Ghisi (2019), in the humid Brazilian subtropical climate, this broader range of adaptive temperature variation can be used to assess thermal comfort in office buildings with central air conditioning or during the operation of the air conditioning system in buildings with hybrid ventilation. Users have adapted to variations in internal temperature according to external temperatures (according to the theory of adaptive thermal comfort), mainly due to the adjustment of clothing, during the use of natural ventilation in buildings with hybrid ventilation. Therefore, the adaptive model can be used to assess thermal comfort in office buildings with hybrid ventilation during the operation of natural ventilation (the 90% range of acceptability showed results closer to the thermal acceptability of users).
Some aspects influence thermal comfort in buildings, such as the thermal resistance of the elements of the building envelope, thermal inertia, the solar factor of the glazing and characteristics of the shading system. Indoor temperatures are influenced by a few factors, including the building design, building orientation, occupation density, ventilation strategies, building structure (Bluyssen, 2009). Thermal comfort can be controlled via so-called heating, ventilating and air-conditioning systems (HVAC). Heating
can be provided through convection, conduction, radiation and air-conditioning systems (Bluyssen, 2009). Regulation of relative humidity can be provided through (de)humidification systems via an air conditioning system or locally. In addition, one can adjust one’s clothing and type of activities (Bluyssen, 2009).
Regarding the influence that uncomfortable temperatures can cause in the employees’ performance, it is known that if the indoor temperature is hot or cold will have different consequences. Workers efficiency can be reduced by up to 6% when offices are very hot and up to 4% when they are very cold (IEA & UN, 2017). Besides that, when indoor environments are too warm, there are evidence of increases in Sick Building Syndrome (SBS) symptoms, bad mood, increasing heart rate, respiratory symptoms, and feelings of fatigue (Bluyssen, 2009). Cold and dry environments have been found to facilitate the spread of the influenza virus because low humidity levels permit virus particles to stay in the air longer and humid environments are conducive to mould and fungal growth (Bluyssen, 2009).
The frequency and severity of heat events are rising significantly due to global climate change, making control of thermal parameters in buildings a critical public health issue (Bluyssen, 2009). In the construction sector, some aspects that influence thermal comfort, such as envelope thermal resistance, glazing solar factor and shading devices have the potential to mitigate heat exposure or exacerbate it. For example, in places with a cold climate, the façade of buildings should be well isolated to reduce heat loss to the outside.
The windows should be oriented to the north (in Southern Hemisphere) to, in the winter, take advantage of the solar radiation for indoor heating (Figure 9) (Moita, 2010). Changing the post-construction structure is considered inefficient and can become expensive. The building design and physical adaptation to achieve thermal comfort must be considered at the design stage (Jazizadeh, Ghahramani, Becerik-Gerber, Kichkaylo, & Orosz, 2014).
The diagram, in Figure 9, shows how the sun is lower in winter, while it is much higher in summer (Dornelles, 2008). During the day, the low winter sun can shine through the windows to allow thermal energy to be absorbed into the building's thermal mass (Dornelles, 2008). In order to reduce heat losses, in cold climates, it is recommended that the glass panes are doubled (double glazing) or even tripled (Sozer, 2010). An insulated window covering, or thick shade can also be used to help insulate the windows and help keep the heat in the building after the sun settles (Sozer, 2010).
Figure 9 – Influence of the solar orientation for the positioning of the building (Retrieved from Google images, 2020).
In the summer, as temperatures rise, a passive solar building uses its thermal mass to help keep the building cool (Dornelles, 2008). The summer sun’s path aides in this process by travelling high in the summer sky (Dornelles, 2008). Thus an overhang or another type of external shading system is needed to shade or cover the window, in the summer, so that the rays are blocked before entering the building when it is desired to have the building cooler than the outside temperature (Sozer, 2010).
2.4.2 Visual Comfort – Lighting Quality
Lighting has always been intuitively linked to well-being and health. The bright environments are considered more comfortable and healthier than dark ones (Santos, 2002). Lighting in spaces consists of two sources: daylight and artificial light. The quality of light in an indoor space is determined by the light source (natural and/or artificial), the distribution of the light in the space and how light is perceived (Santos, 2002).
Visual comfort is a condition of the lighting needs inside buildings. To ensure visual comfort is necessary to avoid excessive light and shadow differences (as they can disturb the visual performance of the occupants), correctly locate glazing and artificial light sources (to avoid glare). The amount of light provided must be adequate for visual tasks (Santos, 2002). Visual comfort at work has an impact on comfort after work as well. Some studies have looked at the impact of visual comfort on sleep quality at home after work. These studies have documented differences in impacts by gender, age, and seasons on the overall discomfort levels and effects on health. Several visual comfort criteria such as view type,
view quality and social density have an impact on the physical and psychological health of the occupants (Al horr et al., 2016).
Natural lighting is essential in buildings and offers several advantages: free and renewable energy source, have the amount of sunlight available and vary throughout the day and year. However, care must be taken regarding natural lighting so that it does not cause discomfort in those who will enjoy it and for doing this, it is necessary to avoid chaining and overheating the compartments. A solution to these drawbacks is the use of movable shading systems to protect inhabitants from unwanted solar radiation (Silva, 2009).
Comfortable light needs controllability and healthy light (day-night) and does not cause blinding through lighting systems or direct sunlight, or glare (e.g. from computer screens). Positioning and intensity of lighting systems, surface area treatment, solar screens and solar reflecting glazing are means to achieve this (Bluyssen, 2009). Open-plan offices have adverse effects on visual comfort which leads to a negative impact on occupant well-being. The geometry of windows, photometry of surfaces, amount of glazing etc., all have an impact on the illumination levels in a work area (Al horr et al., 2016).
Daylight exposure and access to windows at work have been linked to improved mood, reduced sleepiness, lower blood pressure and increased physical activity. In contrast, the lack of natural light has been associated with physiological, sleep, and depressive symptoms (Bluyssen, 2009). Preference for windows and therapeutic impact of natural views is well established in the literature (Al horr et al., 2016). The brightness influences occupant comfort by affecting their ability to perform certain types of tasks such as reading, writing and more (Bluyssen, 2009).
Office workers exposed to artificial and natural lighting conditions reported experiencing less glare and less sleepiness earlier in the day under natural light compared to when they were under artificial light (Bluyssen, 2009). Another beneficial aspect of natural light is related to circadian rhythms that are linked to the progress of the day and the night. A serotonin rule or “internal clock” of the human being works as a coordinator of all functions with a determined rhythm coinciding with a 24-hour cycle. In this way, sleep cycles are determined (Martins, 2010). However, to influence basic cognitive processes like attention, working memory and executive functions and learning and memory can be impaired when the sleep-wake cycle is disrupted (Martins, 2010).
Light flickering distracts people and can lead to physical complaints such as headaches (Bluyssen, 2009). Reflection, blinding, too little light and poor colouring of light can lead to the tiredness of the eye or adaptation problems, decreased alertness and poor concentration (Bluyssen, 2009).
The availability and quality of daylight can be improved by increasing (Baker & Steemers, 2002): • The openings size, making new ones or redistributing them;
• The windows transmittance, by reducing the obstruction due to frames or replacing the existing glazing with one with higher transmittances;
• The externally reflected component, treating nearby external surfaces with high-reflectance finishes;
• The internally reflected component, using internal room surfaces with high-reflectance finishes; • The penetration of light, using special elements such as light shelves or prismatic glazing.
Good lighting requires equal attention to the quantity and quality of lighting. Although enough lighting is required on the task level, in many cases visibility depends on the way the light is distributed, the characteristics and colour of the light source and surfaces, together with the level of brightness of the system. The recommended values, from the International (Organization for Standardization [ISO] 8995:2002), are considered to represent a reasonable balance, considering the requirements for safe, healthy and efficient work performance.
Natural light, complemented by artificial light, should provide a comfortable and luminous interior environment suitable for carrying out different visual tasks that take place inside the compartments. With automatic or manual dimming or intensifying of light, appropriate integration of artificial light and daylight can be achieved (Bluyssen, 2009).
2.4.3 Acoustic Quality
Acoustic comfort, like thermal comfort, is a subjective concept, primarily depending on the occupants, the materials used in the design of the building and the outdoor noise. Sometimes, a building can respect the regulatory requirements, however the occupants, due to their habits, their sensitivity, and other factors such as difficulty opening windows, due to the high sound levels coming from outdoors, can make the workers uncomfortable (Bluyssen, 2009). There is a direct relationship between acoustic comfort and occupant productivity in commercial buildings (Al horr et al., 2016). With the growth in open-plan
offices, issues of acoustic comfort and privacy have been identified as significant issues impacting on occupant productivity (Al horr et al., 2016).
Acoustic quality is considered a form of environmental pollution and the presence of background noise can be disruptive and interfere with an individual’s ability to communicate and perceive speech clearly at a normal speaking volume. Also, acoustic discomfort has a great influence on man and on his ability to concentrate, even becoming a strong motivator for action (Bluyssen, 2009).
Noise has unpleasant effects, both physiologically and psychologically, on the population. Workers, at office buildings, are susceptible to distractions from the noise while working. Noise exposure can increase accidents and impair employee performance and productivity, especially during difficult and complex tasks. Thus, good office acoustics is essential to the performance, productivity, health and well-being of the occupants (Bluyssen, 2009).
Acoustic problems emanate from airborne sounds, outdoor noise, noise from adjacent spaces, office equipment and from nearby facilities. Acoustic problems in offices could be divided into two major categories: annoyance from various noises and lack of communication privacy. The level, the spectrum, and the variation with time of the noise may influence the level of disturbance (Al horr et al., 2016). Noise from other people talking, telephones ringing, and other irregular sounds may create more annoyance and disturbance compared to the more continuous regular sounds (Al horr et al., 2016). To ensure that noise in a space is being controlled, some strategies can be used, such as the introduction of absorption materials, which decrease the sound pressure level and suppress echoes, in addition to reducing the reverberation time produced and also the volume (Bluyssen, 2009).
Several factors must be analysed to reduce noise inside buildings, such as the location and orientation of the building; the presence of textures in the surroundings, for example, vegetation; use of high mass walls; the use of double glazing with different glass thicknesses and high noise reduction rates; the use of acoustic absorbent materials (Silva, 2009). The reduction of noise entering a space can also be established by closing sound leaks, preventing or reducing contact sound transmission, and applying active (noise) control.
Sound insulation of the surface areas of the space is a material characteristic and determines the sound transfer between spaces. Absorbing materials can be categorized on the base of their absorption mechanism (Bluyssen, 2009):
• Porous materials: these are materials with an open structure. Larger pores (porosity) result in more of the wave remaining in the material. Examples of porous materials are glass fibre, soft polyurethane foam, or polyester and polyether-based (open-structure) material. These materials absorb mainly high-frequency sounds;
• Resonating panels: these are thin panels constructed on a layer of air (usually filled with mineral wool) before a hard wall. The panels absorb mainly low tones and can be compared to a mass-spring system. The system starts to resonate with its resonance frequency, and the sound is transferred to heat (and is, therefore, being absorbed). The result is a high absorbance with the resonance frequency. The frequency band at which absorption takes place can be increased by introducing mineral wool;
• Resonators and perforated panels: these panels make use of one of the oldest forms of sound absorption, using the resonance principle of Helmholz. An enclosed empty volume with air, connected via a small channel to the outside (comparable to the mass-spring system), resonates with a given frequency and energy will be absorbed through friction losses (damping) in or near the channel. This damping can be increased by introducing porous material behind the hole, which broadens the frequency area absorbed but lowers the absorption peak.
Green building guidelines have started including acoustic comfort as one of the criteria, but the overall priority for this is low. Leadership in Energy and Environmental Design (LEED), has included acoustic credits as an option. Still, a lot more need to be done to make it a mandatory element of sustainable construction orientation (Schiavon & Altomonte, 2014).
2.4.4 Indoor Air Quality
As people spend most of their time indoors today, the air must be pleasant and fresh so as not to impact people's health and well-being negatively. There are two main groups of pollutants, chemical and biological. Among the chemical pollutants, one can distinguish gases and vapours (inorganic and organic) and particulate matter. The biological pollutants consist of microbiological (dust) particles floating in the air that originate from viruses, bacteria, protozoa, mould, mites, insects, birds, mammals and pollen. Moulds can form aerosols through their spores (Bluyssen, 2009).
Common chemical indoor pollutants that pose risks to human health include nitrogen oxides (NOx), carbon monoxide (CO), carbon dioxide (CO2), ozone (O3), particulate matter (PM), and volatile organic compounds (VOCs) such as formaldehyde, limonene, and benzene. In offices, schools, and residential buildings, these pollutants may come from printers, pest and rodents, cleaning supplies, personal care products, paint, pollen, and fungal spores (Bluyssen, 2009).
Radiological hazards such as radon, a gas that naturally emanates from soil and rock and can enter buildings through cracks and fissures in the foundation, are carcinogens. The verification of this gas is not carried out so often in buildings since it has no smell or colour, there is no way to notice its presence without undergoing specific tests. Radon is considered the second leading cause of lung cancer behind smoking (Bluyssen, 2009).
The pollutants sources that directly or indirectly emit substances to indoor air are: • Outdoor sources (e.g. traffic and industry);
• Occupant-related activities and products (e.g. tobacco smoke; equipment: laser printers and other office equipment; consumer products: cleaning, hygiene, and personal care products);
• Building materials and furnishings: insulation, plywood, paint, furniture (particleboard), floor and wall coverings, etc.;
• Ventilation system components (e.g. filters, ducts, humidifiers).
Volatile organic compounds are a class of chemicals that are commonly associated with IAQ issues. Volatile Organic Compounds are chemicals with a high vapour pressure that emit gas into the air and can come from building materials, consumer products, paints, personal care products, furniture, and many other products (Bluyssen, 2009). Exposure to indoor air pollutants has been repeatedly linked to asthma, allergies, bronchitis, and chronic obstructive pulmonary disease.
The exposure to indoor air pollutants is influenced by indoor environmental parameters such as ventilation rate, air velocity, temperature, relative humidity, the activities taking place in the indoor environment resulting in introduction or removal of the same or other pollutants, and the time (age of product) and duration of the exposure (Bluyssen, 2009).
From HVAC system, the indoor air pollutants can be emitted by different sources (Bluyssen, 2009):
• Air filters: both new and used filters pollute the air. Due to their constituent material, new filters emit VOCs;