July 15, 2020 1
TECHNICAL COMMENT
2
Selection on structural allelic variation biases plasticity
3
estimates
4 5
Mauro Santos,1,2 Margarida Matos,3 Sheng Pei Wang,4 and David M. Althoff4,5
6 7
1Departament de Genètica i de Microbiologia, Grup de Genòmica, Bioinformàtica i
8
Biologia Evolutiva (GGBE), Universitat Autònoma de Barcelona, 08193 Bellaterra, 9
Barcelona, Spain 10
2E-mail: [email protected]
11
3cE3c—Centre for Ecology, Evolution and Environmental Changes, Faculdade de
12
Ciências, Universidade de Lisboa, Campo Grande, 1749-016 Lisboa, Portugal 13
4Department of Biology, Syracuse University, Syracuse, NY13244 E
14
5Archbold Biological Station, Venus, FL 33960
15 16
Running title
: Plasticity of ADH activity 17Word count: 2,832 (excluding references) 18
19
Accepted for publication in the journal Evolution. The final authenticated version is available 20
online at: https://doi.org/10.1111/evo.13723 21
Citation: Santos, M., Matos, M., Wang, S. P. & Althoff, D. M. 2019. Selection on structural 22
allelic variation biases plasticity estimates. Evolution 73(5): 1057-1062. Doi: 23 https://doi.org/10.1111/evo.13723. 24 25
Acknowledgements
26We thank Prof. Mohamed Noor for encouraging us to find a general agreement on the subject. 27
The manuscript benefited from comments and suggestions from M. Noor and R. Fuller. M.S. is 28
funded by grant CGL2017-89160-P from the Ministerio de Economía, Industria y 29
Competitividad (Spain), and Grant 2017 SGR 01379 from Generalitat de Catalunya. M.M. is 30
funded by cE3c Unit FCT UID/BIA/00329/2013. S.W. is funded by Sigma Xi. D.M.A is funded 31
by grants NSF 1556568 and 1655544. 32
TECHNICAL COMMENT
34
Selection on structural allelic variation biases plasticity
35
estimates
36 37Abstract
38Wang and Althoff (2019) explored the capacity of Drosophila melanogaster to exhibit 39
adaptive plasticity in a novel environment. In a full-sib, half-sib design, they scored the 40
activity of the enzyme alcohol dehydrogenase (ADH) and plastic responses, measured 41
as changes in ADH activity across ethanol concentrations in the range 0-10% (natural 42
variation) and 16% (the novel environment).ADH activity increased with alcohol 43
concentration, and there was a positive association between larval viability and ADH 44
activity in the novel environment. They also reported that families exhibiting greater 45
plasticity had higher larval survival in the novel environment, concluding that ADH 46
plasticity is adaptive. However, the four authors now concur that, since the study 47
estimated plasticity from phenotypic differences across environments using full-sib 48
families, it is not possible to disentangle the contributions of allele frequency changes at 49
the Adh locus from regulatory control at loci known to influence ADH activity. 50
Selective changes in allele frequencies may thus conflate estimates of plasticity; any 51
type of “plasticity” (adaptive, neutral, or mal-adaptive) could be inferred depending on 52
allele frequencies. The problem of scoring sib-groups after selection should be 53
considered in any plasticity study that cannot use replicated genotypes. Researchers 54
should monitor changes in allele frequencies as one mechanism to deal with this issue. 55
56
Key words: Phenotypic plasticity, Drosophila, Ethanol, Adh polymorphism. 57
Wang and Althoff (2019) recently presented a study to test whether, as mentioned in the 59
literature (e.g. Coulautti et al. 2017), plasticity might facilitate the colonization of novel 60
environments. They analyzed, through a nested full-sib, half-sib mating design (Lynch 61
and Walsh 1998, pp. 570-573), both the mean larvae survival and changes in expression 62
of alcohol dehydrogenase (ADH) of Drosophila melanogaster families as a function of 63
increased concentrations of ethanol. The final goal was to search for an association 64
between a plastic response, measured as changes in ADH expression across ethanol 65
concentrations, and the concomitant adaptive value measured as larval survival at 66
higher concentrations. Can larvae of this species adapt to a novel environment up to a 67
concentration of 16% ethanol? This concentration is unlikely to be found in natural 68
larval substrates, where flies feed and breed on fermenting fruits containing ethanol in 69
concentrations as high as 6-7% (Fry 2014; Zhu and Fry 2015). The scored phenotype in 70
Wang and Althoff (2019) was the activity of the enzyme alcohol dehydrogenase (ADH: 71
NAD+ oxidoreductase: EC 1.1.1.1.), which plays a key role in the ability of D. 72
melanogaster to exploit alcoholic environments. They also estimated plasticity from the 73
phenotypic difference across environments in ADH activity using the means of full-sib 74
families in each environment. 75
The authors found a substantial increase in third-instar larvae ADH activity in 76
response to increased alcohol concentrations in the food from 0% to 10%, which were 77
taken as to be representative of the range of natural variation; and also in a 78
concentration of 16%, which was assumed to be the novel alcohol environment. They 79
also found a concomitant decrease in egg to third-instar larvae viability, which dropped 80
to 0.71 (10% alcohol) and 0.24 (16% alcohol) relative to the viability in the control (0% 81
alcohol) environment. Increased ADH activity in the novel 16% environment was 82
positively selected, as well as ADH plasticity between 10% to 16% alcohol (with fitness 83
measured as larval survival). Heritable variation for both ADH activity and ADH 84
plasticity were high, with narrow-sense heritabilities h =2 0.557and h =2 0.776,
85
respectively. From these results, Wang and Althoff (2019) concluded that ADH 86
plasticity is an adaptive trait, which is an important finding because adaptive trait 87
plasticity is uncommon (Scheiner 2018). 88
The standard definition of phenotypic plasticity is the change in the expressed 89
phenotype of a genotype as a function of the environment. However, Wang and Althoff 90
(2019) estimated ADH plasticity from the phenotypic difference across environments in 91
ADH activity using full-sib families as a surrogate of replicated genotypes and, 92
therefore, a key question arises: what was the underlying genetic basis of the phenotypic 93
response to increased alcohol concentrations in their experiments? This goes back to the 94
question (Schlichting and Pigliucci 1993): what is the form of genetic control of 95
phenotypic plasticity? In D. melanogaster the Adh locus is polymorphic for two 96
common alleles labelled F
Adh (Adh-fast) and S
Adh (Adh-slow) on the basis of allozyme 97
electrophoretic mobility. The AdhF allele is generally associated with higher ADH
98
activity than the AdhSallele, and this activity difference is partly due to a catalytic
99
efficiency difference and partly due to protein quantity that is not mirrored in RNA 100
level (McDonald et al. 1980; Laurie and Stam 1988, Laurie et al. 1991). The rank order 101
of maximum ADH activity is ADH-FF > ADH-FS > ADH-SS, with fast homozygotes 102
generally having a two- to three-fold higher activity than slow homozygotes (Middleton 103
and Kacser 1983; Laurie et al. 1991). Therefore, although there are many cis- and trans-104
acting genetic factors affecting ADH activity (e.g.; Laurie-Ahlberg et al. 1980; Maroni 105
et al. 1982; Corbin and Maniatis 1990), a large part of the genetic variation in ADH 106
activity is structural and associated with the Adh protein polymorphism. Most 107
importantly, a number of laboratories have reported thatAdhF genotypes tend to survive
108
better in alcohol stress environments than their S
Adh counterparts both at the adult (e.g., 109
Briscoe et al. 1975; Anderson et al. 1981; Kerver and van Delden 1985) and larvae 110
stages (e.g., Morgan 1975; Kerver and van Delden 1985; Heinstra et al. 1987). This 111
means that there is potentially – likely – a role for selective response in polymorphic 112
populations even in a single generation of ethanol stress. 113
Wang and Althoff’s (2019) experimental flies originated from a natural 114
population collected in Syracuse (NY, USA) where AdhF
and AdhS
alleles had been 115
reported to segregate at approximately intermediate frequencies (Berger 1971). 116
However, they did not score the Adh enzyme polymorphism in the experimental flies 117
and, consequently, we cannot know to what degree the increased levels of ADH activity 118
in their 16% alcohol environment was due to allelic frequency changes (associated to 119
larval mortality) at the target Adh locus and/or to regulatory control associated to 120
genetic variability at other loci. The former will be an evolutionary response, while only 121
the latter can be correctly a plasticity change– meaning different phenotypic values for 122
the same genotype across environments (Ghalambor et al. 2015). 123
We concur with Schlichting and Pigliucci (1993) in defining plasticity genes as 124
“regulatory loci that exert environmentally dependent control over structural gene 125
expression and thus produce a plastic response”. Along this line, selection on standing 126
structural genetic variation at the Adh locus adjusting the trait means to a new optimum 127
should be distinguished from the modification of ADH activity through gene expression 128
change, which would be selection for plasticity per se (Schlichting and Pigliucci 1993). 129
Signs of such plasticity are known to affect ADH. Both the second and the third 130
chromosomes are known to contain regulatory regions that affect larval ADH activity 131
(Maroni et al. 1982; Corbin and Maniatis 1990). Furthermore, both SS
Adh and FF
Adh 132
homozygous larvae are plastic in their ADH activity in response to alcohol, and their 133
plasticity can vary depending on the genetic background (Malherbe et al. 2005). Wang 134
and Althoff’s (2019) data do suggest that other loci besides Adh structural allelic 135
variants are involved in regulating both ADH activity and ADH plasticity because they 136
observed substantial ADH plasticity between the 0% to 10% alcohol environments, 137
where larval mortality was uncorrelated to ADH activity. However, all the authors of 138
this consensus think that the positive association of ADH plasticity with survival 139
between the 10% to 16% alcohol environments, where higher ADH activity increased 140
larval survival, could have been biased by frequency changes at the Adh locus. In what 141
follows, we describe the sort of bias that might occur when F
Adh and S
Adh alleles are 142
segregating in sib-groups. 143
144
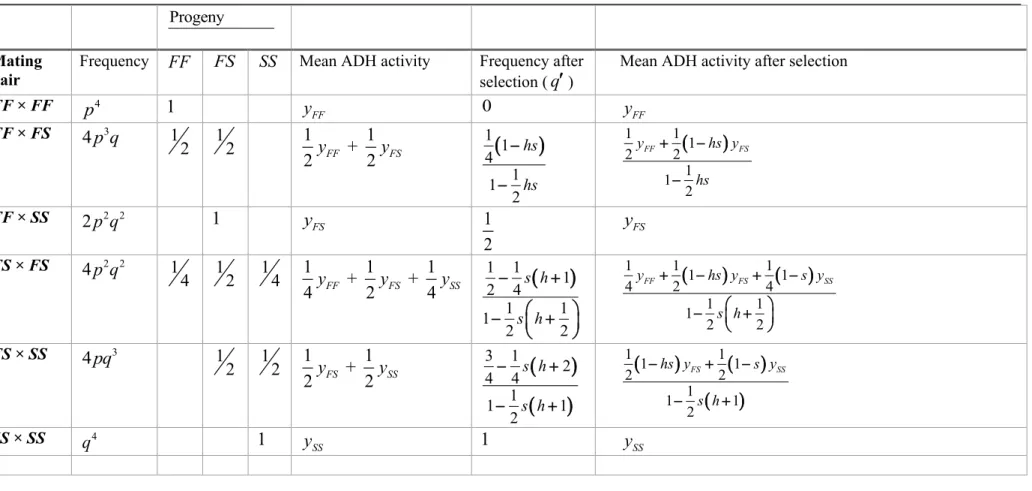
PROBLEMS OF USING SIB-GROUPS AS SURROGATES OF
145REPLICATED GENOTYPES
146Table 1 gives the genetic composition of the various sib-groups for the locus Adh 147
(assuming random mating) when segregating for the two common alleles Adh (F) and F
148
S
Adh (S). Let us assume that we perform an experiment using two environments 149
(treatments): environment 1 is “non-selective” and environment 2 is “selective”. Non-150
selective here means that any mortality is random with respect to ADH activity (i.e., 151
Adh genotype). This could represent the 0% or 10% alcohol environments in Wang and 152
Althoff (2019) because they did not detect ADH activity to have any effect on egg to 153
third-instar larvae viability in the 10% alcohol environment despite average viability 154
dropping to 0.71 relative to the control (0% ethanol). The selective environment means 155
that there is also mortality with respect to ADH activity (Adh genotype) and represents 156
their 16% alcohol environment. Given the genotype-dependent rank order of ADH 157
activity (yFF yFS ySS; see above), Table 1 assumes that the relative fitness of 158
genotypes FF, FS, and SS are 1, 1−hs, and 1− , respectively, in the selective (high s 159
alcohol concentration) environment; where s is a positive constant
(
0 and h s 1)
160(
0 is the degree of dominance (see, e.g., Crow and Kimura 1970, p. 183). The h 1)
161
last column in Table 1 gives the change in ADH activity after selection in the different 162
sib-groups. 163
To numerically illustrate how selection on ADH activity through changes in Adh 164
allele frequencies would change the slope across environments in the sib-groups, 165
assume we perform the following full-sib, half-sib experiment along the lines of Wang 166
and Althoff (2019). A total of 200 sires are crossed to 3 dams each, and six vials for 167
each sire × dam cross are set up with 50 eggs each (to have an accurate representation of 168
genotypes in the offspring). Three vials are allocated to treatment 1 (non-selective 169
environment) and the other three to treatment 2 (selective environment). In treatment 1, 170
egg to third-instar larvae viability is, e.g., 0.85 and mortality is random regarding Adh 171
genotype. In treatment 2, egg to third-instar larvae viability further decreases as a 172
function of the genotype composition in the sib-groups and viability selection for the 173
Adh locus. Assuming higher or lower random mortality would obviously not change the 174
conclusions. Simulation programs were implemented in MATLAB (version R2016b) 175
algebra environment using tools supplied by the Statistics Toolbox (MATLAB and 176
Statistics Toolbox Release 2016). The routine to run the analyses is provided in the 177
Supporting Information. 178
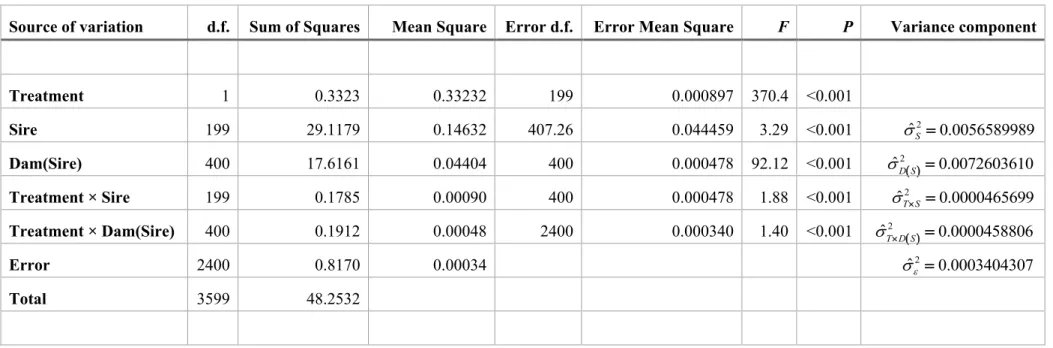
Because the simulated data was a fully balanced design, variance component 179
estimations were made by conventional least-squares (ANOVA) methods and are also 180
restricted maximum likelihood (REML) solutions (Searle et al. 1992). The following 181
linear model was used: 182
( ) ( ) ,
ijkl i j k j ij ik j ijkl
y = + + T S +D +TS +TD + 183
where is the overall grand mean, y is the average ADH activity in the ijkl i th 184
(
i =1, 2)
treatment, estimated from the surviving offspring in the l th(
l =1, 2, 3)
vial 185from the kth
(
k =1, 2, 3)
dam (nested in sire) mated to sire i i =(
1, 2, , 200)
, and 186ijkl
is the residual error. Treatment was a fixed effect; whereas sire, dam, treatment × 187
sire, and treatment × dam(sire) were treated as random effects. 188
Table 2 gives the results from some simulated data. We have assumed 189
0.80 FF
y = , y =FS 0.56 and y =SS 0.32; i.e., a two- to three-fold higher activity in fast 190
homozygotes in comparison with slow homozygotes (see above). The frequency of 191
allele Adh was assumed to be 0.5, the selective coefficient F s =0.5 and the degree of
192
dominance h =0.4. This strong selective coefficient might not be unreasonable in the 193
16% alcohol environment used by Wang and Althoff (2019) because in this 194
environment viability dropped to 0.34 relative to the viability in the 10% alcohol 195
environment. [Note that for simplicity we ignore here any variation in ADH activity 196
within Adh structural genotypes, which is known to exist (e.g., Laurie et al. 1991).] 197
From Table 2, it is clear that the selective environment had a highly significant 198
effect on average ADH activity, and that there was a highly significant treatment × 199
dam(sire) interaction effect, which means that changes in ADH activity across 200
environments [i.e., reaction norms between 10% to 16% alcohol concentration in Fig. 2 201
of Wang and Althoff (2019)] in the full-sib families were not parallel. Also as expected, 202
there was no correlation between ADH activity and viability in treatment 1 (non-203
(selective environment; Pearson correlation r=0.9893, d.f. = 1798, P0.001). The 205
conclusions remain qualitatively the same if we assume that the frequency of Adh is F
206
in the range 0.3 0.7− (results not shown), which is a reasonable assumption from Fig. 207
1a in Berger (1971). 208
The correlation between ADH “plasticity” (that is, the change in ADH activity 209
of full-sib families between environments) and larval viability in the selective 210
environment was slightly negative and non-significant (Pearson correlation 211
0.0125, d.f. = 1798, 0.596
r = − P= ), which would suggest neutral ADH plasticity
212
when the frequency of Adh equals 0.5. Importantly, from Table 1 it can be F
213
appreciated that this correlation will depend on allele frequencies (as well as on relative 214
fitness). Fig. 1 shows a plot of the correlation between ADH plasticity and larval 215
viability in the selective environment, as a function of the frequency of allele Adh . If F
216
the frequency of Adh is in the range F 0.30 0.45− , then this correlation is positive and
217
can be highly significant (e.g., r=0.2734, d.f. = 1798, P0.001 in a representative 218
simulation with allele frequency 0.3), which would lead to a misleading suggestion of 219
adaptive ADH “plasticity”. On the other hand, if the frequency of Adh is in the range F
220
0.55 0.70− , then the correlation is negative (e.g., r= −0.1990, d.f. = 1798, P0.001 221
assuming an allele frequency of 0.7) and would suggest mal-adaptive ADH “plasticity”. 222
The reason for this behavior is that below a frequency of 0.5 there will be a relatively 223
high abundance of sib-groups fixed and/or segregating for the low fitness 224
alleleAdh that experiences strong viability selection, and the opposite happens when S
225
the frequency of Adh is above 0.5. To sum up, any type of “plasticity” (adaptive, F
226
neutral, or mal-adaptive) could thus be obtained and, therefore, we can only speculate 227
about the direction of the bias. 228
Given the above analyses, the four authors concur that changes in ADH activity 229
between environments due to selection on the polymorphic Adh locus may conflate 230
estimates of plasticity, as well as its adaptive value 231
232
SUMMARY
233We have explained a source of bias that can arise when sib-groups are used as
234
surrogates of replicated genotypes. Interestingly, a recent preprint by Signor and 235
Nuzhdin (2018) has also analyzed plastic responses to high ethanol concentration in D. 236
melanogaster and D. simulans. Their experimental flies were the F1 offspring obtained 237
by crossing six isogenic male genotypes of each species derived from nature with 238
females from tester stocks. This protocol allowed replicated observations of gene 239
expression in identical twin flies. Adult flies were exposed to 15% ethanol and the 240
results pointed to a lack of genetic variation for plasticity in D. melanogaster. These 241
results suggest a different role of ADH plasticity than suggested by Wang and Althoff 242
(2019). 243
However, aside from methodological differences between the two studies, there 244
are additional differences to consider. The use of adults (Signor and Nuzhdin 2018) vs. 245
larvae (Wang and Althoff 2019) is important for interpreting the results, because the 246
regulation of ADH expression is known to be under separate genetic control in these 247
two life stages (Posakony et al. 1985). Additionally, Wang and Althoff (2019) 248
quantified ADH activity rather than overall gene expression changes, and the fitness 249
effect of the latter is much less clear than the former. Furthermore, we do not think that 250
a lack of significant genes for interaction variance in response to alcohol in Signor and 251
Nuzhdin (2018) is sufficient reason to suggest that there is no genetic variation in ADH 252
In summary, the four authors agree that the problem of selection on structural 254
allelic variation is sensible and should be considered in any plasticity study that cannot 255
use replicated genotypes. For circumstances in which plasticity has a direct relationship 256
to fitness, shifts in alleles at structural loci due to a selective environment will likely 257
influence the phenotypic value of a trait in a novel environment and conflate estimates 258
of plasticity. The magnitude of this effect is determined by the strength of selection and 259
the degree of correlation between the phenotypic values in the non-selective and 260
selective environments. If selection is strong and the correlation between trait values in 261
the non-selective and selective environments is high, this would suggest that plasticity 262
measures may be biased by shifts in allele frequencies. 263
In other cases, in which the link between plasticity and fitness is more tenuous, 264
shifts in alleles at the locus under study will likely be much smaller or not occur at all. 265
Moreover, here we highlight a case in which there is a structural locus of major effect 266
with just two alleles. Additional analyses for more quantitative traits are needed to 267
better understand if such a bias would occur as well. Thus, researchers need to consider 268
not only the genetics of the trait under study, but also how selection may cause shifts in 269
allele frequencies that contribute to changes in phenotypic values. Ideally, monitoring 270
changes in allele frequencies and an understanding of the contribution of how such 271
changes influence the trait value would provide a means to correct for allelic shifts and 272
produce better estimates of truly plastic responses. Accomplishing this will be a 273
difficult and laborious task, even in model organisms, but one that will lead to better 274
understanding of the role of plasticity in novel environments. When this is not possible 275
researchers needs to acknowledge that plasticity estimates may be biased. 276
277
References
Anderson, S. M., J. F. McDonald, and M. Santos. 1981. Selection at the Adh locus in 279
Drosophila melanogaster: Adult survivorship mortality in response to ethanol. 280
Experientia 37:463-464 281
Berger, E. M. 1971. A temporal survey of allelic variation in natural and laboratory 282
populations of Drosophila melanogaster. Genetics 67:121-136. 283
Briscoe, D., A. Robertson, and J.-M. Malpica. 1975. Dominance at Adh locus in 284
response of adult Drosophila melanogaster to environmental alcohol. Nature 285
253:148-194. 286
Colautti, R. I., J. M. Alexander, K. M. Dlugosch, S. R. Keller, and S. E. Sultan. 2017. 287
Invasions and extinctions through the looking glass of evolutionary ecology. Phil. 288
Trans. R. Soc. B 372:20160031. 289
Corbin, V., and T. Maniatis. 1990. Identification of cis-regulatory elements required for 290
larval expression of the Drosophila melanogaster alcohol dehydrogenase gene. 291
Genetics 124:637-646. 292
Crow, J. F., and M. Kimura. 1970. An introduction to population genetics theory. 293
Harper and Row, New York. 294
Fry, J. D. 2014. Mechanisms of naturally evolved ethanol resistance in Drosophila 295
melanogaster. J. Exp. Biol. 217:3996–4003. 296
Ghalambor, C. K., K. L. Hoke, E. W. Ruell, E. K. Fischer, D. N. Reznick, and K. A. 297
Hughes. 2015. Non-adaptive plasticity potentiates rapid adaptive evolution of gene 298
expression in nature. Nature 525:372-375. 299
Graybill, F. A., and W. H. Robertson. 1957. Calculating confidence intervals for genetic 300
heritability. Poultry Science 36:261–265. 301
Heinstra, P. W. H., W. Scharloo, and G. E. W. Thörig. 1987. Physiological significance 302
of the alcohol dehydrogenase polymorphism in larvae of Drosophila. Genetics 303
117:75-84. 304
Kerver, J. W. M., and W. van Delden. 1985. Development of tolerance to ethanol in 305
relation to the alcohol dehydrogenase locus in Drosophila melanogaster. 1. Adult 306
and egg-to-adult survival in relation to ADH activity. Heredity 55:355-367. 307
Laurie, C. C., J. T. Bridgham, and M. Choudhary. 1991. Associations between DNA 308
sequence variation and variation in expression of the Adh gene in natural 309
populations of Drosophila melanogaster. Genetics 129:489-499. 310
Laurie, C. C., and L. F. Stam. 1988. Quantitative analysis of RNA produced by Slow 311
and Fast alleles of Adh in Drosophila melanogaster. Proc. Natl. Acad. Sci. USA 85: 312
5161–5165. 313
Laurie-Ahlberg, C. C., G. Maroni, G. C. Bewley, J. C. Lucchesi, and B. S. Weir. 1980. 314
Quantitative genetic variation of enzyme activities in natural populations of 315
Drosophila melanogaster. Proc. Natl. Acad. Sci. USA 77:1073-1077. 316
Lynch, M. and B. Walsh. 1998 Genetics and analysis of quantitative traits. Sinauer, 317
Sunderland. 318
Malherbe, Y., A. Kamping, W. van Delden, and L. van de Zande. 2005. ADH enzyme 319
activity and Adh gene expression in Drosophila melanogaster lines differentially 320
selected for increased alcohol tolerance. J. Evol. Biol. 18:811-819. 321
Maroni, G., C. C. Laurie-Ahlberg, D. A. Adams, and A. N. Wilton. 1982. Genetic 322
variation in the expression of ADH in Drosophila melanogaster. Genetics 101:431-323
446. 324
MATLAB and Statistics Toolbox Release. 2016. The MathWorks, Inc., Natick, MA. 325
McDonald, J. F., S. M. Anderson, and M. Santos. 1980. Biochemical differences 326
between products of the Adh locus in Drosophila. Genetics 95:1013-1022. 327
Middleton, R. J., and H. Kacser. 1983. Enzyme variation. Metabolic flux and fitness: 328
alcohol dehydrogenase in Drosophila melanogaster. Genetics 105:633-650. 329
Morgan, P. 1975. Selection acting directly on an enzyme polymorphism. Heredity 34: 330
124- 127. 331
Posakony, J. W., J. A. Fischer, and T. Maniatis. 1985. Identification of DNA
332
sequences required for the regulation of Drosophila alcohol dehydrogenase gene
333
expression. Cold Spring Harb. Symp. quant. Biol. 50:515–520. 334
Scheiner, S. M. (2018). The genetics of phenotypic plasticity. XVI. Interactions among 335
traits and the flow of information. Evolution 72:2292-2307. 336
Schlichting, C. D., and M. Pigliucci. 1993. Control of phenotypic plasticity via 337
regulatory genes. Am. Nat. 142:366-370. 338
Searle, S.R., G. Casella, and C. E. McCulloch. 1992. Variance components. John Wiley 339
& Sons, New York. 340
Signor, S. A., and S. V. Nuzhdin. 2018. Evolution of phenotypic plasticity in response 341
to ethanol between sister species with different ecological histories (Drosophila 342
melanogaster and D. simulans). bioRxiv doi: http://dx.doi.org/10.1101/386334. 343
Wang, S. P., and D. M. Althoff. 2019. Phenotypic plasticity facilitates initial 344
colonization of a novel environment. Evolution 73:303-316. 345
Zhu, J., and J. D. Fry. 2015. Preference for ethanol in feeding and oviposition in 346
temperate and tropical populations of Drosophila melanogaster. Entomol. Exp. 347
Appl. 155:64-70. 348
Figure legends 351
352
Fig. 1. Correlations between ADH plasticity and larval viability in the selective 353
environment, as a function of the frequency of allele Adh . The selection coefficient (s) F
354
and the degree of dominance (h) used in the simulation are given in the upper right of 355
the graph. Each dot is the correlation estimated from simulations assuming a total of 356
200 sires crossed to 3 dams each, with three vials set up with 50 eggs each in each 357
environment (non-selective and selective). The horizontal bar gives the likely range of 358
the frequency of allele Adh in the Syracuse (NY, USA) population sampled by Wang F
359
and Althoff (2019). (See Fig. 1a in Berger 1971.) 360
Table 1.Expected frequencies and distribution of genotypes in sib-groups, and recursion equations for a locus with two alleles − Adh FF
( )
and Adh S −S( )
in arandom mating population under selection in a stressful environment. The phenotype is the alcohol dehydrogenase (ADH) activity
(
yFF, yFS, and ySS)
. The relativefitness of genotypes FF, FS and SS are 1, 1−hs, and 1− , respectively, where s s
(
0 s 1)
is the selection differential and h(
0 h 1)
is the degree of dominance.Progeny
Mating pair
Frequency FF FS SS Mean ADH activity Frequency after selection (q)
Mean ADH activity after selection
FF × FF p4 1 FF y 0 yFF FF × FS 4 p q3 1 2 12 1 + 1 2 yFF 2 yFS
(
)
1 1 4 1 1 2 hs hs − − ( ) 1 1 1 2 2 1 1 2 FF FS y hs y hs + − − FF × SS 2 p q2 2 1 FS y 1 2 yFS FS × FS 4 p q2 2 1 4 12 14 1 + 1 + 1 4yFF 2yFS 4ySS(
)
1 1 1 2 4 1 1 1 2 2 s h s h − + − + ( ) ( ) 1 1 1 1 1 4 2 4 1 1 1 2 2 FF FS SS y hs y s y s h + − + − − + FS × SS 4pq3 1 2 12 1 + 1 2 yFS 2 ySS(
)
(
)
3 1 2 4 4 1 1 1 2 s h s h − + − + ( ) ( ) ( ) 1 1 1 1 2 2 1 1 1 2 FS SS hs y s y s h − + − − + SS × SS q4 1 SS y 1 ySSTable 2. Analysis of variance for ADH activity in the simulated full-sib, half-sib experiment, with full-sib families raised in two treatment environments (“non-selective” and “selective”).
Source of variation d.f. Sum of Squares Mean Square Error d.f. Error Mean Square F P Variance component
Treatment 1 0.3323 0.33232 199 0.000897 370.4 <0.001 Sire 199 29.1179 0.14632 407.26 0.044459 3.29 <0.001 ˆ2 0.0056589989 S = Dam(Sire) 400 17.6161 0.04404 400 0.000478 92.12 <0.001 ˆ2( ) 0.0072603610 D S = Treatment × Sire 199 0.1785 0.00090 400 0.000478 1.88 <0.001 ˆ2 0.0000465699 T S = Treatment × Dam(Sire) 400 0.1912 0.00048 2400 0.000340 1.40 <0.001 ˆ2 ( ) 0.0000458806 T D S = Error 2400 0.8170 0.00034 ˆ2 0.0003404307 = Total 3599 48.2532