Periódico Trimestral, digital e gratuito publicado pela Academia Brasileira de Ciências Contábeis
ISSN 1981-8610 REPeC, Brasília, v. 13, n. 2, art. 5, p. 192-212, Apr./Jun. 2019
Available online at www.repec.org.br DOI: http://dx.doi.org/10.17524/repec.v13i2.2002
Abstract
Objective: The study analyzes the influence of managerial
ability on the existence and magnitude of goodwill
impairment losses in publicly-held companies listed on B3.
Method: Descriptive, documentary and quantitative
research, using data collected in the database Economática, management reports and notes to the financial statements. The sample consisted of 148 observations. Information for the period from 2012 till 2016 was analyzed.
Results: Of all companies with goodwill, 10.81% accounted
for losses. The largest number of companies that accounted for losses was found in the “petroleum, natural gas and biofuels” sector. As for the magnitude of the losses, the highest mean value was found in the “basic materials” sector, followed by “information technology” and “petroleum, natural gas and biofuels”. Company managers from the “non-cyclical consumption” sector revealed higher managerial ability, followed by the managers from the “health” and “cyclical consumption” sectors. More skilled managers can avoid and reduce losses of goodwill.
Contributions: The Recoverability test is a relevant issue
when discussing aspects of information quality in the financial statements and a procedure of interest to the stakeholders, as it affects the future cash flow production. Therefore, the research is relevant by providing new evidence of factors that can interfere in the recognition and magnitude of losses in the Brazilian scenario.
Key words: Managerial ability; Impairment loss of goodwill;
Publicly-held companies.
Geovanne Dias De Moura
Orcid: https://orcid.org/0000-0003-0900-5249 E-mail: [email protected]
Denise Rose Bracht Fank
Orcid: https://orcid.org/0000-0003-3484-6840 E-mail: [email protected] Sady Mazzioni Orcid: https://orcid.org/0000-0002-8976-6699 E-mail: [email protected] Rodrigo Angonese Orcid: https://orcid.org/0000-0002-0854-9925 E-mail: [email protected] Givanildo Silva Orcid: https://orcid.org/0000-0002-9328-1563 E-mail: [email protected]
Managerial ability and goodwill impairment losses:
analysis in publicly-held companies listed on B3
1. Introduction
In response to the globalization of international trade, a growing number of countries, including Brazil, have adopted the International Financial Reporting Standards (IFRS) of the International Account-ing Standards Board (IASB) (Martins & Paulo, 2010). In Brazil, among the several changes in accountAccount-ing, we highlight the impairment of assets, or Impairment test, which is dealt with in Accounting Pronounce-ment Committee CPC 01 (R1, 2010).
The recognition of the impairment of an asset represents an economic loss, that is, a decrease in the future economic benefits that are expected from the use or sale of this asset (CPC 01, R1, 2010). In this sense, the objective of companies and managers is to reduce or avoid possible impairment, as a loss indi-cates a decline in the performance of the asset, which will consequently result in a decline in the compa-ny’s overall performance (Li, Shroff, Venkataraman & Zhang, 2011; Sun, 2016). Thus, CPC 01 (R1, 2010) establishes the procedures the entity is to apply to ensure that its assets are recorded at a book value that does not exceed the recoverable values.
Among the company assets, goodwill, because of its complexity, has attracted the attention of aca-demics and practitioners in relation to its impairment (Wen & Moehrle, 2016). Goodwill in the account-ing context represents amounts paid in excess, that is, it is an incremental amount paid by one company in the acquisition of another. This incremental value is paid in order to obtain abnormal returns on in-vestments in the future (Kabir & Rahman, 2016).
Over the years, the global economy has developed a number of technological innovations and ad-vances in knowledge, and goodwill is directly related to these aspects, as it encompasses intangible invest-ments such as human resources, new technologies, research and development and advertising (Kabir & Rahman, Wen & Moehrle, 2016). At the time of an acquisition, these assets are difficult to identify and are therefore called goodwill. They can only be recognized by accounting when acquired through a business combination, when the cost will be measured safely, as determined by CPC 04 (2008).
In view of its relevance, several researchers have sought to identify factors that may influence the existence or otherwise of impairment and the impairment value of goodwill. Several authors divide these factors, including Avallone and Quagli (2015), Majid (2015), Kabir and Rahman (2016) and Vogt, Pletsch, Morás and Klann (2016), between indicators of the company’s economic performance and management incentive factors.
The main indicators of the company’s economic performance that can influence the recognition of losses are: sales growth (Duh, Lee & Lin, 2009; Majid, 2015; Kabir & Rahman, 2016; Vogt, Pletsch, Morás & Klann, 2016); variation in the operating cash flow (Majid, 2015; Kabir & Rahman, 2016; Vogt et al., 2016); company performance (Avallone & Quagli, 2015; Majid, 2015; Kabir & Rahman, 2016; Vogt et al., 2016); market value (Zhang & Zhang, 2007; Kabir & Rahman, 2016; Vogt et al., 2016).
The main management incentive factors that can influence the recognition of losses are: company indebtedness (Kabir & Rahman, 2016, Avallone & Quagli, 2015, Majid, 2015, Vogt et al., 2016); company size (Avallone & Quagli, 2015; Kabir & Rahman, 2016); performance and tenure of the CEO (Avallone & Quagli, 2015; Majid, 2015; Kabir & Rahman, 2016; Vogt et al., 2016).
Another possible influential factor is management skill. According to authors like Demerjian, Lev, Lewis and McVay (2013), Chen, Podolski and Veeraraghavan (2015), Jiraporn, Leelalai and Tong (2016), Demerjian, Lewis-Western and McVay (2017) and Huang and Sun 2017), managerial ability is directly related to the ability of a manager to transform corporate resources into revenue.
In this case, savvy managers can anticipate business opportunities, make better decisions, and bet-ter manage companies and their assets to maximize shareholder benefits compared to less capable man-agers. Thus, more skillful managers can reduce or even avoid losses (Demerjian, Lev & Mcvay, 2012, Sun, 2016). This is an issue that still needs to be investigated in Brazil though.
In view of the above, the following question was elaborated: what is the influence of
manageri-al ability on the existence and magnitude of goodwill impairment losses in companies listed on B3?
Thus, the general objective of the study is to verify the influence of managerial ability on the existence and magnitude of goodwill impairment losses in publicly-held companies listed on B3? Thus, the overall objective of the study is to verify the influence of managerial ability on the existence and magnitude of goodwill impairment losses in companies listed on B3.
To achieve the objective, a descriptive, documentary and quantitative research was conducted, us-ing data collected in the Economática database, management reports and notes to the financial statements. The sample consisted of 148 observations, and the information for the period from 2012 to 2016 was an-alyzed. The results showed that, of all companies with goodwill, 10.81% reported losses. The largest num-ber of companies that accounted for impairment losses was found in the “petroleum, natural gas and bio-fuels sector”. Company managers in the “non-cyclical consumption” sector presented higher managerial skill indicators, followed by the managers in the “health” and “cyclical consumption” sectors. In addition, more skillful managers were able to avoid and reduce goodwill impairment losses.
The study is justified because a factor is analyzed that can influence losses but has not yet been in-vestigated in the Brazilian scenario, the managerial ability. Another justification for this research is the fact that the Recoverability test is still considered a recent accounting practice in the country; it is also justi-fied by the number of studies that investigated the influence of different factors on the impairment losses, which still tend to be low in the Brazilian scenario (Amaro, Bachmann, Fonseca & Espejo, 2015; Santos, Dani & Klann, 2015 Wrubel, Marassi & Klann, 2015, Vogt et al., 2016). Therefore, the study will contrib-ute to the literature by providing further evidence on the determinants of asset impairment.
2. Theoretical framework
The literature review provides the theoretical framework for the research. Therefore, the deter-minant factors of the impairment losses of goodwill are discussed, classified under economic indicators and management incentive factors. Then, the influence of managerial ability in the impairment losses of goodwill is addressed.
2.1 Economic performance indicators that influence the impairment losses of goodwill
Economic performance indicators refer to factors that may affect the implicit performance of all the assets of a company, including goodwill. In the literature, the main performance indicators investigat-ed are sales growth (Duh et al., 2009, Riinvestigat-edl, 2004, Kabir & Rahman, 2016, Vogt et al., 2016; Majid, 2015); operating cash flow variation (Riedl, 2004; Majid, 2015; Kabir & Rahman, 2016; Vogt et al., 2016); ROA (Riedl, 2004; Avallone & Quagli, 2015; Majid, 2015; Kabir & Rahman, 2016; Vogt et al, 2016) and the mar-ket-to-book (Zhang & Zhang, 2007; Kabir & Rahman, 2016).
In general, sales, operating cash flow and ROA are considered performance indicators. Therefore, a reduction in sales, operating cash flow and ROA indicate negative changes in the performance of the company as a whole and may represent financial problems. Therefore, these situations are usually associ-ated with higher impairment losses of goodwill (AbuGhazaleh, Al-Hares & Roberts, 2011; Majid, 2015; Kabir & Rahman, 2016).
More specifically, sales growth indicates an increase in operating performance, which will direct-ly result in a higher projection of future benefits of the assets as, the higher the variation in revenues, the higher the projected future cash flows, resulting in a higher value-in-use of the assets. Therefore, the
prob-Operating cash flow captures performance attributes related to money, that is, the cash-generating ability of assets. Thus, cash flows are expected to be a key economic indicator that contributes to determine the impairment value of goodwill, as the estimated value-in-use strongly depends on the projected cash flow. Therefore, a smaller-than-expected cash flow generation will increase the likelihood of goodwill im-pairment (AbuGhazaleh et al., 2011; Kabir & Rahman, 2016). In the opposite sense, with higher cash flows, the value in use of the assets would also be higher and would thus reduce the recognition of these losses.
With regard to the accounting performance, through ROA, researchers like AbuGhazaleh et al. (2011), Avallone and Quagli (2015), Kabir and Rahman (2016) and Sun (2016) point out that a lower ROA, i.e. lower profitability of assets is positively related to goodwill impairment. Consequently, a higher return on assets, i.e. a better performance will mean less goodwill impairment.
In relation to the market-to-book, Chen and Zhao (2004) mention that it is an important determinant of the capital structure, because it represents the difference between the market value of the asset and the book value. Thus, this is an important economic factor, as a higher market-to-book represents economic income rec-ognized by the market. The closer the Net Worth is to the company’s market value, however, the more likely it is that its assets may be overvalued or may not be fully recoverable. In this sense, a higher market-to-book in-dex may indicate that goodwill losses will be more significant (Zhang & Zhang, 2007; Kabir & Rahman, 2016). AbuGhazaleh et al. (2011) treat the market-to-book as a measure that considers the entire company as a cash-generating unit. Therefore, the companies that present the highest indicator tend to report more losses due to goodwill impairment. Stein (1996) mentions that companies and investors commit mistakes in the formation of expectations, as actions may present excessive or underestimated values at times.
As these valuation errors are corrected, according to Stein (1996), inventory returns will become partially predictable. As an example, the author mentions inventories: when overvalued, they tend to have a low relation to the market-to-book and, over time, this overvaluation will have an impact on the stock price, so that this low relation with the market-to-book will bring low future returns.
2.2 Management incentive factors that influence goodwill impairment
The main management incentive factors that can influence the losses are: company indebtedness (Avallone & Quagli, 2015; Majid, 2015; Kabir & Rahman, 2016; Vogt et al., 2016); company size (Avallone & Quagli, 2015; Kabir & Rahman, 2016); the stage of the CEO’s mandate and CEO performance (Avallone & Quagli, 2015; Majid, 2015; Kabir & Rahman, 2016; Vogt et al., 2016).
In relation to indebtedness, companies with higher levels of indebtedness are prone to accounting choices that maximize their results and, therefore, tend to underestimate impairment losses, particularly if debt is tied to restrictive clauses, so-called contractual covenants (Zang, 2008; AbuGhazaleh et al., 2011; Avallone & Quagli, 2015). The logic is that companies that are close to violating their debt agreements will be less likely to report goodwill impairment losses (Majid, 2015).
Data on corporate debt covenants, according to Majid (2015), are difficult to access, or, most of the time, not publicly available. Thus, leverage becomes a proxy for the proximity of breaches of debt agreements. Therefore, according to the author, a higher level of indebtedness is expected to correspond to a smaller mag-nitude of goodwill impairment losses. In this sense, Riedl (2004) also reports that the greater the leverage, the greater the probability of managers seeking earnings management, aiming to increase the result, which would lead to a significant and negative association between leverage and goodwill impairment losses.
With regard to company size, Zang (2008) mentions that the managers of larger companies gen-erally conduct more mergers and acquisitions, leading to higher goodwill balances. Consequently, there will be a probability of higher goodwill losses. Kabir and Rahman (2016) draw attention to the fact that, in the earnings management literature, the managers of large companies tend to choose the accounting policies that reduce the result in the current year. Therefore, according to the authors, this fact is another indication that there should be a positive association between company size and losses of goodwill.
Regarding the CEO’s mandate, Jordan and Clark (2015) mention that it may also interfere in the rec-ognition of goodwill losses as, according to them, a CEO who acquired the asset that gave rise to goodwill is less likely to register an impairment loss than his successor. Another factor related to the CEO’s mandate is that CEOs receive incentives to discharge expenses in years when the executive board changes, as the low result could be attributed to the previous management and the historical bases for future comparison would be reduced. In addition, the relief of these expenses in the future would increase the opportunity to show superior results in subsequent periods. Thus, there may be a positive association between CEOs in the first year of their mandate and goodwill losses (AbuGhazaleh et al., 2011).
On the other hand, a CEO in his final year in office can inflate reported earnings to increase the val-ue of the company’s stock options as well as his personal valval-ue in the managerial job market. Therefore, a negative association between CEOs in the final year of their mandate and goodwill losses is expected (AbuGhazaleh et al., 2011). In this sense, Ramana and Watts (2012) concluded in their study that the rep-utation of executives, as well as their behavior and rewards associated with financial results influence the recognition of goodwill impairment losses. Another factor that may influence impairment losses is the managerial ability, already investigated at the international level by Sun (2016), but this issue still needs to be investigated in Brazil.
2.3 Influence of managerial ability on goodwill impairment
In the literature, several authors have investigated the influence of managerial ability in several ar-eas, such as Hayes and Schaefer (1999), which related it to company value; Demerjian et al. (2012) to the generation of revenues; Demerjian et al. (2013) examined the relationship between managerial ability and the quality of results; Francis, Sun and Wu (2013) related it to tax evasion; Chen, Podolski and Veerara-ghavan (2015) to innovation; Krishnan and Wang (2015) to the ability to transform corporate resourc-es into revenue, Koresourc-ester, Shevlin and Wangerin (2016) to tax evasion; Jiraporn, Leelalai and Tong (2016) observed the effect of managerial ability on the dividend policy; Demerjian; Lewis-Western and McVay (2017) to income smoothing; and Huang and Sun (2017) to earnings management.
Overall, these studies indicate that more skillful managers manage their companies better. In this sense, if the recognition of the goodwill impairment loss is seen as a negative signal that reduces perfor-mance (Hirschey & Richardson, 2002; Majid, 2015; Sun, 2016), it is possible that more skilled managers can prevent or reduce such losses through more efficient management when compared to less capable managers (Sun, 2016).
In relation to the influence of managerial ability on the goodwill impairment losses, only Sun (2016) investigated this influence. This author used the measure of managerial ability developed by Demerjian et al. (2012), which captures the ability of a manager to transform available corporate resources into rev-enue. The results revealed that more skillful managers were better able to prevent and reduce goodwill impairment losses compared to less able managers.
The logic is that for managers to be successful in their activities, they need to possess various types of skills, such as strategic management skills, ability to manage operational risks, process management and also leadership skills. For example, Garriosn, Norren, and Brewer (2013) emphasize that successful managers understand that the actions that establish the variables they try to control and the decisions they make are all influenced by the strategies of the companies they operate in. The strategy, in turn, is a “game plan,” which allows a company to attract customers, differentiating itself from its competitors. Bertrand and Schoar (2003) point out that managers have different management styles and levels of knowledge that impact a wide range of corporate decisions.
Thus, the two hypotheses of the research were elaborated:
• H1: Managerial ability is negatively related to the existence of goodwill impairment.
• H2: Managerial ability is negatively related to the magnitude of goodwill impairment losses.
The expected test result of hypotheses H1 and H2, based on the literature review, is that more skill-ful managers can prevent and reduce the goodwill impairment losses.
3. Methodological Procedures
To achieve the study objective, a descriptive, documentary and quantitative research was carried out. To define the sample, initially, due to the peculiarities of the sector, each year, Brazilian public com-panies that were engaged in financial activities were excluded. Also excluded were comcom-panies that did not have the necessary information to calculate the managerial ability variable and to calculate the con-trol variables used in the research. Thus, overall, to define the sample, all Brazilian public companies that possessed goodwill and available data for all the research variables were identified.
After these procedures, the sample was composed of 148 observations in the period from 2012 to 2016. It is important to clarify that 2010 was a first learning step for Brazilian companies in the assimila-tion of a new accounting system, based on cultural and instituassimila-tional tradiassimila-tions (common law) that differ from the roots of Brazilian accounting (code law). Therefore, to reduce bias in this research, we chose to exclude the first two years of full adoption of the international standards from the analysis. Thus, the re-search focused on the period from 2012 to 2016. We believe that this time cut is able to contribute to the literature and with less bias resulting from the new standards in Brazil.
Initially, companies that possessed goodwill in the period from 2012 to 2016 were identified in the Economática database. Then, the explanatory notes and management reports of each of these companies were analyzed individually to identify the existence of goodwill impairment and its value.
As regards the existence of goodwill impairment losses, a categorical variable called Dummy_ LossesGoodwill was created, which corresponded to “1” in cases where the company had goodwill loss-es, and “0” otherwise. The adoption of this criterion is similar to that adopted in previous studies such as Avallone and Quagli (2015), Majid (2015), Kabir and Rahman (2016), Sun (2016) and Vogt et al. (2016).
As to the magnitude of the goodwill impairment losses (Vlr_LossesGoodwill), in each company, the goodwill impairment value was divided by the total assets. The adoption of this criterion is also sim-ilar to that adopted in previous studies such as Amaro et al. (2015), Avallone and Quagli (2015), Majid (2015), Kabir and Rahman (2016) and Sun (2016).
Next, the managerial ability of the managers was analyzed. For this purpose, a measure was used that was developed by Demerjian et al. (2012) and used in Sun’s similar study (2016). This measure is based on the efficiency of the managers in the use of company resources to generate revenue, calculated in two stages.
In the first, the total efficiency of the companies is estimated by sector and year, with the aid of Data Envelopment Analysis (DEA). Demerjian et al. (2012) describe that total company efficiency can be at-tributed to the specific characteristics of the manager and to the specific characteristics of the company itself. Therefore, first, we calculate the total efficiency of the company, and then, in the second stage, we identify the efficiency of the managers.
To calculate total company efficiency, we relate the inputs (available resources) with the output (rev-enues generated). The inputs considered as resources are the cost of goods sold; sales, general and admin-istrative expenses; property, plant, and equipment; operating lease; research and development expenses; goodwill; other intangible assets. The output is “net sales”.
The objective is to identify which companies can achieve a better combination of inputs and output, so the DEA was performed in the statistical software DEA-Solver. The DEA model adopted in this study is called the BCC model (Banker, Charnes & Cooper, 1984), also known as Variable Returns to Scale (VRS). It uses a formula that permits projecting each inefficient DMU on the frontier surface (envelopment) de-termined by the efficient DMUs of compatible size.
Chart 1 displays the analysis units or decision making units (DMU), presenting the inputs and out-put of the research.
Total efficiency
Input 1 Input 2 Input 3 Input 4 Input 5 Input 6 Input 7 Output 1
CGS SGAE PPE OA RDE GW; IA NS
CGS: Cost of goods sold; SGAE: Sales, general and administrative expenses; PPE: Property, plant and equipment; OA: Operational lease; RDE: Research and development expenses; GW: Goodwill; IA: Intangible assets; NS: Net sales.
Source: elaborated by the authors.
Chart 1. Definition of analysis units or efficiency concept
The data referring to the variables in Chart 1 were collected in the Economática database, except for research and development expenses, which were also collected in the explanatory notes and management reports, as most companies did not present this specific account in their statements.
According to Demerjian et al. (2012), the total efficiency score generated by the DEA can be at-tributed to the specific characteristics of the company as well as the managerial ability factor. In order to isolate the managerial ability, we need to regress the indicator of total (dependent) efficiency against spe-cific company variables (independent) that can help or hinder managers’ ability to obtain a regression er-ror term, which will be the indicator of managerial ability.
The six company-specific variables, according to Demerjian et al. (2012), are company size (log of total assets), market share (Herfindahl-Hirschman index (HHI), which measures market share based on total assets), available cash (cash and cash equivalents), company age (years since the foundation), oper-ational complexity (number of branches) and operations abroad (export revenues).
In this study, after performing the regression, following Demerjian et al. (2012), regression residuals were used as a proxy for managerial ability. The data of these variables were collected in the Economática database, Reference Forms, and Management Reports.
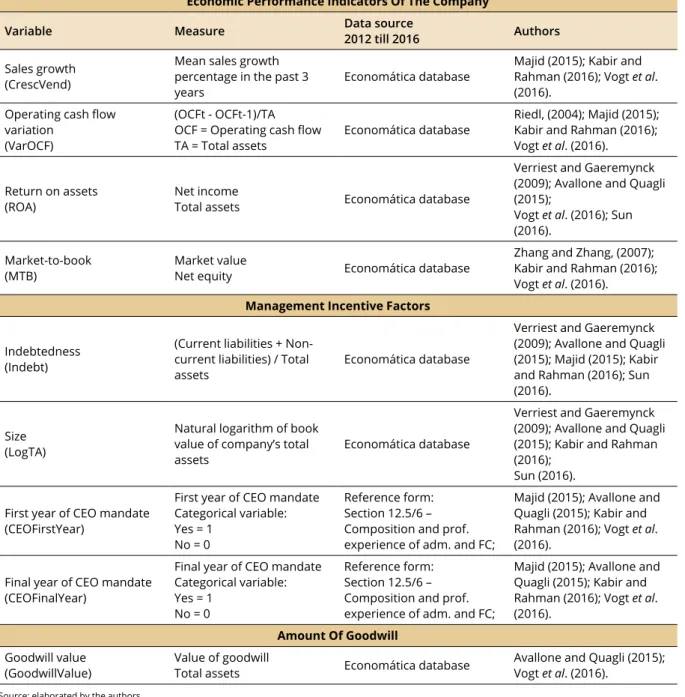
Then, data were collected on the control variables, whose measures, data source and authors are displayed in Chart 2.
Economic Performance Indicators Of The Company
Variable Measure Data source2012 till 2016 Authors
Sales growth (CrescVend)
Mean sales growth percentage in the past 3
years Economática database
Majid (2015); Kabir and Rahman (2016); Vogt et al. (2016).
Operating cash flow variation
(VarOCF)
(OCFt - OCFt-1)/TA OCF = Operating cash flow
TA = Total assets Economática database
Riedl, (2004); Majid (2015); Kabir and Rahman (2016); Vogt et al. (2016). Return on assets
(ROA) Net incomeTotal assets Economática database
Verriest and Gaeremynck (2009); Avallone and Quagli (2015);
Vogt et al. (2016); Sun (2016).
Market-to-book
(MTB) Market valueNet equity Economática database
Zhang and Zhang, (2007); Kabir and Rahman (2016); Vogt et al. (2016).
Management Incentive Factors Indebtedness
(Indebt)
(Current liabilities + Non-current liabilities) / Total
assets Economática database
Verriest and Gaeremynck (2009); Avallone and Quagli (2015); Majid (2015); Kabir and Rahman (2016); Sun (2016).
Size (LogTA)
Natural logarithm of book value of company’s total
assets Economática database
Verriest and Gaeremynck (2009); Avallone and Quagli (2015); Kabir and Rahman (2016);
Sun (2016). First year of CEO mandate
(CEOFirstYear)
First year of CEO mandate Categorical variable: Yes = 1
No = 0
Reference form: Section 12.5/6 – Composition and prof. experience of adm. and FC;
Majid (2015); Avallone and Quagli (2015); Kabir and Rahman (2016); Vogt et al. (2016).
Final year of CEO mandate (CEOFinalYear)
Final year of CEO mandate Categorical variable: Yes = 1
No = 0
Reference form: Section 12.5/6 – Composition and prof. experience of adm. and FC;
Majid (2015); Avallone and Quagli (2015); Kabir and Rahman (2016); Vogt et al. (2016).
Amount Of Goodwill Goodwill value
(GoodwillValue) Value of goodwillTotal assets Economática database Avallone and Quagli (2015); Vogt et al. (2016).
Source: elaborated by the authors.
Chart 2. Control variables
Table 2 shows that the control variables used were the economic performance indicators, the man-agement incentive factors, whose relationships with the goodwill impairment losses were discussed in the literature review, and also the amount of goodwill.
Regarding the amount of goodwill, AbuGhazaleh et al. (2011) describe that companies that pres-ent higher goodwill values in the composition of their assets may report more impairmpres-ent losses, as the relative values of goodwill exposed to impairment tests are higher. Avallone and Quali (2015) also men-tion that companies that present higher goodwill values are more likely to have higher losses, as well as a greater probability of recognizing losses.
To verify the influence of managerial ability on the “existence” of goodwill impairment losses, a lo-gistic regression analysis was performed. Lolo-gistic regression does not assume residue normality and ho-mogeneity of variances (Hair Jr. et al., 2005). The other assumptions described by Hair, Anderson, Tatham and Black (2005) of multicollinearity were observed though, using the variance inflation factor - VIF and Tolerance; homoscedasticity, by means of the Pesarán-Pesarán test; and absence of serial self-correlation, using the Durbin-Watson test.
In this case, the variable existence of losses (Dummy_LossesGoodwill) was classified as dependent. The managerial ability variable (Manag_Ability), as well as the control variables, were classified as inde-pendent, according to Equation 1:
(Equation 1) 𝐿𝐿𝐿𝐿 !! !"#$(!"##$_!"##$#%""&'()))!"#$(!"##$_!"##$#%""&'())) = α0 + β1Manag_Abilityit + β2SalesGrowit + β3VarOCFit +
β4ROAit + β5MTBit + β6Indebtit +β7Sizeit + β8CEOFirstYearit + Β9CEOFinalYearit +
β10ValueGoodwillit + εit Where:
i represents the company, ranging from 1 to N, t represents the year, ranging from 1 to T; Dummy_LossesGoodwill = Existence of goodwill impairment;
Manag_Ability = Managerial ability; SalesGrow = Sales growth;
VarOCF = Variation of operating cash flow; ROA = Return on assets;
MTB = Market-to-book;
Indebt = Indebtedness level of the company; LogTA = Company size;
CEOFirstYear = First year of the CEO’s mandate; CEOFinalYear = Final year of the CEO’s mandate; ValueGoodwill = Value of goodwill.
To verify the influence of managerial ability on the “magnitude” of goodwill impairment losses, multiple regression analysis with panel data was performed. The normality assumptions were observed, through the Kolmogorov-Smirnov test; multicollinearity through the Variance Inflation Factor (VIF) and Tolerance; homoscedasticity by means of the Pesarán-Pesarán test; and absence of serial self-correlation using the Durbin-Watson test.
The variable magnitude of goodwill impairment (Vlr_LossesGoodwill) was classified as a depen-dent variable. The variable managerial ability (GM_General), as well as the control variables, were classi-fied as independent, according to Equation 2:
(Equation 2)
Vlr_LossesGoodwillit = β0 + β1Manag_Abilityit + β2SalesGrowit + β3VarOCFit +
β4ROAit + β5MTBit + β6Indebtit +β7Sizeit +
Where:
i represents the company, ranging from 1 to N, t represents the year, ranging from 1 to T; Vlr_LossesGoodwill = Magnitude of goodwill impairment;
Manag_Ability = Managerial ability; SalesGrow = Sales growth;
VarOCF = Variation of operating cash flow; ROA = Return on assets;
MTB = Market-to-book;
Indebt = Indebtedness level of the company; LogTA = Company size;
CEOFirstYear = First year of the CEO’s mandate; CEOFinalYear = Final year of the CEO’s mandate; ValueGoodwill = Value of goodwill.
4. Data Description and Analysis
4.1 Goodwill impairment
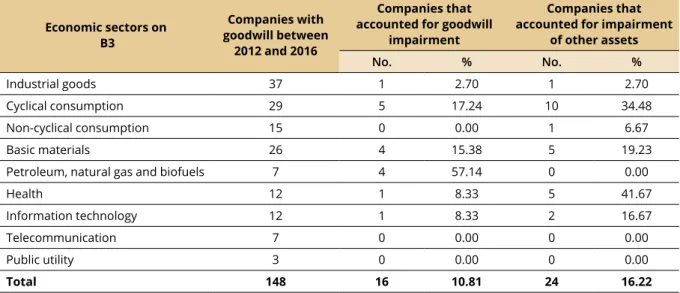
Table 1 shows the number and percentage of companies that accounted for goodwill impairment between 2012 and 2016. In addition, for the sake of a richer analysis, the numbers and percentages of com-panies that accounted for impairment of other assets are also presented.
Table 1
Quantity and percentage of companies that accounted for impairment of goodwill and other assets between 2012 and 2016
Economic sectors on B3 Companies with goodwill between 2012 and 2016 Companies that accounted for goodwill
impairment
Companies that accounted for impairment
of other assets No. % No. % Industrial goods 37 1 2.70 1 2.70 Cyclical consumption 29 5 17.24 10 34.48 Non-cyclical consumption 15 0 0.00 1 6.67 Basic materials 26 4 15.38 5 19.23
Petroleum, natural gas and biofuels 7 4 57.14 0 0.00
Health 12 1 8.33 5 41.67
Information technology 12 1 8.33 2 16.67
Telecommunication 7 0 0.00 0 0.00
Public utility 3 0 0.00 0 0.00
Total 148 16 10.81 24 16.22
Source: research data.
It can be verified in Table 1 that 148 companies possessed goodwill in the period from 2012 to 2016. Among those companies, the economic sector of “industrial goods” stands out with 37 companies (25% of the total). Then, with 29 companies (19.59%), the “cyclical consumption” sector ranks second, followed by the “basic materials” sector in which 26 companies (17.57%) possessed goodwill. Most of the compa-nies that possessed goodwill are in these three economic sectors, which together totaled 62.16%. On the opposite side, “public utility”, “telecommunications” and “petroleum, natural gas, and biofuels” stood out, totaling only 11.49% of the companies that possessed goodwill.
Regarding the number of companies accounting for goodwill impairment losses, as observed in Table 1, out of 148 companies in the sample, only 16 reported losses or only 10.81% of the total. This per-centage resembles the result of Vogt et al. (2016), in which of the 91 Brazilian companies analyzed, 6% recorded goodwill impairment losses in the period from 2011 to 2014.
Regarding the economic sector, the companies in the “petroleum, natural gas, and biofuels” sector were highlighted, which proportionally recognized greater losses. In this sector, 57.14% recorded impair-ment losses. The “cyclical consumption” sector, in which 17.24% of companies reported losses, also stood out. On the other hand, the companies in the “non-cyclical consumption”, “telecommunications” and “public utility” sectors did not account for losses during the analyzed period. Another fact worth mention-ing refers to the economic sector of “industrial goods” in which, despite bemention-ing the sector with the largest number of companies that possessed goodwill, only one of them accounted for losses.
In addition, when analyzing the accounting for impairment losses of other assets, Table 1 shows that the companies in the “health” sector stood out, as 41.67% of them recognized losses, followed by the “cyclical consumption” sector, with 34.48%, and the “basic materials” sector, where 19.23% of the com-panies reported losses on other assets. On the other hand, comcom-panies in the “petroleum, natural gas, and biofuels”, “telecommunications” and “public utility” sectors did not record impairment losses of other as-sets in the analyzed period.
When comparing the accounting treatment of goodwill impairment losses with the losses of oth-er assets, in accordance with Table 1, the companies in the “petroleum, natural gas, and biofuels” sector had greater losses in relation to goodwill, but no company recorded losses for other assets, indicating that goodwill losses have a significant impact on companies in this sector. On the other hand, the companies in the economic sectors of “cyclical consumption” and “basic materials”, which stood out in terms of ac-counting for goodwill impairment losses, also evidenced the impairment of other assets.
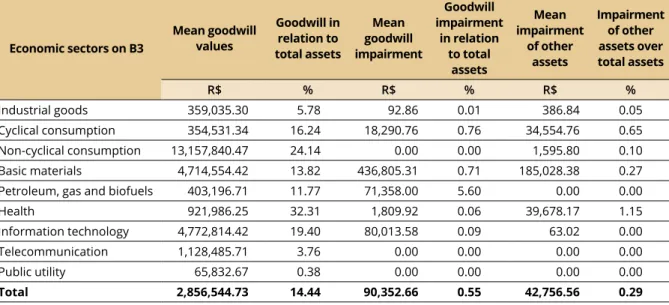
Table 2 presents the average values and percentages of impairment losses in the period from 2012 to 2016, according to the economic sectors represented on B3.
Table 2
Mean impairment values and percentages between 2012 and 2016 according to economic sectors on B3
Economic sectors on B3 Mean goodwill values Goodwill in relation to total assets Mean goodwill impairment Goodwill impairment in relation to total assets Mean impairment of other assets Impairment of other assets over total assets R$ % R$ % R$ % Industrial goods 359,035.30 5.78 92.86 0.01 386.84 0.05 Cyclical consumption 354,531.34 16.24 18,290.76 0.76 34,554.76 0.65 Non-cyclical consumption 13,157,840.47 24.14 0.00 0.00 1,595.80 0.10 Basic materials 4,714,554.42 13.82 436,805.31 0.71 185,028.38 0.27 Petroleum, gas and biofuels 403,196.71 11.77 71,358.00 5.60 0.00 0.00
Health 921,986.25 32.31 1,809.92 0.06 39,678.17 1.15
Information technology 4,772,814.42 19.40 80,013.58 0.09 63.02 0.00
Telecommunication 1,128,485.71 3.76 0.00 0.00 0.00 0.00
Public utility 65,832.67 0.38 0.00 0.00 0.00 0.00
Total 2,856,544.73 14.44 90,352.66 0.55 42,756.56 0.29
As shown in Table 2, companies in the non-cyclical consumption sector presented the highest average goodwill in their financial reports, corresponding to R$ 13,157,840.47, followed by companies in “informa-tion technology” and “basic materials”. On the other hand, companies in the “public utility” sector had the lowest average goodwill, corresponding to R$ 65,832.67. When comparing the average values of goodwill with the percentage that goodwill represents in relation to total assets, according to Table 2, in the health sector, goodwill represents 32.31% of the total company assets; in the “non-cyclical consumption” sector, it is equivalent to 24.14% of total assets; and in the “telecommunications” sector, it corresponds to 19.40%. On the other hand, in companies from the “public utility” sector, goodwill represents only 0.38% of total assets.
In relation to average goodwill losses, Table 2 shows the highest value in the “basic materials” sec-tor, with R$ 436,805.31, followed by “information technology” and “oil, gas, and biofuels”. When analyzing goodwill losses in relation to total assets, however, the values are not that representative, with the “petro-leum, natural gas, and biofuels” sector showing the highest percentage, with 5.60%, followed by “cyclical consumption” and “basic materials” with 0.76% and 0.71%, respectively. On the other hand, the sectors of “non-cyclical consumption”, “telecommunications” and “public utility” did not show goodwill losses.
When analyzing the average losses for other assets, according to Table 2, the highest average loss is found in the “basic materials” sector with R$ 185,028.38. On the other hand, the “petroleum, natural gas, and biofuels”, “telecommunications” and “public utility” sectors did not show losses for other assets. When ana-lyzing how much these losses of other assets represent in relation to total assets, we can see that these losses represent only small percentages. The health sector shows the highest percentage with 1.15% of total assets.
When comparing the percentage of goodwill losses and losses for other assets in relation to total assets, Table 2 shows that goodwill losses are more representative, being equivalent to 0.55 % of total as-sets, while losses for other assets represent 0.29% of the total assets.
4.2 Managerial ability
In Table 3, the managerial ability indicators are displayed according to the economic sectors on B3 between 2012 and 2016.
Table 3
Descriptive statistics of managerial ability indicators between 2012 and 2016 according to economic sectors on B3
Economic sectors on B3 CompaniesNo. Minimum Maximum Mean Standard deviation
Industrial goods 37 -0.300 -0.070 -0.014 0.087
Cyclical consumption 29 -0.160 -0.080 -0.023 0.056
Non-cyclical consumption 15 -0.140 -0.070 -0.029 0.058
Basic materials 26 -0.240 -0.060 -0.012 0.066
Petroleum, natural gas and biofuels 7 -0.380 -0.010 -0.166 0.124
Health 12 -0.140 -0.050 -0.025 0.052
Information technology 12 -0.240 -0.050 -0.008 0.080
Telecommunication 7 -0.060 -0.080 -0.016 0.063
Public utility 3 -0.280 -0.040 -0.067 0.185
Total 148 -0.380 -0.080 -0.001 0.085
As shown in Table 2, companies in the “non-cyclical consumption” sector had the highest average goodwill in their financial reports. In relation to the managerial ability indicators, Table 3 shows that the companies in the sample presented average indicators by sector that ranged from -0.166 to 0.029, averag-ing 0.001. When analyzaverag-ing the averages of each of the economic sectors, the companies in the “non-cycli-cal consumption” sector presented the highest average, with 0.029, followed by the “health” and “cycli“non-cycli-cal consumption” sectors with averages of 0.025 and 0.023, respectively. Thus, the results indicate that com-pany managers in the “non-cyclical consumption” sector have higher managerial ability indicators, fol-lowed by managers of the “health” and “cyclical consumption” sectors.
On the other hand, companies in the “petroleum, natural gas, and biofuels” and “public utility” sec-tors had the lowest averages, with -0.166 and -0.067, respectively. Thus, the results indicate that the man-agers of these sectors present less efficiency in the use of available resources to generate revenues.
The results of Table 3 show that firms in the “health”, “cyclical consumption” and “non-cyclical con-sumption” sectors also had the lowest standard deviations, with 0.052, 0.056 and 0.058, respectively. This demonstrates that these companies present average ability indicators that are less dispersed around the mean, that is, generally appointing that the managers of these sectors present managerial skills closer to the average indicator identified.
4.3 Descriptive statistics of control variables
In Table 4, the descriptive statistics of the control variables are presented, which like the managerial ability can influence the impairment of goodwill.
Table 4
Descriptive statistics of control variables between 2012 and 2016
Control variables Total sample Companies that accounted for goodwill impairment Companies that did not account for
goodwill impairment Test of means
Mean Mean Mean t Sig
SalesGrowth 8.72 -1.56 9.97 -2.16 0.04 VarOCF 35.81 -43.08 45.37 -1.22 0.02 ROA 1.13 -6.69 2.08 -3.10 0.00 MTB 1.89 1.26 1.96 -0.53 0.22 Indebtedness 60.41 62.15 60.20 0.32 0.75 Size 6.67 6.73 6.66 0.35 0.73 CEOFirstYear 0.40 0.56 0.38 1.42 0.16 CEOFinalYear 0.39 0.38 0.39 -0.15 0.88 ValueGoodwill 14.44 19.33 13.84 -1.86 0.08
Source: research data.
In Table 4, the means of the variables of the companies that accounted for losses can be compared with the means of the companies that did not. To compare the means, Student’s t-test was performed, which according to Spiegel (1993) is a test of comparison of means that permits verifying if the existing differences between the averages of the variables are statically significant. Prior to the application of this test, the data normality assumptions described by Spiegel (1993) were observed through the Kolmogor-ov-Smirnov test; and homogeneity of variances was verified by the Levene test.
loss-It is important to highlight that the results of the t-test indicated that the differences between the mean performance indicators of the two groups of companies were statistically significant for most vari-ables, the only exception being the MTB.
In the case of the variable sales growth, operating cash flow variation and ROA, the results are in line with the arguments of researchers such as AbuGhazaleh et al. (2011), Majid (2015), and Kabir and Rahman (2016) who reported that these variables, when negative, indicate financial problems and are therefore also associated with higher goodwill impairment losses.
When comparing the means of the management incentive variables, it can be observed that the companies accounting for goodwill losses had slightly higher averages in the indicators of indebtedness level (62.15), size (6.73) and first year of the CEO’s mandate. Only the variable referring to the CEO’s final year presented a lower average indicator in the group of companies that recorded losses.
When considering only the identified averages, the results are in line with the observations of Zang (2008), who described that managers of larger companies tend to become more involved in mergers and acquisitions, leading them to higher goodwill balances, which will also lead to higher goodwill impair-ment losses; as well as Kabir and Rahman (2016), who alerted that managers of large companies tend to choose accounting policies that detract from performance to retain and reinvest profits. Also, Li et al. (2011) found a significant positive association between size and impairment loss.
As for the variable capturing the first year of the CEO’s mandate, the results are also in line with the comments of Riedl (2004), Zang (2008) and AbuGhazaleh et al. (2011) that CEOs are given incentives to discharge expenditures in the first year of their mandates, as they could attribute losses to previous man-agement and not be held accountable for the poor performance of their predecessors.
Regarding the CEO’s final year, Ramana and Watts (2012) and AbuGhazaleh et al. (2011) describe that, in the last year in office, directors seek to inflate reported earnings to increase the value of the com-pany’s stock options as well as their personal value in the job market. Consequently, they tend to report lower goodwill impairment losses. As shown in Table 4, the indicator of this variable is slightly lower in the group of companies that reported losses, being in line with the arguments of Ramana and Watts (2012), and AbuGhazaleh et al. (2011).
It is important to note, however, that the results of the t-test indicated that the differences of means between management incentives of the two groups of companies were not statistically significant, as the level of significance was higher than 0.10. Therefore, we cannot argue for certain that there really are dif-ferences in the mean incentive indicators between the two groups.
As for the amount of goodwill, the result is also in line with the arguments and results of research-ers such as AbuGhazaleh et al. (2011) Avallone and Quali (2015) and Vogt et al. (2016), who described that companies that present higher goodwill values in the composition of their assets may report more impairment losses simply because the relative value of goodwill exposed to impairment tests is higher.
4.4 Influence of managerial ability on goodwill impairment losses
In Table 5, the logistic regression results are presented, based on which the influence of managerial ability on the existence of goodwill impairment losses can be verified.
Table 5
Regression coefficients of the influence of managerial ability on the existence of goodwill impairment losses
Variables Dependent variable: Dummy_ LossesGoodwill
Model I Model II Model III
ManagAbility -4.71** -3.42** -7.31** Performance indicators SalesGrow -0.02* -0.05** VarOCF -0.00 -0.00 ROA -0.05* -0.11** MTB -0.06 -0.06 Management incentives Indebt -0.01 -0.03 LogAT -0.24 -0.62 CEOFirstYear -1.01** -2.21** CEOFinalYear -0.51 -1.29 Amount of goodwill ValueGoodwill -0.04** -0.04** -0.06* (Constant) -2.73 -5.90** -6.97**
Step / Block / Model -16.63*** -7.04 -29.39***
-2 Log likelihood -84.76 -94.35 -72.00
Cox & Snell R Square -0.10 -0.05 -0.18
Nagelkerke R Square -0.21 -0.09 -0.36
Hosmer and Lemeshow Test -9.96 -14.81** -3.99
*** Significant at 1%; ** Significant at 5%; * Significant at 10%.
Source: research data.
The Step, Block, and Model tests aim to demonstrate the predictive capacity of the model. Accord-ing to Table 5, the result of model 1 was 16.63, model 2 7.04 and model 3 29.39, and the indicator was not statistically significant only in model 2. In the case of model 2, the lack of significance indicates the low predictive capacity of the model.
The -2Log likelihood test indicators corresponding to 84.76, 94.35 and 72.00 indicate good
adjust-ments. The Cox & Snell test, which resembles the R2 determination coefficient used in the linear model,
indicated that approximately 10% of the changes occurred in the log of the ratio of the dependent variable (existence or not of goodwill losses) in model 1 are explained by the set of independent variables; only 5% of the variations in model 2 are explained and 18% in model 3. Nagelkerke, which is an adapted version of Cox and Snell, indicates that the model is able to explain about 21% of the variations recorded in the dependent variable, in model 1; only 9% in model 2; and 36% in model 3.
Finally, the Hosmer and Lemeshow test, which aims to test the hypothesis that there are no significant dif-ferences between what was predicted and what was observed by the model, resulted in a value of 9.96 in model 1, 14.81 in model 2 and 3.99 in model 3, being significant only in model 2. This result indicates that the
predict-Also, according to Table 5, the variable “ManagAbility”, which captures managers’ managerial abil-ity, presented negative coefficients in the three models, that is, when analyzed in combination with the economic performance indicators, in combination with the management incentives and also in model 3, when analyzed in conjunction with all variables. Thus, the results show that managers with greater man-agerial ability can avoid goodwill losses. These results are similar to those found by Sun (2016), who also found an influence of managerial ability to avoid goodwill impairment losses. Thus, it can be concluded that more skillful managers can avoid goodwill losses when compared with less capable managers. Con-sequently, we do not reject the study hypothesis H, that managerial ability is negatively related to the ex-istence of goodwill impairment losses.
Regarding the economic performance indicators, we can see that two variables (SalesGrow and ROA) were statistically significant, when analyzed in combination with the managerial ability variable only (model 1) or when combined with contractual incentive variables (model 3). These results indicate that higher sales growth and greater profitability of assets influence the existence of goodwill losses.
Thus, the results confirm the arguments of researchers such as AbuGhazaleh et al. (2011), Majid (2015) and Kabir and Rahman (2016) who reported that performance variables are associated with the amount of goodwill impairment losses. In this study, the findings confirm that higher sales growth and better ROA are related to the absence of goodwill losses.
Regarding the contractual incentives of the managers, the results showed that the coefficients of the variables “Indebt”, “LogTA” and “CEOFinalYear” were not significant, indicating that there is no in-fluence on the existence of goodwill losses. The variable “CEOFirstYear”, however, which captures the CEO’s first year of operation, was statistically significant in model 2 and model 3. Thus the results are in line with the arguments of authors such as Riedl (2004), Zang (2008), and AbuGhazaleh et al. (2011) that CEOs are given incentives to discharge expenditures in the first year of their mandates, given that they could attribute losses to previous management and not be held accountable for the poor performance of their predecessors.
As to the amount of goodwill, the result is in line with AbuGhazaleh et al. (2011), Avallone and Quali (2015), and Vogt et al. (2016), who found that companies that present higher values of goodwill in the composition of their assets tend to account for goodwill losses.
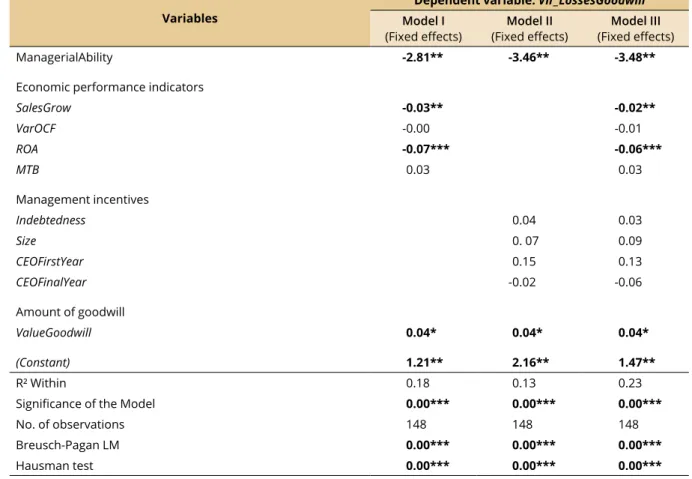
Table 6 shows the coefficients of panel data regressions on the influence of managerial ability on the magnitude of goodwill losses.
Table 6
Regression coefficients of panel data on the influence of managerial ability on the magnitude of goodwill impairment
Variables
Dependent variable: Vlr_LossesGoodwill Model I
(Fixed effects) (Fixed effects)Model II (Fixed effects)Model III
ManagerialAbility -2.81** -3.46** -3.48**
Economic performance indicators
SalesGrow -0.03** -0.02** VarOCF -0.00 -0.01 ROA -0.07*** -0.06*** MTB -0.03 -0.03 Management incentives Indebtedness -0.04 -0.03 Size -0. 07 -0.09 CEOFirstYear -0.15 -0.13 CEOFinalYear -0.02 -0.06 Amount of goodwill ValueGoodwill -0.04* -0.04* -0.04* (Constant) -1.21** -2.16** -1.47** R² Within -0.18 -0.13 -0.23
Significance of the Model -0.00*** -0.00*** -0.00***
No. of observations -148 -148 -148
Breusch-Pagan LM -0.00*** -0.00*** -0.00***
Hausman test -0.00*** -0.00*** -0.00***
*** Significant at 1%; ** Significant at 5%; * Significant at 10%. Source: research data.
As observed in Table 6, both the Breusch-Pagan test and the Hausman test were significant at 1% (p <0.01). Then, fixed-effects panel modeling was used, as described by Fávero (2009) for results like these. It can also be verified that the R² within corresponded to 18%, 13%, and 23%. These R² are similar to those recorded in other previous studies of the same nature, such as Avallone and Quagli (2015), who found R² coefficients of 9% and 25%; Majid (2015), with R² between 5% and 11%; Kabir and Rahman (2016), with R² of 19%, 20% and 23%; and Sun (2016), with an R² of 20%. Thus, the percentage explained by the inde-pendent variables can be considered acceptable.
Table 6 shows that the variable “ManagAbility”, which captures managers’ managerial ability, as well as the existence of goodwill losses, had negative and statistically significant coefficients in the three models, that is, when analyzed in combination with economic performance indicators; when analyzed in combination with management incentives; and also in model 3, when analyzed in conjunction with all variables. There-fore, the results show that managers with greater managerial ability can reduce the value of goodwill losses. These results, again, are similar to those found by Sun (2016), who also identified the influence of managerial ability to reduce goodwill impairment losses in a sample of US companies. Thus, in the same way as Sun (2016), we conclude that more skillful managers are better able to reduce the value of goodwill
Regarding the economic performance indicators, again, the variables SalesGrow and ROA were sta-tistically significant, either when analyzed only in combination with the managerial ability variable (model 1), or when combined with the management incentive variables (model 3). Again, the results confirm the arguments of researchers such as AbuGhazaleh et al. (2011), Majid (2015) and Kabir and Rahman (2016) that the performance variables are associated with the amount of goodwill impairment losses. In this study, the findings confirm that higher sales growth and better ROA influence the goodwill losses downwards.
Regarding the management incentives, the results of Table 6 show that the coefficients are not sig-nificant, pointing out that there is no influence on the magnitude of goodwill losses. With regard to the amount of goodwill, the result is also in line with that of researchers such as AbuGhazaleh et al. (2011), Avallone and Quali (2015) and Vogt et al. (2016), whose findings were that companies with higher good-will in the composition of their assets were subject to greater goodgood-will impairment losses.
5. Final Considerations
The general objective of the study was to verify the influence of managerial ability on the existence and magnitude of goodwill impairment losses in companies listed on B3. To achieve this goal, a descrip-tive, documentary and quantitative research was carried out. The data were collected in the Economáti-ca database, in the management reports and in the explanatory notes of the companies. The sample was composed of 148 observations, and the information for the period from 2012 to 2016 was analyzed.
Regarding the existence of losses, the results showed that of all companies that possessed goodwill, 10.81% reported losses, a result similar to Vogt et al. (2016) in which, of the 91 Brazilian companies ana-lyzed, 6% recorded goodwill impairment losses in the period from 2011 to 2014. Regarding the economic sector, companies in the “petroleum, natural gas, and biofuels sector” showed greater recognition of losses.
As for the magnitude of the losses, the “basic materials” sector showed the highest average value, fol-lowed by the “information technology” and “petroleum, natural gas, and biofuels” sectors. When consider-ing the value of goodwill in relation to total assets, the “petroleum, natural gas and biofuels” sector showed the highest average percentage, followed by the “cyclical consumption” and “basic materials” sectors.
Regarding the managers’ managerial ability to use the resources of publicly-held companies listed on B3, the results revealed that the managers of companies in the health sector present higher managerial ability indicators, followed by company managers in the sectors of “cyclical consumption” and “non-cy-clical consumption”, while company managers in the “petroleum, natural gas and biofuels” and “public utility” sectors possess the lowest managerial ability indicators. In general, the managers’ efficiency was identified, which can be considered close between the companies of the sample; but indicators were also found that showed the possibility of inefficiency in some companies.
As to the influence of managerial ability on the existence and magnitude of goodwill impairment loss-es, it was concluded that more skilled managers could avoid and reduce losses. The results of the research are similar to the findings of Sun (2016), who also verified the influence of managerial ability to avoid and reduce goodwill impairment. Therefore, we did not reject the study hypotheses H1 and H2 that the man-agerial ability is negatively related to the existence and the magnitude of the goodwill impairment value.
It should be noted that the Recoverability test is an important issue when addressing informa-tion quality issues in the financial statements and an important procedure for stakeholders, as it contains prominent information on the generation of future cash flows. Therefore, the research becomes relevant in providing new evidence of facts that may interfere in the recognition of losses in the Brazilian scenario.
Despite the scientific rigor and methodological care taken, the research comes with limitations. One of these limitations refers to the metrics used to analyze managerial ability. In this study, the method developed by Demerjian et al. (2012) was adopted, which was used in later studies, such as Krishnan and Wang (2015), Sun (2016) and Demerjian et al. (2001). There are other methods pointed out in the litera-ture though, which could be used in fulitera-ture research.
Other recommendations are an increased number of companies and the use of other time periods to identify trends in goodwill impairment and managerial ability. It would also be interesting to investi-gate the influence of managerial ability on the goodwill impairment losses in companies from different sectors, levels of corporate governance and countries to ascertain the impact of institutional contexts.
6. References
AbuGhazaleh, N. M., Al-Hares, O. M. & Roberts, C. (2011). Accounting discretion in goodwill impair-ments: UK evidence. Journal of International Financial Management & Accounting, 22(3), pp. 165-204. doi: 10.19085/journal.sijmd021002
Amaro, H. D., Bachmann, R. K. B., da Fonseca, M. W. & Espejo, M. M. D. S. B. (2015). Impairment e Al-isanmento de Resultados: um Estudo em Companhias do Setor de Energia Elétrica Listadas na BM&FBovespa. Revista Mineira de Contabilidade, 16(1), pp. 18-26.
Avallone, F. & Quagli, A. (2015). Insight into the variables used to manage the goodwill impairment test under IAS 36. Advances in accounting, 31(1), pp. 107-114. doi: 10.1016/j.adiac.2015.03.011
Banker, R. D., Charnes, A., & Cooper, W. W. (1984). Some models for estimating technical and scale inef-ficiencies in data envelopment analysis. Management science, 30(9), pp. 1078-1092.
Bertrand, M. & Schoar, A. (2003). Managing with style: The effect of managers on firm policies. The
Quar-terly Journal of Economics, 118(4), pp. 1169-1208. doi: https://doi.org/10.1162/003355303322552775
Calôba, G. M. (2006) Discussão e Determinação e Alvos para Cálculo de Eficiência de Concessionárias de
Distribuição de Gás Natural. Tese de Doutorado em Engenharia, Universidade Federal do Rio de
Janeiro, RJ, Brasil.
Chen, Y., Podolski, E. J. & Veeraraghavan, M. (2015). Does managerial ability facilitate corporate innova-tive success?. Journal of empirical finance, 34, pp. 313-326.
Chen, L., & Zhao, X. (2004) Understanding the Role of the Market-to-Book Ratio in Corporate Financing
Decisions. Working Paper.
CPC – Comitê De Pronunciamentos Contábeis. (2010) Pronunciamento Técnico CPC 01: Redução ao Val-or recuperável de Ativos. Recuperado em 15 fevereiro, 2017, de http://www.cpc.Val-org.br/CPC/Doc- http://www.cpc.org.br/CPC/Doc-umentos-Emitidos/Pronunciamentos/Pronunciamento?Id=2
Demerjian, P., Lev, B. & McVay, S. (2012). Quantifying managerial ability: A new measure and validity tests. Management science, 58(7), pp. 1229-1248. doi: http://dx.doi.org/10.1287/mnsc.1110.1487 (ap-plication/pdf)
Demerjian, P. R., Lev, B., Lewis, M. F. & McVay, S. E. (2013) Managerial Ability and Earnings Quality. The
Accounting Review, 88(2), pp. 463-498. doi: https://doi.org/10.2308/accr-50318
Demerjian, P., Lewis-Western, M. & McVay, S. (2017). How does intentional earnings smoothing vary with managerial ability?. Journal of Accounting, Auditing & Finance, 0148558X17748405. doi:https:// journals.sagepub.com/doi/10.1177/0148558X17748405
Duh, R. R., Lee, W. C., & Lin, C. C. (2009). Reversing an impairment loss and earnings management: The role of corporate governance. The International Journal of Accounting, 44(2), pp. 113-137.
FASB - Financial Accounting Standards Board. (1985) Statement of Financial Accounting Standards (SFAS). Elements of financial statements, n. 6. FASB. Recuperado em 23 outubro, 2017, de http://www.fasb. org/jsp/FASB/Page/SectionPage&cid=1176156317989>.
FASB - Financial Accounting Standards Board. (2001) Statements of Financial Accounting Standards nº
144: accounting for the impairment or disposal of long-lived assets. Norwalk, CT: FASB.
Fávero, L. P. L., Belfiore, P. P., Silva, F. L. D. & Chan, B. L. (2009). Análise de dados: modelagem multivari-ada para tommultivari-ada de decisões. Rio de Janeiro: Elsevier.
Garriosn, R. H., Noreen, E. W. & Brewer P. C. (2013) Contabilidade gerencial. 14ª ed. Porto alegre: AMGH. Hair, Jr. F., Anderson, R. E., Tatham, R. L. & Black, W. C. (2005) Análise multivariada de dados. Porto
Alegre: Bookman.
Hayes, R. M. & Schaefer, S. (1999). How much are differences in managerial ability worth?. Journal of
Ac-counting and Economics, 27(2), pp. 125-148.
Hirschey, M. & Richardson, V. J. (2002). Information content of accounting goodwill numbers. Journal of
Accounting and Public Policy, 21(3), pp. 173-191.
Huang, X. S. & Sun, L. (2017). Managerial ability and real earnings management. Advances in
account-ing, 39, pp. 91-104.
IASB - International Accounting Standards Board. IAS 36 Impairment of Assets. Recuperado em 20 de outubro, 2017, de: <https://www.ifrs.org/issued-standards/list-of-standards/ias-36-impairment-of-assets>.
Jiraporn, P., Leelalai, V. & Tong, S. (2016). The effect of managerial ability on dividend policy: how do tal-ented managers view dividend payouts?. Applied Economics Letters, 23(12), pp. 857-862. doi: https:// doi.org/10.1080/13504851.2015.1114572
Jordan, C. E. & Clark, S. J. (2015). Do Canadian Companies Employ Big Bath Accounting When Recording Goodwill Impairment?. International journal of economics and finance, 7(9), pp. 159. doi:10.5539/ ijef.v7n9p159
Kabir, H. & Rahman, A. (2016). The role of corporate governance in accounting discretion under IFRS: Goodwill impairment in Australia. Journal of Contemporary Accounting & Economics, 12(3), pp. 290-308. doi 10.1016/j.jcae.2016.10.001
Koester, A., Shevlin, T. & Wangerin, D. (2016). The role of managerial ability in corporate tax avoid-ance. Management Science, 63(10), pp. 3285-3310.
Krishnan, G. V. & Wang, C. (2015). The relation between managerial ability and audit fees and going concern opinions. Auditing: A Journal of Practice & Theory, 34(3), pp. 139-160. doi: https://doi. org/10.2308/ajpt-50985
Li, Z., Shroff, P. K., Venkataraman, R. & Zhang, I. X. (2011). Causes and consequences of goodwill impair-ment losses. Review of Accounting Studies, 16(4), pp. 745-778.
doi: https://doi.org/10.1007/s11142-011-9167-2
Majid, J. A. (2015). Reporting incentives, ownership concentration by the largest outside shareholder, and reported goodwill impairment losses. Journal of Contemporary Accounting & Economics, 11(3), pp. 199-214.
Martins, O. S. & Paulo, E. (2010). Reflexo da Adoção das IFRS na Análise de Desempenho das Compan-hias de Capital Aberto no Brasil. Revista de Contabilidade e Organizações, 4(9), pp. 30. doi: https:// doi.org/10.11606/rco.v4i9.34766
Ramanna, K., & Watts, R. L. (2012). Evidence on the Use of Unverifiable Estimates in Required Good-will Impairment. Review of Accounting Studies, 17, pp. 749–780. doi: http://dx.doi.org/10.1007/ s11142-012-9188-5
Riedl, E. J. (2004). An examination of long-lived asset impairments. The Accounting Review, 79(3), pp. 823-852.
Santos, P. S. A., Dani, A. C. & Klann, R. C. (2015). Concentração de propriedade e o impairment loss so-bre o Goodwill: Investigação empírica no contexto das companhias abertas brasileiras. Revista
Fac-ultad de Ciencias Económicas: Investigación y Reflexión, 23(1), pp. 175-188.
Spiegel, M. R. (1993). Estatística. 3. ed. São Paulo: Makron Books, 1993.
Stein, J. C. (1996). Rational capital budgeting in an irrational world. In: National Bureau of Economic
Re-search. (N. w5496), Cambridge.
Sun, L. (2016). Managerial ability and goodwill impairment. Advances in accounting, 32, pp. 42-51. Verriest, A., & Gaeremynck, A. (2009). What determines goodwill impairment. Review of Business and
Economics, 54(2), pp. 1-31.
Vogt, M., Pletsch, C. S., Morás, V. R. & Klann, R. C. (2016). Determinantes do Reconhecimento das Perdas por Impairment do Goodwill. Revista Contabilidade & Finanças, 27(72), pp. 349-362. doi: https:// doi.org/10.1590/1808-057x201602010
Wen, H. & Moehrle, S. R. (2016). Accounting for goodwill: An academic literature review and analy-sis to inform the debate. Research in Accounting Regulation, 28(1), pp. 11-21. doi: http://dx.doi. org/10.1016/j.racreg.2016.03.002
Wrubel, F., Marassi, R. B. & Klann, R. C. (2015). Determinantes do reconhecimento de perdas por impair-ment em empresas brasileiras. Revista de Administração, Contabilidade e Economia da Fundace, 6(1). doi: http://dx.doi.org/10.13059/racef.v6i1.248
Zhang, I. & Zhang, Y. (2007). Accounting discretion and purchase price allocation after acquisitions. Work-ing Paper. doi: https://doi.org/10.1177/0148558X15598693
Zang, Y. (2008). Discretionary behavior with respect to the adoption of SFAS no. 142 and the behavior of security prices. Review of accounting and Finance, 7(1), pp. 38-68.