Carlos Pestana Barros & Nicolas Peypoch
A Comparative Analysis of Productivity Change in Italian and Portuguese Airports
WP 006/2007/DE _________________________________________________________
António Afonso
Long-term Government Bond Yields and Economic
Forecasts: Evidence for the EU
WP 38/2009/DE/UECE _________________________________________________________
Department of Economics
W
ORKINGP
APERSISSN Nº0874-4548
School of Economics and Management
Long-term Government Bond Yields and
Economic Forecasts: Evidence for the EU
António Afonso
*ISEG/TULisbon - Technical University of Lisbon, Department of Economics; UECE – Research Unit on Complexity and Economics, R. Miguel Lupi 20, 1249-078 Lisbon, Portugal. UECE is supported by FCT
(Fundação para a Ciência e a Tecnologia, Portugal).
European Central Bank, Directorate General Economics, Kaiserstraße 29, D-60311 Frankfurt am Main Germany
Abstract
I use a panel of semi-annual vintages of growth and fiscal forecasts of the European Commission, covering the period 1998:II-2008:II, to assess its effects on 10-year government yields for 14 EU countries. Results show that yields increase with better growth forecasts, and with decreases in budget balance-to-GDP ratios, signalling that sovereigns may need to pay more to finance in the market higher budget deficits.
Keywords: interest rates, macro forecasts, EU. JEL: C33, E62, H62.
*
2
1. Introduction
The result that public deficits and public debt accumulation have implications
for interest rates is a common feature in theoretical models and also constitutes an
important part of policymakers’ conventional wisdom. From a policymaking point of
view the nexus between fiscal developments and interest rates s rendered timely in the
current era when pressures for macroeconomic activism are exercised on fiscal
authorities. Moreover, it is often argued that large fiscal imbalances may endanger the
coherence of national macroeconomic policies and jeopardize price-stability oriented
monetary policies.
The relationship between the debt/deficit and interest rates remains largely an
empirical question. Studies done in the 1980s, largely focused on the US, in the context
of crowding-out discussions are inspired by this debate.1 Some recent studies for the US
and for some EU countries, conclude that the reduction of yields and lower spreads of
long-term rates over short-term rates follow more positive budget balance projections.
For instance, Engen and Hubbard (2004), and Thomas and Wu (2009) have used fiscal
projections for the US, and Heppke-Falk and Hüfner (2004) use fiscal projections for
some European countries.
This paper contributes to the literature by using a panel of semi-annual vintages
of fiscal and macro forecasts of the European Commission (EC), as the measure of the
expectations for growth and fiscal stance, covering the 1998:II-2008:II, to assess its
effects on 10-year government bond yields in 14 European Union (EU) countries. The
paper is organized as follows. Section two explains the modelling strategy. Section
three reports the empirical analysis. Section four concludes.
1
2. Model specification
The starting specification relates the changes, cg, in the 10-year government
debt yields, i, to a set of possible explanatory factors, which include the information
revealed via the EC half yearly macro and fiscal forecasts. Within a panel data
framework the general testable model can be written as follows:
, 1 , 1 , 2 , , 3 , 1 2
e f e us
j t j j t j t j t k j t t t jt
cg
=
α α
+ ∆
cg
+
β
y
+
β
b
+
β
d
+ ∆ +
γ
i
γ
s
+
u
, (1)where the index j (j=1,…,N) denotes the country, the index t (t=1,…,T) indicates the
period and αj stands for the individual effects to be estimated for each country j.
Moreover, we have: i – 10-year government bond yield; ius – 10-year US government
bond yield; s – stock market returns, computed as the logarithmic growth rate of the
relevant stock price index, P,
1
ln( / ) 100
t t t
s = P P− × . (2)
ye is the difference between the EC forecasts for the real GDP growth rate and the
growth rate in the last year, while de is the difference between the EC forecasts for the
debt-to-GDP, and f, ,
j t k
b is the forecast in period t for the fiscal balance ratio in country j
in year k. More precisely, and, for instance, for the real growth rate,
, , , 1 , ,
e f f
j t j t t j t t
4
with
y
j t tf, , – the forecast in period t for the real growth rate in country j in year t+1, and, , f j t t
y
– the forecast in period t for the real growth rate in country j in year t.Additionally, it is assumed that the disturbances ujt in (1) are independent across
countries.
As a departing point one could expect that forecasts of future increases in the
debt-to-GDP ratio or in the deficit ratios may imply an increase in the long-term interest
rate, since it may impinge negatively on the credit risk and quality of the outstanding
sovereign debt liabilities. Indeed, market participants may perceive an additional risk
stemming from the implied loosening of fiscal stance under such conditions.2 On the
other hand, capital markets may also value the increased liquidity associated to the
existence of additional outstanding sovereign debt, and a decrease in the long-term
yields cannot be discarded as well, given that default risk has been perceived as rather
mitigated in the EU context.3
A direct effect may also be expected when higher real growth forecasts are
known, implying a steeper slope of the yield curve. Additionally, increases in the rate of
return of equities may decrease the demand for sovereign debt as investors readjust their
portfolio allocation. Therefore, bond prices would decline and bond yields could rise.
The 10-year US government debt yield measures international factors that might
have an impact on the determination of the long-term 10-year EU yields. One would
expect the 10-year US yield to fall if there is a raise in the demand for US government
debt. Assuming the existence of spillover effects to the European government bond
market, there might also be a raise in the demand for European long-term bonds. This
leads to rising prices, declining 10-year government bond yields, and the associated
2
See Alesina et al. (1992).
3
decrease of European 10-year yields. Furthermore, it is assumed that the US long-term
interest rate does not react to changes in the European long-term interest rates.
3. Empirical analysis
3.1. The data set
I use the semi-annual vintages of the fiscal and macro forecasts of the EC in the
period 1998:2-2008:2, as well as the compatible data for 10-year long-term interest rates
and for the measure of the stock market index returns. 14 EU countries are included in
the analysis: Austria, Belgium, Denmark, Finland, France, Germany, Greece, Italy,
Ireland, the Netherlands, Portugal, Spain Sweden, and UK.
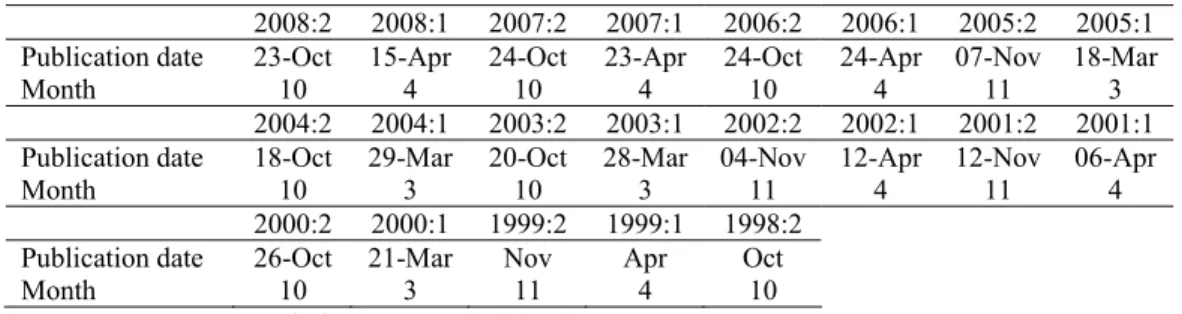
The publication dates of the semi-annual vintage EC forecasts, the so-called
spring and autumn economic forecasts, varied in the past between March and April in
the first case, and between October and November in the second case. Table 1 reports
the dates of such publications. Since these economic forecasts are regularly produced
and are public, one may expect market participants to incorporate this information in
their views towards the level of long-term interest rates.
Table 1 – EC semi-annual forecast vintages
2008:2 2008:1 2007:2 2007:1 2006:2 2006:1 2005:2 2005:1 Publication date 23-Oct 15-Apr 24-Oct 23-Apr 24-Oct 24-Apr 07-Nov 18-Mar
Month 10 4 10 4 10 4 11 3
2004:2 2004:1 2003:2 2003:1 2002:2 2002:1 2001:2 2001:1 Publication date 18-Oct 29-Mar 20-Oct 28-Mar 04-Nov 12-Apr 12-Nov 06-Apr
Month 10 3 10 3 11 4 11 4
2000:2 2000:1 1999:2 1999:1 1998:2 Publication date 26-Oct 21-Mar Nov Apr Oct
Month 10 3 11 4 10
Source: European Commission.
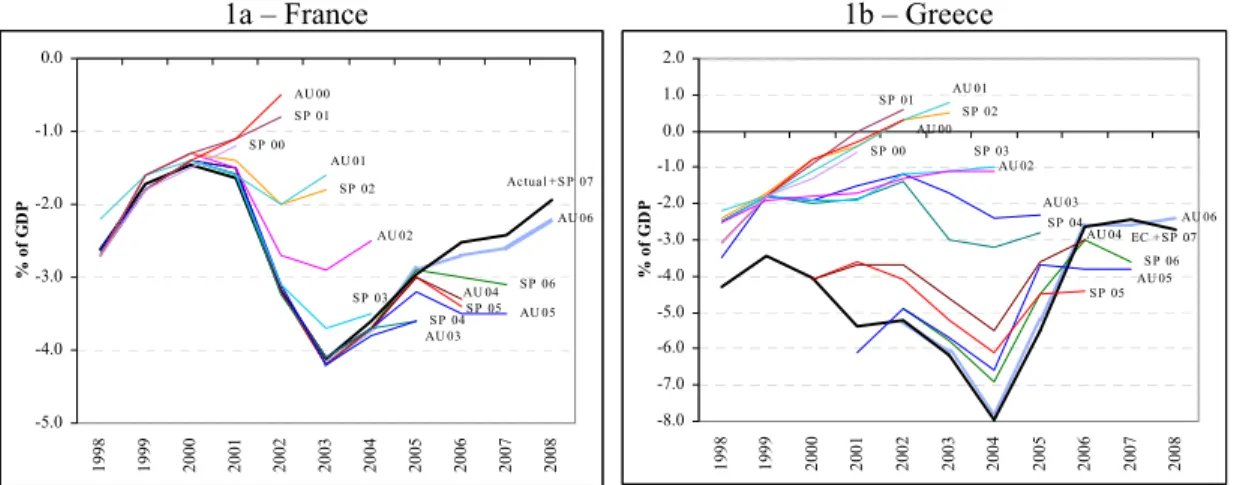
As an example, Figure 1 illustrates the differentials between EC budget deficits
6
It is clear that differences occurred regularly throughout the period under analysis for
these two examples, and the same is true for the other EU countries. For instance,
during that period, the average difference between the maximum and the minimum
forecasted and observed values was 1 percentage point (pp) and 2.6 pp, respectively for
France and for Greece. However, such differences were as high as 2.2 pp in 2002 for
France and 7.0 pp in 2003 for Greece.
Figure 1 – Budget balance EC forecast vintages
1a – France 1b – Greece
AU 06
S P 06 Ac tua l + S P 07
AU 05 S P 05 AU 04 S P 04 AU 03 S P 03
AU 02 S P 02 AU 01 S P 01 AU 00
S P 00
-5.0 -4.0 -3.0 -2.0 -1.0 0.0 19 98 19 99 20 00 20 01 20 02 20 03 20 04 20 05 20 06 20 07 20 08 % o f G D P AU 06 S P 06 EC + S P 07
AU 05 S P 05 AU 04 S P 04 AU 03 S P 03
AU 02 S P 02 AU 01 S P 01
AU 00 S P 00
-8.0 -7.0 -6.0 -5.0 -4.0 -3.0 -2.0 -1.0 0.0 1.0 2.0 19 98 19 99 20 00 20 01 20 02 20 03 20 04 20 05 20 06 20 07 20 08 % of G D P
Source: EC semi-annual vintages of fiscal forecasts. AU – autumn; SP – spring.
In the baseline regressions, and for the endogenous change in the long-term
bond yields, this is computed as the change between the 10-year interest rate between
month 2 and 3 and between month 9 and 10. Naturally, it is not easy to exactly select
both the months and the data to use regarding such higher frequency data to align with
the semi-annual macro data. Indeed, several irregularities can play a role, for instance,
some forecast vintages are coming out instead at the beginning of months 4 and 11,
while some data can already be know by the public and capital market participants in
advance of its public announcement. I use both end of the month data and monthly
Regarding interest rates, these are the 10-year government benchmark bond
yields taken from Reuters, end of month observations and monthly averages, both for
the EU countries and for the US. To compute the stock market returns I used the Dow
Jones Euro STOXX price index data.4
3.2. Results
Table 2 reports the results for the change in the 10-year government bond yield
for the period 1998:II-2008:II, using as the months to anchor the capital markets data
March and October.5 Table 2 presents estimation results using monthly average yields.
Table 2 – Estimation for the change in the 10-year government yield (cgj t, = −it it−1)
(Monthly average yields , 1998:II-2008:II)
(1) (2) (3) (4) (5) (6)
Constant 0.0114 * (1.7) 0.0104 (1.5) -0.0010 (-0.1) 0.0131 * (1.9) 0.0115 * (1.7) 0.0035 (0.3) , j t cg
∆ 0.4535 ***
(17.8) 0.4679 *** (16.5) 0.4678 *** (16.3) 0.4526 *** (18.0) 0.4689 *** (16.6) 0.4695 *** (16.6) us t i
∆ 0.0434 *** (3.0) 0.0356 ** (2.4) 0.0355 ** (2.4) 0.0450 *** (3.1) 0.0360 ** (2.4) 0.0358 ** (2.4)
, , 1 , ,
f f
j t t j t t
y + −y 0.0352 *** (4.0) 0.0361 *** (4.1) 0.0383 *** (4.5) 0.0364 *** (4.2) 0.0370 *** (4.3) 0.0386 *** (4.4)
, ,
f j t t
b -0.0128 ** (-2.1) -0.0112 * (-1.8) -0.0117 ** (-2.1)
, , 1
f j t t
b + -0.0104 * (1.7) -0.0094 (-1.5) -0.0137 * (-1.7)
st 0.0005 *
(1.8)
0.0003 * (1.7)
0.0006 **
(2.0)
0.0005 * (1.9)
, , , , 1
f
j t t j t t
d −d − -0.0052 (-1.0) -0.0037 (-0.7)
Adj. R2 0.52 0.52 0.52 0.51 0.52 0.52
Observations 267 267 267 267 267 267
Notes: The t statistics are in parentheses. *, **, *** - statistically significant at the 10, 5, and 1 percent level respectively. Panel Least Squares, cross-section fixed effects, white diagonal standard errors and covariance. y – real growth, d – debt ratio, b – budget balance ratio, s – Dow Jones STOXX returns.
The results show a positive relationship between the behaviour of the bond
yields in the EU and the 10-year US yields. Better real growth forecasts also push
4
Euro area (changing composition) - Equity/index - Dow Jones STOXX - Price index - Historical close, end of period - Euro, provided by the ECB.
5
8
upwards the long-term yields while stock returns show an opposite effect. More
interestingly, it is possible to observe a statistically significant direct dependence of
long-term bond yields on the forecasts of the fiscal balance-to-GDP ratios. Using either
forecasts for budget balances for period t, made in year t (columns 1 to 3 in Table 2), or
forecasts for budget balances for period t+1, made in year t (columns 4 to 5 in Table 2),
provide quite similar results.
Therefore, such evidence implies that new forecasts provided by the EC on
lower government budget balances (higher deficits) push up the price paid by
sovereigns to raise financing in the capital markets. On the other hand, the relationship
between the vintages of government debt ratios and the developments in long-term
yields is not statistically significant.
4. Conclusion
This paper assessed the effects of macroeconomic and fiscal forecasts on
long-term government bond yields for a panel of 14 EU countries. I used the semi-annual
vintages of fiscal and macro forecasts of the EC as the measure of the markets’
expectations for economic growth and for the fiscal policy developments, covering the
period 1998:II-2008:II. Results show that 10-year general government yields increase
with better growth forecasts, and with decreases in the budget balance-to-GDP ratios,
signalling that sovereigns then need to pay a higher price to finance higher forecasted
budget deficits. In other words, the results suggest that market discipline may arise via
References
Afonso, A. and Strauch, R. (2007). “Fiscal Policy Events and Interest Rate Swap
Spreads: some Evidence from the EU”. Journal of International Financial
Markets, Institutions & Money, 17 (3), 261-276.
Alesina, A., de Broeck, M., Prati, A., Tabellini, G. (1992). “Default risk on government
debt in OECD countries”. Economic Policy 15, 427-451.
Bernoth, K., von Hagen, J., Schuknecht, L. (2004). “Sovereign risk premia in the
European government bond market”. ECB WP 369.
Codogno, L., Favero, C., Missale, A. (2003). “Yield spreads on EMU government
bonds.” Economic Policy 18, 211-235.
Engen, E. and Hubbard, R. (2004). “Federal government debts and interest rates”,
NBER WP 10681.
Evans, P. (1985). “Do large deficits produce high interest rates?” American Economic
Review, 75 (5), 68-87.
Heppke-Falk, K. and Hüfner, F. (2004). “Expected budget deficits and interest rate
swap spreads – Evidence for France, Germany and Italy”. Bundesbank
Discussion Paper 40/2004.
Thomas, L. and Wu, D. (2009). “Long-term interest rates and expected future budget
deficits: evidence from the term structure”, Applied Economics Letters, 16 (4),
365-368.
Wachtel, P. and Young, J. (1987). “Deficit Announcements and Interest Rates”,