Universidade de Lisboa
Faculdade de Motricidade Humana
Filipa Oliveira da Silva João
Evaluation of mechanical load in the musculoskeletal system – development
of experimental and modeling methodologies for the study of the effect of
exercise in human models
Dissertação apresentada com vista à obtenção do grau de Doutor no ramo de Motricidade Humana, na especialidade de Biomecânica
Orientador: Doutor António Prieto Veloso
Presidente do Júri
Reitor da Universidade de Lisboa
Vogais
Doutor João Paulo Vilas Boas Soares Campos, Professor Catedrático da Faculdade de Desporto da Universidade do Porto
Doutor António Prieto Veloso, Professor Catedrático da Faculdade de Motricidade Humana da Universidade de Lisboa
Doutor Mário António Basto Forjaz Secca, Professor Associado da Faculdade de Ciências e Tecnologia da Universidade Nova de Lisboa
Doutor Pedro Victor Mil-Homens Ferreira Santos, Professor Associado da Faculdade de Motricidade Humana da Universidade de Lisboa
Doutor Paulo Rui Alves Fernandes, Professor Auxiliar com Agregação do Instituto Superior Técnico da Universidade de Lisboa
The work presented in this dissertation was supported by the Portuguese Foundation for
Science and Technology (FCT) through the award of the doctoral grant SFRH/BD/36318/2007
Acknowledgments
5
Acknowledgments
To elaborate this dissertation it was fundamental the contribution of several people and
entities at different levels and at different times. They all helped to critically and constructively
develop the work presented.
To Prof. António Veloso, supervisor of this thesis, my thanks for the support, trust, availability,
and for providing so many opportunities that, from an early stage, dictated the path of this
dissertation. By providing me all the means to enable my collaboration with the best
researchers in the field of biomechanics, and by recognizing my capacity, I would like to
express my sincere gratitude.
To all the co-authors with whom I had the pleasure to work with, for their constant availability,
support and for being enthusiastic for this research field: Mário Secca, Michael Noseworthy,
Sérgio Alves, Sílvia Cabral, Tom Kepple and Vera Moniz-Pereira.
To Filomena Carnide for all the availability and support, especially with the statistics treatment
of the data.
To my teachers, colleagues and members of the Laboratory of Biomechanics and Functional
Morphology, for their intellectual contribution and support over these years of study, work
and growth.
A special thanks to my friend Vanda Correia, for the constant support and friendship
(sometimes several miles away), and for being my role model in this PhD path.
To my friends Carlos, Cláudia, Filomena, Helô, Liliana, Rodrigo, Sandra and Susana for always
being there, and for all the provided moments of decompression, when the “fatigue” and “tension” increased.
Finally, a special thanks to my family for their unconditional love, support and encouragement.
List of Tables
7
List of Tables
Table 3-1: Mean and standard deviation of the kinematic and kinetic parameters assessed in
the first [0%-10%] and last [0%-100%] representative hops of the exercise. Significant
differences are referred with an* and the correspondent p-value. ... 48
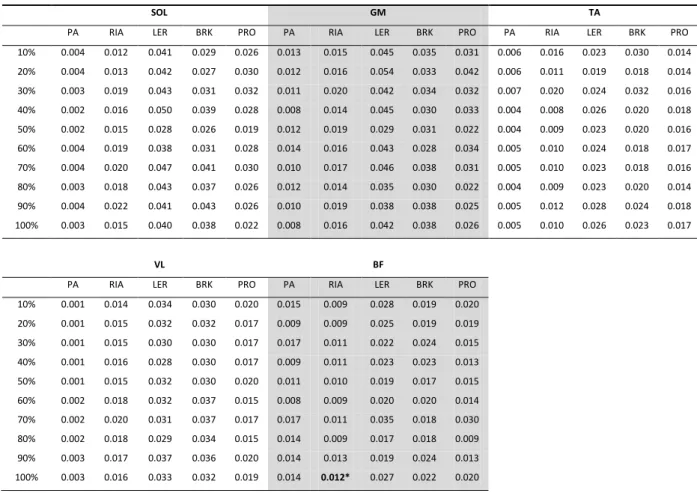
Table 3-2: Grand mean of the iEMG (adimensional units) during the PA, RIA and LER functional
phases and during the braking and propulsion parts of the contact phase, over the ten
selected hops. *significant different from the 10% to the 100% hop. p-value: 0,040. ... 52
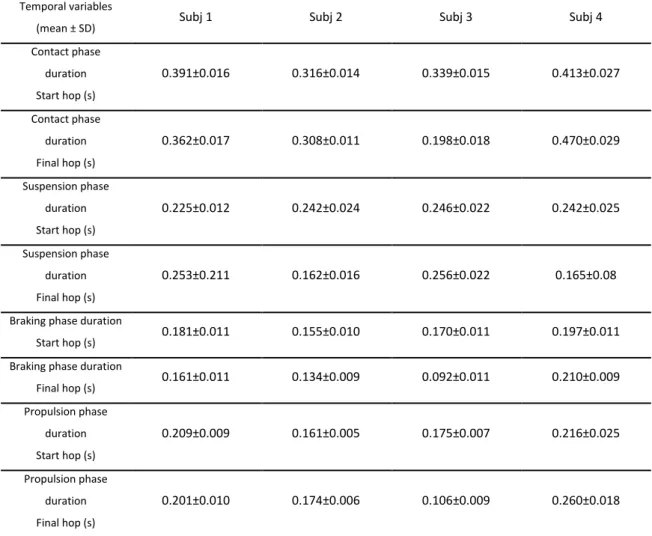
Table 4-1. Temporal variables of the four subjects’ jumps. ... 67
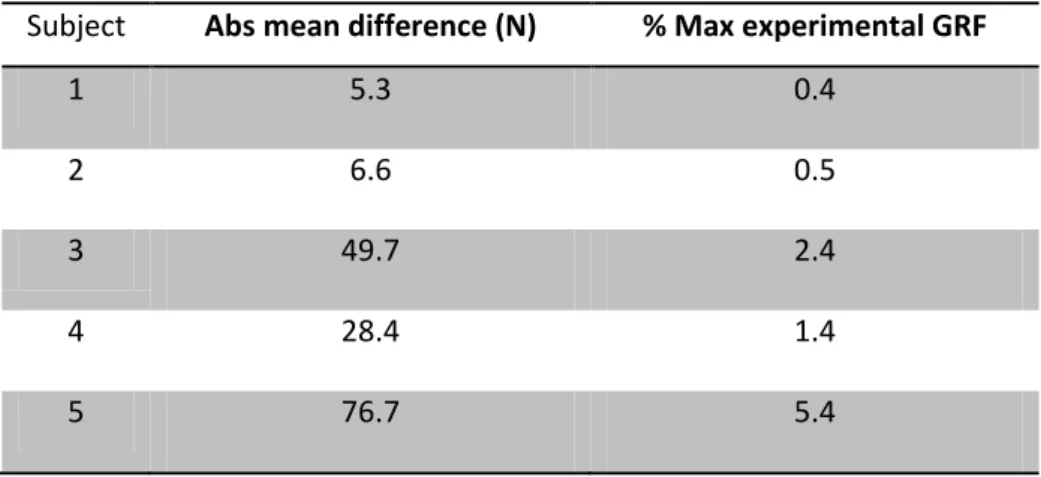
Table 5-1: Absolute mean difference between the experimental GRF and the sum of all the
induced GRF generated by IAA over the hop stance phase for the free-foot model, and the
correspondent percentage of the maximal GRF obtained with the force plate. ... 87
List of Figures
9
List of Figures
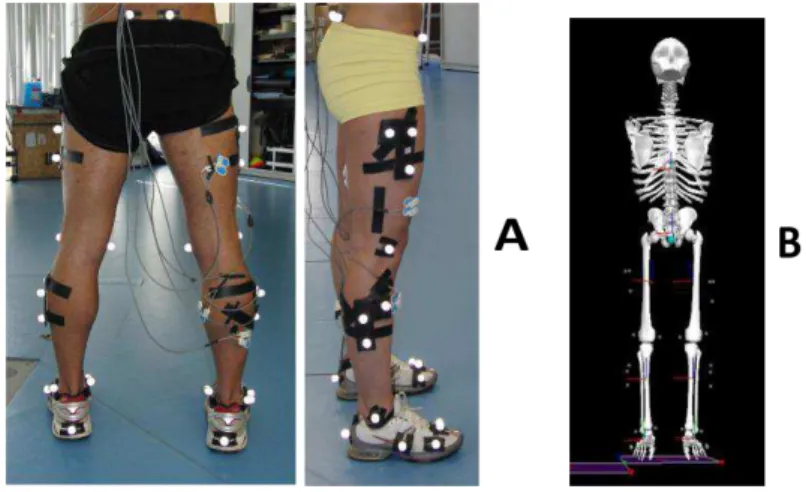
Figure 2-1: A) Segments’ reflective markers setup and B) segment’s model reconstruction in
Visual 3D ... 34
Figure 3-1: Ankle and knee angles, normalized EMG and vertical GRF for two representative
hops of one subject. The PA interval corresponds to the pre-activation phase; the RIA
interval corresponds to the reflex induced activation phase and the LER interval
corresponds to the late EMG response phase. Left column: [0%-10%] hop, right column:
[90%-100%] hop. ... 50
Figure 3-2: Left: Averaged joint moments of force. Right: averaged joint power profiles. Both
variables are from the first [0%-10%] (black line) and last [90%-100%] (grey line) selected
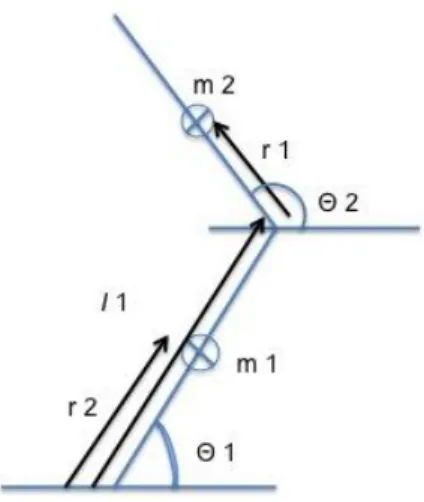
hops. ... 51 Figure 4-1: Two segments planar pendulum model, where “m” is the mass of the segment, r is
the distance between the center of mass of the segment and the rotational point (joint), I is the inertia of the segment and θ is the joint angle. ... 62 Figure 4-2: A) Segments’ marker setup (two pictures on the left) and B) segment’s model
reconstruction in Visual 3D (picture on the right) ... 65
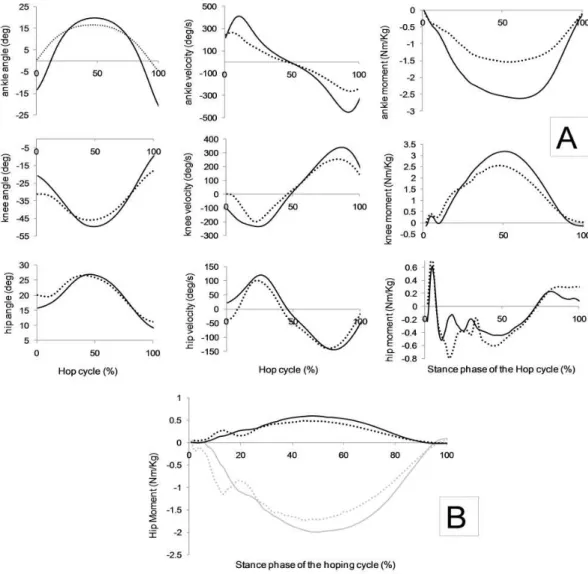
Figure 4-3: A) Plots of angular displacement, angular velocity and net joint moments
(calculated by inverse dynamics) from the right ankle (line 1), right knee (line 2) and right
hip (line 3) during the first (solid line) and last (dotted line) hopping jump. All the variables
concern to the sagital plane of motion. B) Abduction/adduction joint moment (black line)
and internal/external rotation moment (grey line) of the right hip joint. First hop
sequence (solid line), last hop sequence (dashed line)... 68
Figure 4-4: Joint angular accelerations and GRF induced by the ankle internal net moment. First
hop sequence (solid line) and last hop sequence (dotted line). The first column corresponds to the ankle, knee and hip joint’s acceleration and the plots of the second
column refers to the three components of the GRF that are induced by the same ankle
moment. All the joint acceleration variables concern to the sagital plane of motion. ... 70
Figure 4-5: Joint angular accelerations and GRF induced by the knee joint moment. First hop
sequence (solid line) and last hop sequence (dotted line). The first column corresponds to the ankle, knee and hip joint’s acceleration and the plots of the second column refers to
the three components of the GRF that are induced by the same knee moment. All the
List of Figures
10 Figure 4-6: Joint angular accelerations and GRF induced by the hip flexor/extensor moment.
First hop sequence (solid line) and last hop sequence (dotted line). The first column
corresponds to the ankle, knee and hip joint’s accelerations induced by the hip moment
and the plots of the second column refers to the three components of the GRF that are
induced by the same hip moment. All the joint acceleration variables concern to the
sagital plane of motion. ... 72
Figure 4-7: GRF induced by the hip abductor/adductor rotational moment. First hop sequence
(solid line) and last hop sequence (dotted line). ... 73
Figure 5-1: Typical subject data of the vertical ground reaction force plot obtained
experimentally through the force plate (solid line) and through the sum of all the induced
ground reaction forces generated by IAA (dashed line). ... 87
Figure 5-2: Typical subject data of the comparison of the net joint moments of force calculated
by inverse dynamics during the contact phase of the hop. Solid line: knee joint; dashed
line: ankle joint; dotted line: hip joint ... 88
Figure 5-3: Typical subject data of the comparison of the contribution of the ankle (dashed
line), knee (solid line) and hip (dotted line) joint moments to the vertical ground reaction
force, using the free-foot model. ... 88
Figure 5-4: Typical subject data of the comparison of the contribution of the ankle (dashed
line), knee (solid line) and hip (dotted line) joint moments to the rotational acceleration of the foot-floor “joint”, using the free-foot model. ... 89
Figure 5-5: Typical subject data of the comparison of the contribution of the ankle (dashed
line), knee (solid line) and hip (dotted line) joint moments to the vertical ground reaction
force, using the fixed-foot model ... 90
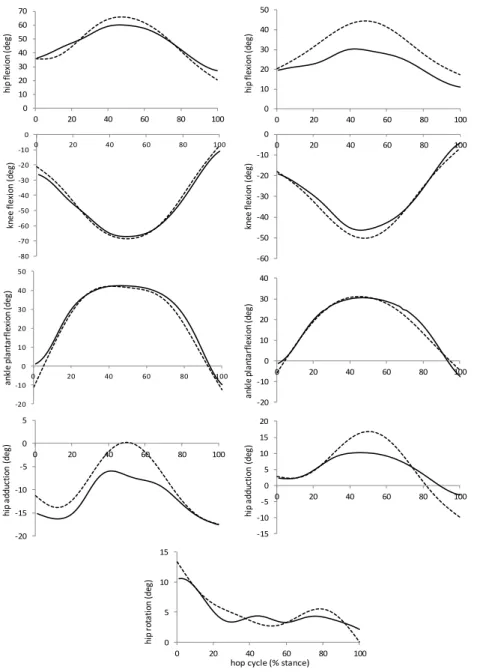
Figure 6-1: Kinematics of the hip, knee and ankle joints during the hopping cycle. Solid line:
joint angles calculated by inverse kinematics. Dashed line: joint angles calculated after
RRA. Left side: group 1, right side: group 2. ... 101
Figure 6-2: Joint moments of the hip, knee and ankle during the hopping cycle, normalized by
body mass. Dashed line: joint moments calculated in RRA. Solid line: joint moments
obtained by summing the moments generated by muscle forces during the CMC. ... 102
Figure 6-3: Comparison of muscle activations from experimental EMG (solid line) and muscle
activations calculated in computed muscle control (dotted line). ... 103
Figure 6-4- Top: Muscle’s contribution to vertical acceleration of the body’s center of mass,
during the contact phase of the hop, for one representative subject from Group 1. Bottom: Muscle’s contribution to vertical acceleration of the body’s center of mass,
List of Figures
11 solid black line is the sum of contributions of all muscle actuators in the model and the
solid grey line corresponds to the acceleration calculated from the experimental GRF. . 104
Figure 6-5: Fiber and tendon length variation (cm) during the support phase of the hopping for
one representative subject from each group. ... 105
Figure 7-1 Left: Boundaries of the GM, GL, SOL and TA muscles, delimited in the DP images.
Contents
13
Contents
Acknowledgments ... 5
List of Tables ... 7
List of Figures ... 9
1 General Introduction ... 17
1.1 Introduction ... 18
1.1.1 Dissertation objectives ... 18
1.1.2 Dissertation overview... 19
1.2 Background... 20
1.2.1 Stretch-shortening cycle overview ... 21
1.2.2 Traditional biomechanical analysis of human movement ... 22
1.2.3 Induced acceleration in biomechanical analysis ... 24
1.2.4 Imaging techniques in biomechanical analysis ... 25
1.3 References ... 26
2 Methodological Considerations ... 33
2.1 Motion Capture and 3D modeling reconstruction ... 34
2.2 Electromyography ... 35
2.3 Segmental and muscle induced acceleration analysis ... 36
2.4 Magnetic Resonance Imaging techniques: diffusion tensor imaging (DTI) and proton density (PD) ... 37
2.5 References ... 38
3 Neuromechanical changes in cyclic hopping exercise ... 41
3.1 Abstract ... 42
3.2 Introduction ... 42
3.3 Methods ... 45
Contents
14
3.3.2 Exercise protocol ... 45
3.3.3 Data acquisition ... 46
3.3.4 Statistical analysis ... 47
3.4 Results ... 48
3.5 Discussion ... 52
3.6 Conflict of interest statement ... 55
3.7 Acknowledgments ... 55
3.8 References ... 55
4 Quantifying the effect of plyometric hopping exercises on the musculoskeletal system: contributions of the lower limb joint moments of force to ground reaction forces in hopping exercise ... 59
4.1 Synopsis ... 60
4.1.1 Governing Equations of Motion ... 62
4.2 Measurements and Analysis ... 64
4.2.1 Experimental procedure ... 64
4.2.2 Motion capture ... 64
4.2.3 Induced acceleration analysis ... 66
4.3 Results ... 67
4.4 Discussion ... 74
4.5 Conclusions ... 76
4.6 Acknowledgements ... 77
4.7 References ... 77
5 Synergistic interaction between ankle and knee during hopping revealed through induced acceleration analysis ... 81
5.1 Abstract ... 82
5.2 Introduction ... 82
5.3 Materials and Methods ... 83
Contents
15
5.3.2 Induced acceleration analysis ... 85
5.3.3 Foot-floor interaction ... 86
5.4 Results ... 86
5.4.1 Net joint moments of force ... 87
5.4.2 Induced acceleration analysis: free-foot ... 88
5.4.3 Induced acceleration analysis: fixed foot ... 89
5.5 Discussion ... 90
5.6 Conflict of interest statement ... 92
5.7 Acknowledgments ... 93
5.8 References ... 93
6 Muscle tendon behavior in single-leg cyclic hopping ... 95
6.1 Abstract ... 96
6.2 Introduction ... 96
6.3 Materials and Methods ... 98
6.3.1 Kinematic and Kinetic data ... 98
6.3.2 Electromyography ... 99
6.3.3 Musculoskeletal modeling ... 99
6.4 Results ... 101
6.5 Discussion ... 106
6.6 Acknowledgements ... 108
6.7 References ... 108
7 Assessment of lower leg muscles architecture using diffusion tensor MRI: changes with cyclic stretch-shortening exercise ... 113
7.1 Abstract ... 114
7.2 Introduction ... 114
7.3 Methods ... 116
7.4 Results ... 119
Contents
16
7.6 Conclusion ... 122
7.7 Practical Implications ... 122
7.8 Acknowledgments ... 123
7.9 References ... 123
8 General Discussion and Conclusion ... 127
8.1 General Discussion ... 128
8.2 Overview of main findings ... 128
8.3 Future research ... 132
8.4 References ... 132
9 Publications ... 135
9.1 Current work publications and communications ... 136
9.2 Other publications in journals (ISI) as first author or with co-authorship ... 140
17
Chapter
1
Chapter 1
18
1.1
Introduction
This dissertation has a biomechanical basis where the main focus is related with sports
movements, in particular jumping tasks characterized by explosive actions. To increase the
knowledge and insight about the mechanisms that support this mechanical behavior, we
explored different techniques and methods, applying them to a specific jumping exercise. The
hopping model was chosen due to its wide use in musculoskeletal studies. From the motor
control point of view, being an exclusive vertical jumping task, the structure of control is
simpler and the optimization criterion is exclusively dependent on the vertical displacement of
the centre of mass of the body. In addition, being unilateral, it is easy to control the utilization
of the two legs separately, enabling the identification of possible compensatory mechanisms
to control a fatiguing protocol. Specifically, to study the effect of a repetitive jumping task, the
unilateral hopping has a high mechanical demand, thus the number of cycles needed to
achieve a fatigue state is smaller, and, as consequence, less time period for testing. Moreover,
being unilateral, there is only one force plate needed to collect the ground reaction force.
Additionally, it allows us to study the propulsive capability of a unilateral jump, which has
strong parallel to sports skills like running, volleyball and handball spike, athletics training
drills, basketball shooting drills, etc.
1.1.1
Dissertation objectives
The first purpose of this dissertation was to investigate how different methodologies
can provide us important information regarding the effect of mechanical loading in the lower
limb musculoskeletal system. To investigate how those methodologies could be used and
combined in a multidisciplinary approach, to better explain the mechanical behaviour of the
lower limb musculoskeletal system, three complementary objectives were defined:
1) To investigate the effects of increasing fatigue on lower extremity biomechanical
parameters using a traditional biomechanical analysis.
2) To use an induced acceleration approach to assess the contribution of the lower limb joints
in general and individual muscles in particular, to accelerate the centre of mass of the body.
3) To use specific imaging techniques to assess the muscle architectural parameters that are
Chapter 1
19
1.1.2
Dissertation overview
The present dissertation embraces a compilation of 5 articles published or submitted
for publication in peer-review journals with ISI Impact Factor. In this context, each chapter is
presented as an individual article following the format requested by the journal of
submission/publication in respect to its sections. The overall purpose of this compilation was
to investigate how different methodologies can provide us important information regarding
the effect of mechanical loading in the lower limb musculoskeletal system, and how those
methodologies can be combined in a multidisciplinary approach.
Accordingly, Chapter 3 contributes theoretically to the use of the stretch-shortening
cycle model as a fundamental tool to study the effect of exercise, and particularly, the effect of
fatigue achieved during cyclic movement, in the human lower limb mechanics. It comprises a manuscript (“Neuromechanical changes in cyclic hopping exercise”) aimed to present an
overview of the literature on how the hopping model has been widely used to study the
muscle-tendon behavior. It presents a full characterization of the kinematics, kinetics and
electromyography (EMG) of the hopping exercise performed until fatigue.
The study presented in Chapter 4 (“Quantifying the effect of plyometric hopping
exercises on the musculoskeletal system: contributions of the lower limb joint moments of
force to ground reaction forces in hopping exercise”) aimed to estimate the ability of the
lower limb joint moments of force to transfer mechanical energy through all the leg segments
during the hopping task, performed until exhaustion. It was used an induced acceleration
approach, which is a method based on the fact that the moments produced by muscle forces
around a joint will accelerate all joints of the body and not just the joints they cross. Having
this in mind, we analyzed how this contribution changes due to specific fatigue. An interesting
question occurred afterwards, regarding the type of model used in this study: what if we
changed the number of degrees of freedom of the model, what would happen to the
contribution of each joint to propel the body upwards during the hopping? This leads us to
Chapter 5(“Synergistic interaction between ankle and knee during hopping revealed through
induced acceleration analysis”), a manuscript where we emphasize the importance of the
synergistic behavior of our body. In this case, we modeled the foot-floor interaction in two
different ways: using a free or a fixed foot model. The intersegment coordination and
synergistic behavior has tremendous consequences for the joint moments of force and,
Chapter 1
20 look at the data and have a rationale based in the complexity of the task in order to choose the
best set of model constraints.
In Chapter 6, (“Muscle tendon behavior in single-leg cyclic hopping”) we wanted to
gain more insight regarding the contribution of the muscle-skeletal system to accelerate the
body not just at a net joint level, but specifically at an individual muscle level. In this case it
was used a muscle induced acceleration analysis approach, with a model of the lower limb and
torso with ninety two actuators, which contributed differently to the acceleration of the center
of mass during the hopping.
Finally, Chapter 7 (“Assessment of lower leg muscles architecture using diffusion
tensor MRI: changes with cyclic stretch-shortening exercise”) appears in the sequence of this
dissertation to answer some of the questions and limitations raised in Chapter 6, such as the
subject-specific muscle characteristics that have more influence in the production of force:
anatomical cross-section area, fiber length and pennation angle. In general, the
muscle-skeletal models used in simulation software parameterize the muscles using information from
cadaveric databases, therefore neglecting the individual muscle-tendon architectural and
mechanical characteristics. Through the use of imaging techniques, namely magnetic
resonance imaging (MRI), we quantified these parameters for the leg muscles in vivo, before
and after cyclic hopping exercise until exhaustion.
1.2
Background
The knowledge of the mechanical properties of human muscle-tendon structure is
extremely important in several ways:
1) to understand how the muscle–tendon units work and how they interact with each other,
namely the energy changes between the contractile element and the series elastic element
during the stretch shortening cycle (Anderson & Pandy, 1993; Ettema, 1996);
2) to obtain relevant data regarding input parameters for simulation models of the human
motor system (Bobbert, 2001), and specifically how musculoskeletal geometry and
musculo-tendon parameters affect muscle force and its moment about the joints (Delp et
al., 1990);
3) to analyze the adaptation phenomena to different conditions like exercise type, fatigue,
aging or injury, in order to better identify the specific factors that modify the performance
Chapter 1
21 In sports movements, such as jumping and running, the ability to produce explosive actions is particularly important and there’s an increased mechanical demand on the joints and
tissues of the lower extremity. In the specific case of plyometric training, this mechanical
demand produces not just neuromuscular developments (Komi, 2000) but also helps in the
development of the technique and improvement of the control during impact (Markovic &
Mikulic, 2010). This, in turn, will help to decrease the risk of injury in the lower limb
(Mandelbaum et al., 2005) and may also induce structural adaptations on the bone and soft
tissues (Kubo et al., 2007b).
1.2.1
Stretch-shortening cycle overview
Jumping activities are frequently chosen to study the mechanical properties of the
muscle-tendon complex at different levels (from in vivo mechanical properties analysis to
modeling and simulation) (Arampatzis, Schade, Walsh, & Bruggemann, 2001; Delp et al., 2007;
Delp, et al., 1990; Fukashiro, Hay, & Nagano, 2006; Nagano, Komura, Yoshioka, & Fukashiro,
2005). Due to the easiness of performance and the relative low complexity of the movement,
the hopping model is a widely used model to study muscle skeletal behavior. It can be
performed with both legs or unilaterally. The latter case is the one discussed throughout this
dissertation. One advantage of this type of hopping is the fact that there is only one force plate
needed to collect the ground reaction force. Moreover, when thinking in protocols where the
goal is to achieve a fatigue state, the unilateral hopping is profitable since there is less time
needed for testing. The study of the propulsive capability of a unilateral hopping has also a
strong parallel to sports skills like running, volleyball and handball spike, athletics training drills
or basketball shooting drills. Hopping is commonly used in training routines to enhance athletic
performance in terms of power, seeking the explosive reaction of the athlete through rapid
eccentric contractions followed by powerful concentric contractions. Furthermore, being a
vertical movement, the analysis is simplified because the control structure is simple and the
vertical displacement of the centre of mass is the only variable needed for the optimization
control.
The stretch-shortening cycle (SSC) is the mechanism of contraction behind plyometrics.
Its efficiency requires a pre-activation of the muscles preceding the eccentric phase, a short
and fast eccentric phase and a short time period between eccentric and concentric actions.
Chapter 1
22 action), when compared to the isolated concentric action (Komi, 2000). Most of the scientific
evidence seems to indicate that the force potentiation of the SSC could be explained based on
the storage of elastic energy during the stretching phase. In SSC movements, the elastic
behavior of the muscle-tendon complex plays a key role and conflicting findings regarding
muscle-tendon stiffness have been reported. Some authors suggest that a stiff muscle-tendon
complex is optimal for SSC activities since it allows a rapid and efficient transmission of muscle
force to the skeleton and higher rates of force development (Aura & Komi, 1986; Komi, 1986).
Other studies reveal a negative correlation between muscle-tendon stiffness and the increase
of performance in the concentric phase of the SSC (Kubo, Kawakami, Fukunaga, 1999; Kubo et
al., 2007a; Stafilidis & Arampatzis, 2007). In this case, it is suggested that a more compliant
muscle-tendon unit can store and release more elastic energy, which in turn could improve SSC
performance by permitting the muscle fibers to operate at a more optimal length over the first
part of their shortening range (Markovic & Mikulic, 2010).
The central and peripherical components of the neural control are crucial to the
potentiation of the SSC. The muscle activation in the period before the contact with the
ground (pre-activation) and during the reflex activation phases (in the late eccentric phase and
early concentric phase) are extremely important. When dealing with repetitive SSC exercise,
the literature shows conflicting findings. Some authors report no changes in the EMG
activation pattern during pre-activation and eccentric phases (Kubo et al., 2007b), others
report an increase in activity during the maximal voluntary contraction (Kyrolainen et al.,
2005), and there is limited evidence of changes in the stretch-reflex excitability. Possible
aspects for the neural adaptation to SSC exercise may be related with changes in leg muscle
activation strategies and inter-muscular coordination patterns during jumping, as well as
changes in the stretch reflex excitability (Markovic & Mikulic, 2010).
1.2.2
Traditional biomechanical analysis of human movement
Research has been investigating this area through the study of the kinematics, kinetics,
and neuromuscular behavior, collecting data while performing these types of actions. All
together, this information can provide an indication of the net summation of all muscle activity
for each joint. (Bezodis, Kerwin, & Salo, 2008; Fukashiro, et al., 2006; Hunter, Marshall, &
McNair, 2004; Weinhandl, Smith, & Dugan, 2011). Through the capture of the movement of
Chapter 1
23 optimization method, we can model the body segments adding it joint constraints.
Simultaneously collecting the ground reaction forces, it is possible to analyze not only the
three components of the ground reaction force vector but also use it to calculate the moments
of force on each joint, through inverse dynamics. Here we have the opportunity to combine
the observed motion of the segments with the ability of the muscles that act on those joints to
produce the force necessary to perform that movement. Although inverse dynamics are
common and well accepted in biomechanical analyses, it is a limited approach, from the
standpoint of giving quantitative information regarding individual muscle function, since a net
joint moment can be the result of several combinations of muscle forces (Schache et al., 2011).
Adding the electromyographic record of the main superficial muscles that participate
in the studied movement, it is possible to assess the electrical activity of the muscles and infer
about their neuromuscular behavior. The characterization of the neuromuscular activity during
SSC has been extensively reported (Gollhofer, Komi, Fujitsuka, & Miyashita, 1987; Gollhofer &
Kyrolainen, 1991; Horita, Komi, Nicol, & Kyrolainen, 1996; Komi, 2000; Kuitunen, Avela,
Kyrolainen, & Komi, 2004; Kuitunen, Kyrolainen, Avela, & Komi, 2007; Nicol, Komi, Horita,
Kyrolainen, & Takala, 1996) and used as another source of information to add to the
kinematics and kinetics analysis.
Finally, the kinematics, kinetics and EMG data can be combined into musculoskeletal
models, allowing the estimation of muscle forces or joint reaction forces. However, most of
the computational models used have been created based on anatomical data collected from
cadaveric specimens. To estimate muscle volume or PCSA, data of muscle force-generating
capacities derived from cadaveric studies are often used to scale models of the muscle-tendon
unit (Anderson & Pandy, 1999; Bobbert, 2001; Delp, et al., 1990). The use of those databases
allows a better understanding of general principles of muscle function, but the comparability
to individual muscle performance remains unclear (Albracht, Arampatzis, & Baltzopoulos,
2008).
If on one hand we want to analyze the human movement taking into account the body
not just as a number of articulated segments that describe a certain behavior, but as a whole
which works together in a synergistic way; on the other hand, we want to surpass the
limitations that come from the use of standardized musculoskeletal models to obtain
Chapter 1
24
1.2.3
Induced acceleration in biomechanical analysis
Synergies occur in nature as an organization of elements which have the role of
maintaining the stability properties of a certain performance variable (Latash, Gorniak, &
Zatsiorsky, 2008). Muscles can generate force and develop mechanisms to exchange energy
among segments, whether they are performing isometric, concentric or eccentric actions
(Zajac, 2002; Zajac, Neptune, & Kautz, 2002). The knowledge of the exact role of a muscle in a
particular movement is an important goal of the majority of researchers in the contexts of
biomechanics, rehabilitation, performing arts, sports, etc.
Muscles are not always capable to directly deliver the energy that they produce to the
target segment because its force does not accelerate that segment, instead acts to accelerate
other segments. This means that the muscle works in a synergistic way, producing energy so
that other muscles can use it to accelerate or decelerate segments in order to reach the target
segment (Zajac, 2002). Induced acceleration analysis (IAA) is a technique based in the dynamic
coupling effect caused by the multi-articulated nature of the body (Zajac, 1993, 2002; Zajac &
Gordon, 1989). Dynamic coupling means that when a muscle contracts it produces
acceleration, not only in those segments that are spanned by that muscle but on all body
segments of the chain, due to the intersegment forces. Thus, this technique allows the direct
quantification of a joint moment contribution to the acceleration of each joint of the body and
to the body center of mass.
Analyses of induced accelerations have been mainly used with normal gait (Correa,
Crossley, Kim, & Pandy, 2010; Correa & Pandy, 2012; Dorn, Lin, & Pandy, 2012; Goldberg &
Kepple, 2009; Liu, Anderson, Pandy, & Delp, 2006; Liu, Anderson, Schwartz, & Delp, 2008;
Neptune, Kautz, & Zajac, 2001; Neptune & McGowan, 2011; Pandy & Andriacchi, 2010;
Yi-Chung Lin, 2011), impaired gait (Arnold, Anderson, Pandy, & Delp, 2005; Siegel, Kepple, &
Stanhope, 2006, 2007), running (Hamner, Seth, & Delp, 2010; Neptune & McGowan, 2011) and
pedaling (Neptune, Kautz, & Zajac, 2000), in order to study the changes in muscle
contributions to motion. However, most dynamic human movements in sports activities
involve cyclic stretch-shortening actions with maximal mechanical power production, so this
technique should be of benefit in analyzing the different contributions of lower limb muscle
groups over a time period during cyclic exercise. This tool could also be useful to assess muscle
groups adaptive compensations when muscle fatigue occurs. It is being clearly showed by
Chapter 1
25 effect of a muscle group action or a joint moment of force can accelerate body segments that
are located far on the segmental chain through a coupling effect.
1.2.4
Imaging techniques in biomechanical analysis
Musculoskeletal models allow us to estimate, amongst other parameters, the
force-generating capacity of muscles (that are difficult to measure experimentally). Recently, models
of the musculoskeletal system comprise the tridimensional surface geometry of bones, the
kinematics of the joints and a considerable number of actuators that represent the muscles
and tendons to which were assigned mechanical characteristics, acquired from cadaveric
databases. The combination of these models with dynamic simulation has been used to gain
more insight into normal and pathological movement (Anderson & Pandy, 2003).
One limitation of musculoskeletal models is the input parameters which typically are
based in cadaveric data obtained from different studies, usually with a few numbers of
specimens (Friederich & Brand, 1990; Wickiewicz, Roy, Powell, & Edgerton, 1983). It is likely
that data from cadaveric specimens do not accurately reflect absolute or relative sizes of
muscles in young and healthy subjects (Tate, Williams, Barrance, & Buchanan, 2006). Another
limitation is the simplification of some muscle architectural parameters, such as muscle fiber
length (normally are averaged in cadaveric studies) or pennation angle (common models
assume muscle fibers as one single structure with only one angle between the fibers direction
and the aponeurosis). For this reason, the need to create accurate, individualized models of
the musculoskeletal system is driving advances in imaging techniques, especially in MRI
(Blemker, Asakawa, Gold, & Delp, 2007).
MRI is considered the most useful non-invasive imaging technique that allows the
reconstruction of the whole muscle, enabling the quantification of detailed structure, function
and metabolism from the muscle tissue. One of the MRI methods is the Diffusion tensor
imaging (DTI). This imaging technique relies on the correspondence between cell geometry
and the anisotropic nature of water diffusion in the muscle (Heemskerk, Sinha, Wilson, Ding, &
Damon, 2010). The theoretical basis for DTI states that self-diffusion of water in tissue is
restricted by membranes and other cellular constituents, resulting in an apparent diffusion
coefficient, which is lower than the free diffusion coefficient and is orientation-dependent for
elongated structures. Skeletal muscles are composed of fascicles that have an elongated,
Chapter 1
26 and give us information regarding the shape and the direction of the diffusion (Noseworthy,
Davis, & Elzibak, 2010). Through a tractographic process, it is possible to quantify the number
of fascicles, estimate fascicle length and also observe and quantify the different pennations in different areas of the muscle. Throughout this dissertation, it will be used the word “fiber”
instead of fascicle, when we address the issues related with diffusion tensor imaging and
tractography. The reason lies in the fact that is common to use this term in the journals from
this research field, namely magnetic resonance imaging publications.
Another MRI test used is the signal obtained from Proton density (PD) weighted scans,
which is directly proportional to the number of available spins (hydrogen nuclei in water). It
consists in a spin echo or a gradient echo sequence, with short echo time and long repetition
time. PD images are useful for determining the muscles boundaries, due to the elevated detail
in the image and tissue differentiation capability, enabling the determination of muscle cross
sectional area, and subsequently muscle volume using simple image processing software.
1.3
References
Albracht, K., Arampatzis, A., & Baltzopoulos, V. (2008). Assessment of muscle volume and
physiological cross-sectional area of the human triceps surae muscle in vivo. J Biomech, 41(10), 2211-2218. doi: 10.1016/j.jbiomech.2008.04.020
Anderson, F.C., & Pandy, M.G. (1993). Storage and utilization of elastic strain energy during
jumping. J Biomech, 26(12), 1413-1427. doi: 10.1016/0021-9290(93)90092-S
Anderson, F.C., & Pandy, M.G. (1999). A Dynamic Optimization Solution for Vertical Jumping in
Three Dimensions. Comput Methods Biomech Biomed Engin, 2(3), 201-231. doi: 10.1080/10255849908907988
Anderson, F.C., & Pandy, M.G. (2003). Individual muscle contributions to support in normal
walking. Gait Posture, 17(2), 159-169. doi: 10.1016/S0966-6362(02)00073-5
Arampatzis, A., Schade, F., Walsh, M., & Bruggemann, G. (2001). Influence of leg stiffness and
its effect on myodynamic jumping performance. J Electromyogr Kinesiol, 11(5), 355-364. doi: 10.1016/S1050-6411(01)00009-8
Arnold, A.S., Anderson, F.C., Pandy, M.G., & Delp, S.L. (2005). Muscular contributions to hip
Chapter 1
27 investigating the causes of crouch gait. J Biomech, 38(11), 2181-2189. doi: 10.1016/j.jbiomech.2004.09.036
Aura, O., & Komi, P.V. (1986). Effects of prestretch intensity on mechanical efficiency of
positive work and on elastic behavior of skeletal muscle in stretch-shortening cycle
exercise. Int J Sports Med, 7(3), 137-143. doi: 10.1055/s-2008-1025751
Bezodis, I., Kerwin, D., & Salo, A. (2008). Lower-limb mechanics during the support phase of
maximum-velocity sprint running. Med Sci Sports Exerc, 40(4), 707-715. doi:
10.1249/MSS.0b013e318162d162
Blazevich, A.J. (2006). Effects of physical training and detraining, immobilisation, growth and
aging on human fascicle geometry. Sports Med, 36(12), 1003-1017. doi: 10.2165/00007256-200636120-00002
Blemker, S.S., Asakawa, D.S., Gold, G.E., & Delp, S.L. (2007). Image-based musculoskeletal
modeling: applications, advances, and future opportunities. J Magn Reson Imaging, 25(2), 441-451. doi: 10.1002/jmri.20805
Bobbert, M.F. (2001). Dependence of human squat jump performance on the series elastic
compliance of the triceps surae: a simulation study. J Exp Biol, 204(3), 533-542.
Bobbert, M.F., van der Krogt, M.M., van Doorn, H., & de Ruiter, C.J. (2011). Effects of fatigue of
plantarflexors on control and performance in vertical jumping. Med Sci Sports Exerc, 43(4), 673-684. doi: 10.1249/MSS.0b013e3181fa7738
Correa, T.A., Crossley, K.M., Kim, H.J., & Pandy, M.G. (2010). Contributions of individual
muscles to hip joint contact force in normal walking. J Biomech, 43(8), 1618-1622. doi: 10.1016/j.jbiomech.2010.02.008
Correa, T.A., & Pandy, M.G. (2012). On the potential of lower limb muscles to accelerate the
body's centre of mass during walking. Comput Methods Biomech Biomed Engin. doi: 10.1080/10255842.2011.650634
Delp, S.L., Anderson, F.C., Arnold, A.S., Loan, P., Habib, A., John, C.T., …, Thelen, D.G. (2007).
OpenSim: open-source software to create and analyze dynamic simulations of
Chapter 1
28 Delp, S.L., Loan, J.P., Hoy, M.G., Zajac, F.E., Topp, E.L., & Rosen, J.M. (1990). An interactive
graphics-based model of the lower extremity to study orthopaedic surgical procedures.
IEEE Trans Biomed Eng, 37(8), 757-767. doi: 10.1109/10.102791
Dorn, T.W., Lin, Y.C., & Pandy, M.G. (2012). Estimates of muscle function in human gait depend
on how foot-ground contact is modelled. Comput Methods Biomech Biomed Engin. 1-12. doi: 10.1080/10255842.2011.554413
Ettema, G.J. (1996). Mechanical efficiency and efficiency of storage and release of series elastic
energy in skeletal muscle during stretch-shorten cycles. J Exp Biol, 199(9), 1983-1997. Friederich, J.A., & Brand, R.A. (1990). Muscle fiber architecture in the human lower limb. J
Biomech, 23(1), 91-95. doi: 10.1016/0021-9290(90)90373-B
Fukashiro, S., Hay, D.C., & Nagano, A. (2006). Biomechanical behavior of muscle-tendon
complex during dynamic human movements. J Appl Biomech, 22(2), 131-147.
Goldberg, S.R., & Kepple, T.M. (2009). Muscle-induced accelerations at maximum activation to
assess individual muscle capacity during movement. J Biomech, 42(7), 952-955. doi: 10.1016/j.jbiomech.2009.01.007
Gollhofer, A., Komi, P., Fujitsuka, N., & Miyashita, M. (1987). Fatigue during stretch-shortening
cycle exercises. II. Changes in neuromuscular activation patterns of human skeletal
muscle. Int J Sports Med, 8 Suppl 1, 38-47. doi: 10.1055/s-2008-1025702
Gollhofer, A., & Kyrolainen, H. (1991). Neuromuscular control of the human leg extensor
muscles in jump exercises under various stretch-load conditions. Int J Sports Med, 12(1), 34-40. doi: 10.1055/s-2007-1024652
Hamner, S.R., Seth, A., & Delp, S.L. (2010). Muscle contributions to propulsion and support
during running. J Biomech, 43(14), 2709-2716. doi: 10.1016/j.jbiomech.2010.06.025 Heemskerk, A.M., Sinha, T.K., Wilson, K.J., Ding, Z., & Damon, B.M. (2010). Repeatability of
DTI-based skeletal muscle fiber tracking. NMR Biomed, 23(3), 294-303. doi:
10.1002/nbm.1463
Horita, T., Komi, P., Nicol, C., & Kyrolainen, H. (1996). Stretch shortening cycle fatigue:
interactions among joint stiffness, reflex, and muscle mechanical performance in the
Chapter 1
29 Hunter, J.P., Marshall, R.N., & McNair, P. (2004). Reliability of biomechanical variables of sprint
running. Med Sci Sports Exerc, 36(5), 850-861. doi:
10.1249/01.MSS.0000126467.58091.38
Kepple, T.M., Siegel, K.L., Stanhope, S.J. (1997). Relative contribution of the lower extremity
joint moments to forward progression and support during gait. Gait Posture, 6, 1-8. doi: 10.1016/S0966-6362(96)01094-6
Komi, P.V. (2000). Stretch-shortening cycle: a powerful model to study normal and fatigued
muscle. J Biomech, 33(10), 1197-1206. doi: 10.1016/S0021-9290(00)00064-6
Komi, P.V. (1986). Training of muscle strength and power: interaction of neuromotoric,
hypertrophic, and mechanical factors. Int J Sports Med, 7 Suppl 1, 10-15. doi: 10.1055/s-2008-1025796
Kubo, K., Kawakami, Y., Fukunaga, T. (1999). Influence of elastic properties of tendon
structures on jump performance in humans. J Appl Physiol, 87(6), 2090-2096.
Kubo, K., Morimoto, M., Komuro, T., Tsunoda, N., Kanehisa, H., & Fukunaga, T. (2007a).
Influences of tendon stiffness, joint stiffness, and electromyographic activity on jump
performances using single joint. Eur J Appl Physiol, 99(3), 235-243. doi:
10.1007/s00421-006-0338-y
Kubo, K., Morimoto, M., Komuro, T., Yata, H., Tsunoda, N., Kanehisa, H., & Fukunaga, T.
(2007b). Effects of plyometric and weight training on muscle-tendon complex and jump
performance. Med Sci Sports Exerc, 39(10), 1801-1810. doi:
10.1249/mss.0b013e31813e630a
Kuitunen, S., Avela, J., Kyrolainen, H., & Komi, P. (2004). Voluntary activation and mechanical
performance of human triceps surae muscle after exhaustive stretch-shortening cycle
jumping exercise. Eur J Appl Physiol, 91(5-6), 538-544. doi: 10.1007/s00421-003-1004-2 Kuitunen, S., Kyrolainen, H., Avela, J., & Komi, P. (2007). Leg stiffness modulation during
exhaustive stretch-shortening cycle exercise. Scand J Med Sci Sports, 17(1), 67-75. doi: 10.1111/j.1600-0838.2005.00506.x
Kÿrolainen, H., Avela, J., McBride, J., Koskinen, S., Andersen, J., Sipilä, S., …, Komi, P. (2005).
Chapter 1
30 Latash, M.L., Gorniak, S., & Zatsiorsky, V.M. (2008). Hierarchies of Synergies in Human
Movements. Kinesiology (Zagreb), 40(1), 29-38.
Liu, M.Q., Anderson, F.C., Pandy, M.G., & Delp, S.L. (2006). Muscles that support the body also
modulate forward progression during walking. J Biomech, 39(14), 2623-2630. doi: 10.1016/j.jbiomech.2005.08.017
Liu, M.Q., Anderson, F.C., Schwartz, M.H., & Delp, S.L. (2008). Muscle contributions to support
and progression over a range of walking speeds. J Biomech, 41(15), 3243-3252. doi:
10.1016/j.jbiomech.2008.07.031
Mandelbaum, B., Silvers, H., Watanabe, D., Knarr, J., Thomas, S., Griffin, L., …, Garrett, W. Jr.
(2005). Effectiveness of a neuromuscular and proprioceptive training program in
preventing anterior cruciate ligament injuries in female athletes: 2-year follow-up. Am J Sports Med, 33(7), 1003-1010. doi: 10.1177/0363546504272261
Markovic, G., & Mikulic, P. (2010). Neuro-musculoskeletal and performance adaptations to
lower-extremity plyometric training. Sports Medicine, 40(10), 859-895. doi: 10.2165/11318370-000000000-00000
Nagano, A., Komura, T., Yoshioka, S., & Fukashiro, S. (2005). Contribution of non-extensor
muscles of the leg to maximal-effort countermovement jumping. Biomed Eng Online, 4,
52. doi: 10.1186/1475-925X-4-52
Neptune, R.R., Kautz, S.A., & Zajac, F.E. (2000). Muscle contributions to specific biomechanical
functions do not change in forward versus backward pedaling. J Biomech, 33(2),
155-164. doi: 10.1016/S0021-9290(99)00150-5
Neptune, R.R., Kautz, S.A., & Zajac, F.E. (2001). Contributions of the individual ankle plantar
flexors to support, forward progression and swing initiation during walking. J Biomech, 34(11), 1387-1398. doi: 10.1016/S0021-9290(01)00105-1
Neptune, R.R., & McGowan, C.P. (2011). Muscle contributions to whole-body sagittal plane
angular momentum during walking. J Biomech, 44(1), 6-12. doi: 10.1016/j.jbiomech.2010.08.015
Nicol, C., Komi, P., Horita, T., Kyrolainen, H., & Takala, T. (1996). Reduced stretch-reflex
Chapter 1
31 Noseworthy, M.D., Davis, A.D., & Elzibak, A.H. (2010). Advanced MR imaging techniques for
skeletal muscle evaluation. Semin Musculoskelet Radiol, 14(2), 257-268. doi: 10.1055/s-0030-1253166
Pandy, M.G., & Andriacchi, T.P. (2010). Muscle and joint function in human locomotion. Annu Rev Biomed Eng, 12, 401-433. doi: 10.1146/annurev-bioeng-070909-105259
Schache, A.G., Blanch, P.D., Dorn, T.W., Brown, N.A., Rosemond, D., & Pandy, M.G. (2011).
Effect of running speed on lower limb joint kinetics. Med Sci Sports Exerc, 43(7),
1260-1271. doi: 10.1249/MSS.0b013e3182084929
Siegel, K.L., Kepple, T.M., & Stanhope, S.J. (2006). Using induced accelerations to understand
knee stability during gait of individuals with muscle weakness. Gait Posture, 23(4), 435-440. doi: 10.1016/j.gaitpost.2005.05.007
Siegel, K.L., Kepple, T.M., & Stanhope, S.J. (2007). A case study of gait compensations for hip
muscle weakness in idiopathic inflammatory myopathy. Clin Biomech (Bristol, Avon), 22(3), 319-326. doi: 10.1016/j.clinbiomech.2006.11.002
Stafilidis, S., & Arampatzis, A. (2007). Muscle - tendon unit mechanical and morphological
properties and sprint performance. J Sports Sci, 25(9), 1035-1046. doi:
10.1080/02640410600951589
Tate, C. M., Williams, G. N., Barrance, P. J., & Buchanan, T. S. (2006). Lower extremity muscle
morphology in young athletes: an MRI-based analysis. Med Sci Sports Exerc, 38(1), 122-128. doi: 10.1249/01.mss.0000179400.67734.01
Weinhandl, J., Smith, J., & Dugan, E. (2011). The effects of repetitive drop jumps on impact
phase joint kinematics and kinetics. J Appl Biomech, 27(2), 108-115.
Wickiewicz, T.L., Roy, R.R., Powell, P.L., & Edgerton, V.R. (1983). Muscle architecture of the
human lower limb. Clin Orthop Relat Res(179), 275-283. doi: 10.1097/00003086-198310000-00042
Lin, Y-C., Kim, H.J., & Pandy, M.G. (2011). A computationally efficient method for assessing
muscle function during human locomotion. Int J Numer Method Biomed Eng, 27, 436-449. doi: 10.1002/cnm.1396
Zajac, F.E. (2002). Understanding muscle coordination of the human leg with dynamical
33
Chapter
2
Chapter 2
34 The subsections of this chapter are a brief description of each one of the methods used to
accomplish the purposes mentioned in the Introduction. Nevertheless, in each chapter (from
three to seven), the methodology will be described more in detail, according to the specific
objective of the chapter.
2.1
Motion Capture and 3D modeling reconstruction
This subsection refers to the methods used to obtain the data that serve as input in all of the thesis’ chapters. To record the hopping movement, a tridimensional motion capture was
collected in the Biomechanics Laboratory with an optoelectronic system of ten cameras
Qualisys (Ocqus 300 model) operating at 200Hz. Twenty-four reflective markers and four
marker clusters were placed in predefined anatomical protuberances (acromial, stern,
anterior-superior and posterior-superior iliac spines, lateral and medial femoral condyles,
lateral malleoli of the fibula, medial malleoli of the tibia, 1st and 5th metatarsal heads and one
marker cluster for each thigh, shank and foot segments), as can be seen in Fig. 2-1A. These
markers were used for the reconstruction of eight body segments (trunk, pelvis, right and left
thighs, right and left shanks and right and left feet) in Visual 3D software (Visual 3D Basic RT,
C-Motion, Inc., Germantown, MD) (Fig. 2-1B).
Figure 2-1: A) Segments’ reflective markers setup and B) segment’s model reconstruction in Visual 3D
Each body segment was reconstructed as a rigid body, with a length and an embedded
coordinate system. Visual 3D assumes that each segment moves accordingly with the motion
of the tracking markers that are attached to it. Regarding this, the system tracks the position
and orientation of each segment, allowing for the calculation of all the kinematic variables. We
multi-Chapter 2
35 link model for each data frame such that the overall differences between the measured and
model-determined marker coordinates are minimized in a least square sense, throughout all
the body segments. This method, also known as inverse kinematics (IK), considers
measurement error distributions in the system and provides an error compensation
mechanism between body segments, which can be regarded as a global optimization at the system level (Lu & O’Connor, 1999). Basically, it relies on the determination of a pre-defined
kinematic model with predefined joint constraints (Andersen, Damsgaard, & Rasmussen, 2009;
Duprey, Cheze, & Dumas, 2010). The joint constraints can be added between segments and
restrict the relative motion between them. This is accomplished by creating one or more IK
chains. The IK chain must start with a root segment, which in this study was the pelvis
segment. A root segment has the global coordinate system as a parent segment and is
connected to the laboratory with six degrees of freedom. Once the root segment is added, the
remainder of the IK chain can be built. When building the IK model we need to specify the
motion that is permitted between two segments. The hip joint was defined as a spherical joint
with 3 degrees of freedom (flexion/extension, abduction/adduction and internal/external
rotation); the knee was defined as a pin joint with one degree of freedom (flexion/extension)
and the ankle was defined as a universal joint with 2 degrees of freedom (dorsi/plantaflexion
and internal/external rotation).
For the kinetic data calculation, the mass properties are based on Dempster’s (1955) anthropometric data and the moments of inertia properties are based on Hanavan’s study
(1964). Ground reaction force (GRF) was collected with a Kistler force plate (type: 9865B).
2.2
Electromyography
This subsection refers to the methodology used to obtain the neuromuscular data
analyzed more in detail in chapters three and six. The electric activity from five muscles of the
dominant lower limb was recorded: tibialis anterior (TA), gastrocnemius medialis (GM), soleus (SOL), vastus lateralis (VL) and biceps femoris (BF). The participant’s skin was shaved, gentle
abraded and cleaned with alcohol. Afterwards, the surface electrodes (Ambu Blue Sensor
N-00-S/25) were placed with an inter-electrode distance of 20mm, in accordance with the
SENIAM Project recommendations (Hermens, Freriks, Disselhorst-Klug, & Rau, 2000). TA:
electrodes placed at 1/3 on the line between the tip of the fibula and the tip of the medial
Chapter 2
36 of the leg. SOL: electrodes placed at 2/3 of the line between the medial condylis of the femur
to the medial malleolus. VL: electrodes placed at 2/3 on the line from the anterior superior
spina iliaca to the lateral side of the patella. BF: electrodes placed at 50% in the direction of
the line between the ischial tuberosity and the lateral epicondyle of the tibia. A ground
electrode was placed over the C7 vertebrae. The EMG data were transmitted using a
telemetric system (Glonner Biotel 88) and collected at 1kHz. The EMG signals were processed
through a 32bit A/D board synchronized with the force platform and the motion capture
system. The processing of the EMG data is explained more in detail in the correspondent
chapters.
2.3
Segmental and muscle induced acceleration analysis
In this subsection we intend to explain the induced acceleration analysis (IAA),
performed using a model without muscles and another one with muscles. IAA is a technique
based in the dynamic coupling effect caused by the multi-articulated nature of the body (Zajac,
1993, 2002; Zajac & Gordon, 1989). Dynamic coupling means that when a muscle contracts it
produces acceleration, not only in those segments that are spanned by that muscle but on all
body segments of the chain, due to the intersegment forces. Thus, this technique allows the
direct quantification of a joint moment contribution to the acceleration of each joint of the
body and to the acceleration of the body center of mass. The dynamic equations of motion can
be expressed in the following form:
(Eq.2-1)
where s the joint accelerations matrix, is the inverse inertia matrix (where the
segments inertial parameters and center of mass positions are taken into account), is the
joint moments matrix, is the Coriolis terms matrix and is the Gravitational terms matrix. To
isolate the contribution of one particular joint moment to the acceleration of all the joints of
the model it is assumed that all the other joints have moments and stiffness equal to zero.
Given equation 2-1, and terms are set to zero allowing us to obtain the accelerations
produced by each one of the joint moments (Kepple, Siegel, & Stanhope, 1997). The
Chapter 2
37 (Eq.2-2)
In chapter 6, a model with muscle actuators was used. For this case, the IAA was used
to compute the contributions of individual muscles to the acceleration of the body mass center
(Hamner, Seth, & Delp, 2010; Zajac & Gordon, 1989). The equations of motion for multibody
dynamic systems were solved.
(Eq.2-3)
where is a vector of inertial forces and moments; is a vector of centrifugal
and Coriolis forces and moments; is a vector of gravitacional forces and moments;
is a matrix of muscle moment arms; is a vector of muscle forces; and is a vector
of external forces and moments applied to the body by the environment. And this equation,
due to the properties of the mass matrix , can be solved for the accelerations that cause
each of the forces as follows (Pandy & Andriacchi, 2010):
(Eq.2-4)
2.4
Magnetic Resonance Imaging techniques: diffusion tensor imaging
(DTI) and proton density (PD)
DTI technique relies on the correspondence between cell geometry and the anisotropic
nature of water diffusion in the muscle (Heemskerk, Sinha, Wilson, Ding, & Damon, 2010). The
theoretical basis for DTI states that self-diffusion of water in tissue is restricted by membranes
and other cellular constituents, resulting in an apparent diffusion coefficient, which is lower
than the free diffusion coefficient and is orientation-dependent for elongated structures. The
diffusion tensor can be mathematically described by a 3x3 matrix, and at least six independent
directions for the diffusion gradients must be assessed to calculate the diffusion tensor. The
three principal axes of the diffusion tensor can be calculated through a diagonalization
process, where the eigenvalues and eigenvectors are determined. These parameters give us
information regarding the shape and the direction of the diffusion, respectively (Noseworthy,
Davis, & Elzibak, 2010). Other parameters, derived from these, can be quantified: the
fractional anisotropy (FA) and the apparent diffusion coefficient (ADC). From the tracking of
Chapter 2
38 The signal obtained on Proton density weighted scans is directly proportional to the
number of available spins (hydrogen nuclei in water). It consists in a spin echo or a gradient
echo sequence, with short echo time and long repetition time. PD images are useful for
determining the muscles boundaries, due to the elevated detail in the image and tissue
differentiation capability, enabling the determination of muscle cross sectional area, and
subsequently muscle volume using simple image processing software.
2.5
References
Andersen, M.S., Damsgaard, M., & Rasmussen, J. (2009). Kinematic analysis of
over-determinate biomechanical systems. Comput Methods Biomech Biomed Engin, 12(4), 371-384. doi: 10.1080/10255840802459412
Dempster, W.T. (1955). Space requirements of the seated operator. In W.-P. A. F. Base (Ed.),
WADC Technical Report (pp. 55-159). Ohio.
Duprey, S., Cheze, L., & Dumas, R. (2010). Influence of joint constraints on lower limb
kinematics estimation from skin markers using global optimization. J Biomech, 43(14),
2858-2862. doi: 10.1016/j.jbiomech.2010.06.010
Hamner, S.R., Seth, A., & Delp, S.L. (2010). Muscle contributions to propulsion and support
during running. J Biomech, 43(14), 2709-2716. doi: 10.1016/j.jbiomech.2010.06.025 Hanavan, E.P., Jr. (1964). A Mathematical Model of the Human Body. Amrl-Tr-64-102. AMRL
TR, 1-149.
Heemskerk, A.M., Sinha, T.K., Wilson, K.J., Ding, Z., & Damon, B.M. (2010). Repeatability of
DTI-based skeletal muscle fiber tracking. NMR Biomed, 23(3), 294-303. doi: 10.1002/nbm.1463
Hermens, H.J., Freriks, B., Disselhorst-Klug, C., & Rau, G. (2000). Development of
recommendations for SEMG sensors and sensor placement procedures. J Electromyogr Kinesiol, 10(5), 361-374. doi: 10.1016/S1050-6411(00)00027-4
Kepple, T.M., Siegel, K.L., & Stanhope, S.J. (1997). Relative contribution of the lower extremity
Chapter 2
39 Lu, T.W., & O’Connor, J.J. (1999). Bone position estimation from skin marker co-ordinates using
global optimisation with joint constraints. J Biomech, 32(2), 129-134. doi: 10.1016/S0021-9290(98)00158-4
Noseworthy, M.D., Davis, A.D., & Elzibak, A.H. (2010). Advanced MR imaging techniques for
skeletal muscle evaluation. Semin Musculoskelet Radiol, 14(2), 257-268. doi: 10.1055/s-0030-1253166
Pandy, M.G., & Andriacchi, T.P. (2010). Muscle and joint function in human locomotion. Annu Rev Biomed Eng, 12, 401-433. doi: 10.1146/annurev-bioeng-070909-105259
Zajac, F.E. (1993). Muscle coordination of movement: a perspective. J Biomech, 26 Suppl 1, 109-124. doi: 10.1016/0021-9290(93)90083-Q
Zajac, F.E. (2002). Understanding muscle coordination of the human leg with dynamical
simulations. J Biomech, 35(8), 1011-1018. doi: 10.1016/S0021-9290(02)00046-5
Zajac, F.E., & Gordon, M.E. (1989). Determining muscle's force and action in multi-articular
41
Chapter
3
3
Neuromechanical changes in cyclic hopping
exercise
1
1Submitted as:
Chapter 3
42
3.1
Abstract
The purpose of this study was to investigate the effects of increasing fatigue on lower
extremity joint kinematics, kinetics and electromyographic parameters during a cyclic
unilateral jumping exercise. Nine young active adults performed repetitive unilateral jumps
with their dominant limb until complete exhaustion. With fatigue, the subjects landed with the
knee more flexed and the ankle more dorsi flexed. The vertical ground reaction force peak
decreased, as well as the ankle and knee peak joint moments of force. The joint power profiles
show a decrease in both the ankle and knee absorption and propulsion peaks but no significant
differences at the hip joint. These results are in agreement with the reduction in the
electromyography bursts of the plantar flexors, which are expected for an exhaustive
stretch-shortening cycle. At the same time, the biceps femoris muscle significantly increased its
activation in the reflex-induced activation phase, which may indicate a reduction in the knee
extensors load with the fatigue condition. No differences were found in joint stiffness,
although the vertical stiffness increased. Repetitive stretch-shortening cycle exercise appears
to induce a reduction in force and power production and using the unilateral hopping model it
is possible to study the fatigue phenomena and observe the alterations in the kinematics,
kinetics and neuromuscular pattern of the lower extremity.
3.2
Introduction
In sports movements, such as jumping, the ability to produce explosive actions is extremely important and there’s an increased mechanical demand on the joints and tissues of
the lower extremity. Markovic & Mikulic (2010) review on plyometric training, emphasizes that
this type of exercise has been used to improve neuromuscular function (Komi, 2000; Markovic,
Jukic, Milanovic, & Metikos, 2007), to improve biomechanical technique and neuromuscular
control during high impact tasks (Myer, Ford, Palumbo, & Hewett, 2005), to reduce the risk of
lower extremity injuries in team sports (Mandelbaum et al., 2005) and to induce bone, muscle
and tendon adaptations (Kubo et al., 2007). The stretch-shortening cycle (SSC) is the
mechanism of contraction behind plyometrics. Its efficiency requires a pre-activation of the
muscles preceding the eccentric phase, a short and fast eccentric phase and a short time
period between eccentric and concentric actions (Veloso, Pezarat-Correia, Armada, &
Abrantes, 1998). A pre-stretch improves the force and work output that muscles can produce
![Table 3-1: Mean and standard deviation of the kinematic and kinetic parameters assessed in the first [0%-10%] and last [0%-100%] representative hops of the exercise](https://thumb-eu.123doks.com/thumbv2/123dok_br/16927519.759538/48.892.165.748.544.1161/standard-deviation-kinematic-kinetic-parameters-assessed-representative-exercise.webp)