Deposited in Repositório ISCTE-IUL: 2018-11-05
Deposited version: Post-print
Peer-review status of attached file: Peer-reviewed
Citation for published item:
Vauclair, C.-M., Marques, S., Lima, M. L., Abrams, D., Swift, H. & Bratt, C. (2015). Perceived age discrimination as a mediator of the association between income inequality and older people´s self-rated health in the European Region. Journals of Gerontology, Series B. 70 (6), 901-912
Further information on publisher's website: 10.1093/geronb/gbu066
Publisher's copyright statement:
This is the peer reviewed version of the following article: Vauclair, C.-M., Marques, S., Lima, M. L., Abrams, D., Swift, H. & Bratt, C. (2015). Perceived age discrimination as a mediator of the
association between income inequality and older people´s self-rated health in the European Region. Journals of Gerontology, Series B. 70 (6), 901-912, which has been published in final form at
https://dx.doi.org/10.1093/geronb/gbu066. This article may be used for non-commercial purposes in accordance with the Publisher's Terms and Conditions for self-archiving.
Use policy
Creative Commons CC BY 4.0
The full-text may be used and/or reproduced, and given to third parties in any format or medium, without prior permission or charge, for personal research or study, educational, or not-for-profit purposes provided that:
• a full bibliographic reference is made to the original source • a link is made to the metadata record in the Repository • the full-text is not changed in any way
The full-text must not be sold in any format or medium without the formal permission of the copyright holders.
Serviços de Informação e Documentação, Instituto Universitário de Lisboa (ISCTE-IUL) Av. das Forças Armadas, Edifício II, 1649-026 Lisboa Portugal
Phone: +(351) 217 903 024 | e-mail: administrador.repositorio@iscte-iul.pt https://repositorio.iscte-iul.pt
Income inequality, older people´s self-rated health and perceived age discrimination in the European Region: Multilevel mediation analysis of a cross-national survey
ABSTRACT
Objectives: The relative income hypothesis predicts poorer health in societies with greater
income inequality. This article examines whether the psycho-social factors of perceived age discrimination and (lack of) social capital may help explain the adverse effect of inequality on older people´s health. Methods: Self-rated health, perceived age discrimination and social capital were assessed in the 2008/9 European Social Survey (European Social Survey Round 4 Data, 2008). The Gini coefficient was used to represent national inequalities in income in each of the 28 ESS countries. Mediation analyses (within a multilevel structural equation modelling paradigm) on a subsample of respondents over 70 years of age (N = 7,819) were used to examine whether perceived age discrimination mediates the negative effect of income inequality on older people’s self-rated health. Results: Perceived age discrimination fully mediated the associations between income inequality and self-rated health. When social capital was included into the model, only age discrimination remained a significant mediator and predictor of self-rated health. Discussion: Concrete instances of age discrimination in unequal societies are an important psycho-social stressor for older people. Awareness that the perception of ageism can be an important stressor and affect older patient's self-reported health has important implications for the way health
Keywords: Income inequality, self-rated health, older adults, age discrimination, multilevel
mediation
The relative income hypothesis posits that income inequality is associated with poor health of the whole population (Wilkinson, 2006). This link has been widely researched by epidemiologists since the 1990´s. Although there has been mixed support for the hypothesis (Lynch et al., 2004), more recent reviews and meta-analyses with comprehensive national data corroborate its validity at the country-level (Ram, 2006; Wilkinson & Pickett, 2006, 2007), for self-rated health measures(Kondo et al., 2009) and also for the health of older people (Ploubidis, Dale, & Grundy, 2012). The effect of inequality on older people´s health is especially important considering that many developed countries face increased longevity (OECD, 2009) as well as a surge in income inequalities (OECD, 2008). Thus, even a modest adverse effect of inequality on health in later life constitutes a considerable financial burden for the population (International Monetary Fund, 2012; Kondo et al., 2009). Increased life expectancy does not necessarily mean a healthy life expectancy (World Health Organization, 2004) and therefore a central question for researchers, health practitioners and policy-makers is how health can be promoted and maintained in later life (World Health Organization, 2002). In order to address this question, it is essential to knowhow income inequality affects older people´s health outcomes.
Two general and very different explanations have been offered for the inequality-health nexus (Kawachi & Kennedy, 1999). One explanation is that there is a material
pathway. Countries with greater income inequalities tend to underinvest in public resources (e.g., health care expenditure) and this affects the health of the general population
adversely (Lynch, Smith, Kaplan, & House, 2000). Yet, it has been argued that this
explanation is not sufficient for relatively ´rich´ countries, in which material conditions fulfil a minimum living standard for the large majority of the population (e.g., universal health care, clean water, food, shelter; Marmot & Wilkinson, 2001).
For these relatively wealthy countries, a psycho-social pathway has been suggested as an alternative explanation. There are many different ways in which psycho-social factors might affect people´s health (Marmot & Wilkinson, 2001), but the role of social capital has drawn most attention among social scientists and policy-makers (Kawachi, Subramanian, & Kim, 2008). Inequality has been found to be related to the erosion of social capital, which is usually measured in terms of less general trust in others (e.g., Bjørnskov, 2007; Freitag & Marc, 2011; Uslaner & Brown, 2005). This lack of trust, indicating that people do not feel they can rely on others, is thought to exert constant psycho-social stress and is therefore seen as an important explanatory variable for the inequality-health link (Kawachi, Kennedy, & Glass, 1999). Although there is conflicting empirical support for the effect of social capital on health in the literature (Kawachi, Subramanian, & Kim, 2008), recent cross-national analyses using appropriate statistical methods support the conclusion that social capital is associated with population health (Kim, Baum, Ganz, Subramanian, & Kawachi, 2011), even among older adults (Sirven & Debrand, 2012).
For older people there is another psycho-social pathway that could apply. There is empirical evidence that prejudice and discrimination against low status groups is more prevalent in unequal societies (Marmot & Wilkinson, 2001; Wilkinson & Pickett, 2007). Older people are usually seen as a low status group relative to other age groups across Western and European cultures (Abrams, Russell, Vauclair, & Swift, 2011; Garstka, Schmitt, Branscombe, & Hummert, 2004). Hence, they are part of a social group that should be especially vulnerable to prejudice in more unequal societies. There are important health implications for being part of a social group that is discriminated against. Numerous studies have shown that perceived discrimination constitutes an important psycho-social stressor with detrimental effects on health outcomes (see Pascoe & Smart Richman, 2009, for a
meta-analytic overview) and this extends to perceived age discrimination(Luo, Xu, Granberg, & Wentworth, 2011; van den Heuvel & van Santvoort, 2011; Vogt Yuan, 2007). The
experience of discrimination incorporates both a social rejection and a largely
uncontrollable event which are the two psycho-social stressors that have been found to be associated with the largest increase in stress hormones and the longest time of recovery (Dickerson & Kemeny, 2004). Stress hormones, such as cortisol, are related with
psychological, physiological and physical health functioning and can increase the risk of negative health outcomes with exposure to chronic stressors (McEwen, 1998). The common perception that older people have low social status, together with a societal context
characterized by income inequality, are likely to increase older people’s vulnerability to age prejudice. As prejudice is a stressor that chronically activates the physiological system with adverse health effects, it is likely to be an important psycho-social factor that explains how income inequality affects the health of older people.
To date, the extent to which these two psycho-social explanations (social capital and perceived age discrimination) mediate the association between income-inequality and health have not been robustly tested cross-national analyses. Nor have they been tested in a sample of older adults. Previous ecological studies have mainly focused on the role of social capital variables for the general population and have established empirical links either with inequality (e.g., Bjørnskov, 2007; Freitag & Marc, 2011; Uslaner & Brown, 2005), or with health outcomes (Kawachi et al., 1999; Mansyur, Amick, Harrist, & Franzini, 2008; Marmot & Wilkinson, 2001). A few recent studies have attempted to examine social capital as a mediator variable (e.g., Layte, 2012; Mansyur et al., 2008); however, they have not tested whether the indirect effect of social capital is significant using a multilevel structural equation modelling framework. This framework is the most appropriate analysis strategy for
clustered data (e.g., individuals nested within countries) and can indicate whether any part of the relationship between inequality and health is indeed reliably explained by the mediator variable. Furthermore, to date, no studies have tested whether perceived age discrimination explains the inequality – health relationship in older adults, and whether it explains the inequality - health link above and beyond the role of social capital.
We address this gap by testing the extent to which perceived age discrimination and social capital mediate the inequality- health nexus for older adults (aged 70 years and above) using a large set of cross-sectional data from countries belonging to the European region (European Social Survey Round 4 Data, 2008). We focus on the psycho-social pathway as we are dealing with highly developed countries (United Nations Development Programme, 2011) in which it is especially important for health practitioners and policy-makers to know whether and what kinds of psycho-social factors explain the inequality-health link for older people. We contrast social capital with perceived ageism in order to evaluate whether more generalized stressors, in the form of (lack of) social capital, or more specific stressors, in the form of concrete instances of age discrimination, are more
important in explaining the link between inequality and older people´s health.
METHODS Data source
We used data from the European Social Survey (ESS) from Round 4, 3rd edition (European Social Survey Round 4 Data, 2008). The data were collected through computer-based personal interviews in 28 countries (see Table 1) from the European region, plus Israel, in the years 2008 and 2009. They are based on random probability samples and nearly representative of the eligible residential populations in each country (aged 15 years and over). We used a subsample of older adults who are 70 years of age and beyond (N =
7,819, Mage = 76.86, SDage = 5.41). We followed the age categorization scheme that is
suggested in other age-related items in the ESS in which above 70 refers to older adults. This age categorization also has the advantage that it is well above the statutory retirement age across all ESS countries.
- Table 1 about here -
Individual-level variables
The outcome variable self-rated health was measured by the question “How is your health in general?” (1 = ‘very good´ to 5 = ‘very bad’), an item that has shown robust results particularly in older samples (Erikson, Undén, & Elofsson, 2001). Health was defined as subsuming mental and physical health. Cross-national epidemiological studies usually transform rated health rating scales into binary categories of poor versus good self-rated health (Kondo et al., 2009). The analyses are then conducted with multilevel logistic models and the odds ratio for poor self-rated health is reported. We conducted our analyses on the original rating scale (with ratings at the higher end of the scale indicating ill-health) because logistic regressions have not been evaluated yet regarding sample size and power issues in the context of the multilevel mediation analyses which are employed in this study (Preacher, Zhang, & Zyphur, 2011). The ESS does not contain any objective measures on health, yet self-rated health is often used as a proxy for objective health outcomes that are more difficult to measure (Baron-Epel, 2004). More importantly, it has strong predictive validity for mortality, future health, functional decline and the onset of disability in older populations after taking into account various risk factors (e.g., Idler & Benyamini, 1997; Idler & Kasl, 1995; Lee, 2000; Mossey & Shapiro, 1982).
The mediator variable perceived age discrimination was measured by the question “How often in the past year has someone treated you badly because of your age, for
example by insulting you, abusing you or refusing you services?” (0 = ´never´, 4 = ´very often´). This item was chosen as it refers to a very serious and more explicit expression of age discrimination than benevolent forms of age prejudice (e.g., patronizing behaviour).
The mediator variable assessing social capital was measured by asking respondents for their general trust “Generally speaking, would you say that most people can be trusted, or that you can't be too careful in dealing with people?”. The response scale ranged from 0 to 10 with higher ratings indicating more general trust. General trust is an indicator that is usually employed to assess social capital at the ecological level (Lochner, Kawachi, & Kennedy, 1999). In the context of our analyses social capital is also examined and interpreted at the aggregated country-level (see Statistical Analysis below).
We also used socio-demographic measures from the ESS to control for compositional effects: gender (1 = male, 2 = female), age, and education (ranging from 1 = ´not completed primary education´ to 7 = ´second stage of tertiary education´). In order to partial out any effect on self-rated health that might be due to individual economic characteristics, we also added a measure of socio-economic status (SES) as a covariate into the model. The ESS contains an objective measure of SES, i.e. the household´s total net income; however, data from three countries were missing on this indicator. Therefore, we used the measure on
subjective poverty as a proxy for SES (´how do you feel about your household’s income
nowadays?´ 1 = ´living comfortably on present income´ to 4 = ´ finding it very difficult on present income´).
Country-level variables
As a measure of income inequality in countries, we used the Gini coefficient ranging from zero to 100 with higher percentages expressing more inequality. Data on Gini were obtained from Eurostat for the year 2008 as published on Eurostat´s Data Explorer
webpagei. The Gini coefficient used for Turkey was only available for the year 2006. We complemented missing data on Gini from Eurostat with data from the World Income Inequality Databaseii for Israel (from 2001), Russia (from 2006) and Ukraine (from 2006).
Statistical analysis
Since the data have a clustered structure with individuals nested within countries, multilevel modelling (MLM) analyses techniques were employed in order to obtain unbiased standard errors. Ordinary regression analyses do not take into account the clustered data structure and therefore underestimate standard errors with the consequence of
overestimating the significance of the relationships. Consequently, type I errors are more likely to be committed, i.e. concluding that there is a significant relationship when in fact there is none. MLM also allowed us to include explanatory variables at both the country- and individual-level with the latter accounting for possible compositional effects that may confound the effects of interest. This means that we were able to examine whether the mediation effects remained significant after taking into account individual-level
characteristics of the respondents which may be related to our outcome variable and also differ across countries (e.g., SES). Since the cluster-level sample size is relatively low (N = 28 countries), our modelling strategy consisted of assessing the simpler mediation models first, in which we tested the hypothesized level-2 effects, and then adding the individual-level covariates. We used the software Mplus 7 (Muthén & Muthén, 1998-2012) for our analyses.
We created a 2-1-1 multilevel mediation model meaning that the independent variable (Xj) is assessed at level-2, both the mediators (Mij) and the dependent variable are
measured at level-1 (Yij) (Zhang, Zyphur, & Preacher, 2008). In other words, we expected
that income inequality as a level-2 antecedent influences the level-1 mediators (social capital or perceived age discrimination) which then affect the level-1 outcome variable
self-rated health. Similar to mediation in single-level data, we conducted the mediation analyses in three steps (Zhang et al., 2008): Step 1 showed whether there was a significant
association between the independent and dependent variable (also called total effect in the mediation model). Step 2 tested whether the independent variable predicted the mediator variable at the between-level. And Step 3 showed whether the mediator affected the dependent variable when both the independent and mediator variable are used as
predictors. The final step allowed us to evaluate the so-called indirect effect which indicates whether a significant mediation has occurred. Note that all of the paths are quantified with unstandardized regression coefficients as is typically done with these kinds of analyses (Preacher & Hayes, 2008).
Several procedures have been suggested for testing multilevel mediation within the standard multilevel modelling (MLM) framework (Preacher et al., 2011).Yet, in the case of a 2-1-1 mediation, MLM does not fully separate a between-cluster and within-cluster effect which means that it can introduce a bias in the estimation of the indirect effect and lead to very high Type-I error rates (Zhang et al., 2008). Although our focus is on the between-cluster relationships - because any mediation of the effect of a level-2 variable must also occur at the between-cluster level regardless at which level the mediator and outcome variable are assessed - it is important to differentiate the relationships at the two levels rather than combining them into a single estimate within the indirect effect (Zhang et al., 2008). One option that has recently been developed is a mediation analysis within the multilevel structural equation modelling (MSEM) framework (Preacher et al., 2011). MSEM provides unbiased estimates of the between-group indirect effect by treating the cluster-level component of the cluster-level-1 variable as latent. We provide a schematic illustration of the multilevel mediation model within the structural equation modelling paradigm in the
supplementary file (see Supplementary Figure 1). We would like to highlight that the effect of the independent variable (income inequality) on the mediator variables (social capital or perceived age discrimination) as well as the dependent variable (self-rated health) is a country-level effect because income inequality is constant within a given country and therefore variation in the independent variable cannot influence individual differences within a group (Preacher, Zyphur, & Zhang, 2010). In other words, when we estimate, for example, the influence of income inequality on age discrimination, we might find that income inequality increases an older person´s risk of experiencing age discrimination but does so for the country as a whole, making the income inequality effect a between-cluster effect. Since income inequality applies to all people within a country, it cannot account for within-country differences of any kind. As Preacher and colleagues (2010) point out, this does not mean that the independent variable has no impact on the level-1 outcome variable; it does, but only because individuals belong to clusters characterized by the independent level-2 variable.
Results Age discrimination as mediator
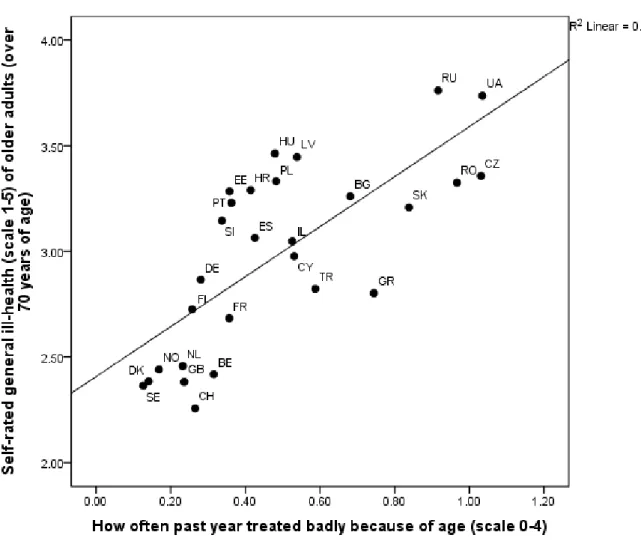
Descriptive statistics of all individual-level variables as well as sample characteristics per country are shown in Table 1. Pearson correlation coefficients show that all variables in the mediation model correlate significantly with each other at the country-level in the hypothesized direction (see Supplementary Table 1). Income inequality correlates with self-rated ill-health at r = .40, p < .05, and therefore it shares 16% of the variance with self-self-rated health of older adults. There is a strong country-level correlation between perceived age discrimination and self-rated ill-health, r = .74, p < .01. Figure 1 shows the relationship between perceived age discrimination and self-rated ill-health of older adults across ESS
countries. Some of the Nordic (Denmark, Sweden, Norway) and Western European
countries (Netherlands, United Kingdom, Switzerland, and Belgium) cluster together at the lower end of the slope, whereas Eastern European countries (Bulgaria, Slovakia, Romania, Czech Republic, Russia, and Ukraine) cluster at the higher end. There is a relatively high proportion of older people in Eastern European countries who reported incidents of age discrimination that occurred once or even more often in the past year (ranging from 38.30% in Bulgaria to 59.79% in the Czech Republic, see Table 1). In contrast, within the earlier mentioned Nordic and Western countries cluster the highest proportion of reported age discrimination was 18.72% (in Belgium) and the lowest 8.66% (in Sweden).
The intra-class correlation coefficient (ICC) from the multilevel analyses indicated that 8.4% of the total variance in experienced age discrimination and an even higher proportion of the total variance in self-rated ill-health (19.40%) were associated with differences between countries. As expected, step 1 of the mediation analysis showed that respondents perceived their health to be worse if they resided in countries with more income inequality than in countries with less inequality, B = 0.029, SE = 0.013, p < .05. The unstandardized coefficient indicates that as income inequality increases by one unit, self-rated ill-health increases by .029 units. In step 2 we found that greater income inequality predicted higher levels of perceived age discrimination, B = 0.020, SE = 0.008, p < .05. Step 3 showed that greater perceived age discrimination was associated with higher levels of self-rated ill-health, B = 1.244, SE = 0.181, p < .001, and when age discrimination was added as a mediator to the model the effect of income inequality on subjective ill-health was no longer significant, B = 0.005, SE = 0.010, p = .607. The results of the mediation analysis are shown in Figure 2. The test of the indirect effect corroborated that the effect of income inequality decreased significantly after taking into account age discrimination, B = 0.024, SE = 0.012, p
< .05. The significance of the country-level effects remained unchanged after controlling for gender (B = 0.118, SE = 0.008, p < .001), age (B = 0.018, SE = 0.002, p < .001), education (B = -0.072, SE = 0.009, p < .001), and subjective poverty (B = 0.160, SE = 0.012, p < .001) at the individual-level, and the indirect effect also remained significant, B = 0.019, SE = 0.009, p < .05.
- Figure 1 about here -
Social capital as mediator
The ICC indicated that a considerable amount of the total variance in social capital (16.3%) was associated with differences between countries. Having already established the link between inequality and self-rated health above (step 1), we proceeded to test social capital as a mediator in step 2 of the mediation analyses. Social capital was associated with lower levels of self-rated ill-health, B = -0.254, SE = 0.063, p < .001. Including social capital as the mediator to the model revealed that the effect of income inequality on self-rated ill-health was no longer significant (step 3), B = 0.008, SE = 0.014, p = .580. The test of the indirect effect showed that the effect of income inequality decreased significantly after taking into account social capital as a mediator, B = 0.021, SE = 0.007, p < .01. The
significance of the country-level effects remained unchanged after controlling for the socio-demographics gender (B = 0.119, SE = 0.027, p < .001), age (B = -0.018, SE = 0.002, p < .001), education (B = -0.068, SE = 0.012, p < .001), and subjective poverty (B = 0.164, SE = 0.012, p < .001) at the individual-level, and the indirect effect remained significant, B = 0.015, SE = 0.006, p < .05 (see also Figure 2).
Comparing age discrimination and social capital as mediators
We contrasted the two mediators in order to evaluate which one of them is the more important variable in explaining the inequality-health nexus in older adults. We
conducted pairwise contrasts of their indirect effects (Preacher & Hayes, 2008). There was no significant difference between the indirect effects for perceived age discrimination and social capital, fc without covariates = 0.009, SE = 0.012, p = 0.464; fc with covariates = 0.013, SE = 0.011, p = 0.247. It is likely that the specific indirect effect of age discrimination is attenuated
because of its high correlation with social capital at the country-level [r(27) = -.66, p < .01] and this might be the reason why it did not emerge as significantly different from the indirect effect of social capital. Although the indirect effects cannot be distinguished in terms of their magnitude, only age discrimination remained a significant predictor of self-rated ill-health and a significant mediator in the model (Bwithout covariates = 0.019, SE = 0.010, p = .07; Bwith covariates = 0.017, SE = 0.009, p < .05). Social capital was no longer significantly predicting self-rated ill-health or reliably accounting for the inequality-health link (Bwithout covariates = 0.010, SE = 0.006, p = 0.108; Bwith covariates = 0.004, SE = 0.005, p = .408, see also
Figure 2).
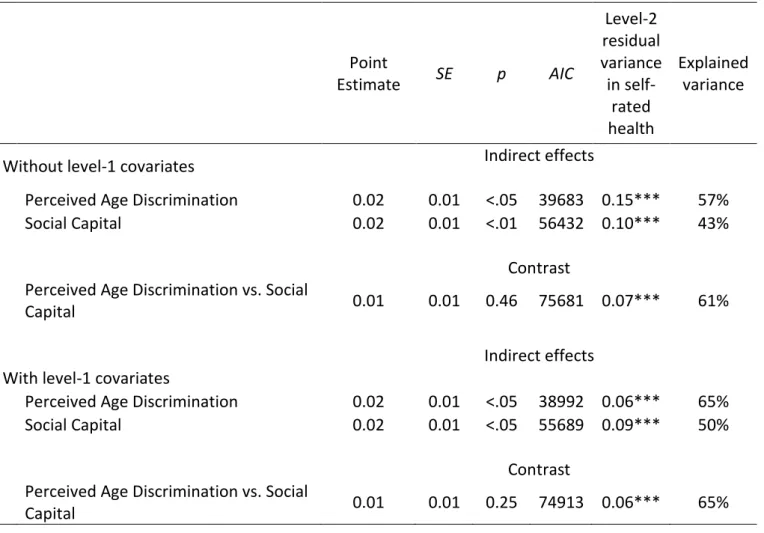
Table 2 shows an overview of all tested indirect effects, i.e. the mediating effect of age discrimination or social capital with and without level-1 covariates. It also shows the contrast of the two mediators in their ability to explain the inequality-health link. More importantly, the table shows the AIC as an information criterion that can be used for descriptive model comparisons. The model with the smallest AIC value is preferred. Note that the chi-square test cannot be used for model comparison purposes as the models containing either age discrimination or social capital as a mediator have zero degrees of freedom. Judging by the AIC, the models with level-1 covariates are better fitting than those without them. The best fitting model is the one containing age discrimination as a mediator, followed by the model that includes social capital as a mediator. The model containing both mediators is the worst fitting model of all three. This lends additional support to our finding
reported above that age discrimination is a better predictor and mediator for the inequality-health link than social capital. Given that our main interest is in explaining the between-country variation in self-reported health, we report the level-2 residual variance for each model. Table 2 shows that the residual variance decreases considerably when level-1 predictors are added into the model and is lowest for the models that contain age
discrimination as a mediator. We used Kreft and de Leeuw´s (1998) equations to compute pseudo-R2 for the models which reflect the proportional reduction of level-2 residual error
variances after including predictors in the model. Consistent with the previous indicators, the pseudo pseudo-R2 was highest for models that included level-1 covariates and age
discrimination as a mediator. These predictors explained more than half of the between-country variance (65%) in self-reported health of older people.
- Table 2 about here – - Figure 2 about here -
Discussion Main findings
We examined the relation between income inequality and self-rated health in 7,819 older people (over 70 years of age) from 27 countries in the European region, plus Israel. The evidence provides new insights into the effects of inequality on health in later life. First, it shows that the income inequality hypothesis (Wilkinson, 2006) is replicated for the self-reported health of older people across a large set of relatively wealthy countries in the European region. Second, the evidence shows that psycho-social pathways can account for the link between self-rated health and inequality after controlling for socio-demographics at the individual-level (gender, age, education, subjective socio-economic status). Both (lack
were significant mediators for the link between inequality and self-rated health in older adults. Third, when including both social capital and perceived age discrimination as
mediators, only age discrimination remained significant in the model - both as a predictor of self-reported health and as a mediator variable explaining the inequality-health link. Hence, perceived age discrimination explains unique variance over and above the social capital variable. Considering that lack of trust in others as a measure of social capital is a very general and somewhat diffuse variable associated with inequality, our findings point to the concrete psycho-social manifestations of inequality in older people that can be more easily addressed through policy-driven interventions.
It is not clear whether our model can be generalized to other forms of discrimination (e.g., sexism, racism). Generally, there is a greater orientation towards hierarchy and social dominance in unequal societies and therefore any low status group members are more likely to be evaluated negatively resulting in social exclusion and discrimination (Marmot, 2004). Therefore, it could be the case that our findings generalize to other forms of discrimination. However, further research is needed to explore this empirically.
Our results also indicate that almost one fifth of the total variance in self-rated ill-health is dependent on the country the person is residing in. There was also a sizeable amount of variation in social capital associated with between-country differences (16.3%). Yet, only 8.4% of the total variance in experienced age discrimination was due to differences between countries. The question arises to what extent the age discrimination model is
practically significant if only a small proportion of its total variance can be explained by
income inequality. There are no clear guidelines as to what constitutes a significantly large ICC, therefore the interpretation of the relative importance of between-cluster variation is largely subjective. Given that being discriminated against is mainly a psychological
experience it is not surprising that most of its variance occurs at the individual-level. Yet, the fact that individuals from some countries do, to some extent, experience more instances of age discrimination than individuals from other countries has important practical and policy implications. By changing a crucial macro-level variable, it is theoretically possible to make a difference in the lives of many at once – even if it is just a small difference. Our results also show that there is a stronger level-2 correlation between experienced age discrimination and self-rated health than between social capital and health. And it is the variable age discrimination that predicts self-rated health as a mediator over and above social capital. Hence, even if the between-country variance in experienced age discrimination is
comparably small, the associations substantiate the relevance of this variable as an important psycho-social variable in later life.
It is noteworthy that older people from the Eastern European countries show the worst self-rated health and the highest proportion of reported age discrimination. These so-called transition countries also score relatively high on the national income inequality statistic. They have experienced two critical changes in their socio-economic conditions within the last 100 years: first the period of communist take-over and then the rapid transition from a command economy to a market oriented economy. The concomitants of the most recent political changes include a relatively weak economy as well as a social and medical system which are no longer all-embracing (Daróczi, 2007). The more vulnerable members in society, such as older people, may feel that they are slipping through the safety nets that previously helped them to live at low but acceptable living standards. The
currently strong social stratification - resulting from the unequal distribution of income - may very well result in age discrimination perceptions that deal with limited access to services (e.g., adequate health services) to which older people were previously entitled to
and to which now only the very wealthy in society have full access. Yet, more studies are needed to provide a deeper insight into the health and ageism link in transition countries.
Limitations
When interpreting these findings, there are some limitations to consider. First, the cross-sectional nature of the evidence constrains interpretation of cause and effect. Yet it seems reasonable to assume that the macro-variable national income inequality is not primarily caused by age discrimination and/or self-rated health. Hence, the cause and effect question is predominantly about the association between age discrimination and health. We hypothesized that the experience of age discrimination affects older people´s health.
Evidence from longitudinal studies on discrimination (Fuller-Rowell, Evans, & Ong, 2012; Pascoe & Smart Richman, 2009), age discrimination more specifically (Luo et al., 2011) and from experiments with non-human primates corroborate our hypothesized direction of the effect (Dickerson & Kemeny, 2004; Marmot & Wilkinson, 2001; Marmot, 2004).
Furthermore, when we examined an alternative model, in which level-1 covariates were included and mediator and outcome variable were interchanged (i.e., age discrimination became the dependent variable and self-rated health the mediating variable), the indirect effect was became marginally significant, B = 0.009, SE = 0.005, p = .060, lending more support to the originally specified model with its hypothesized effects. Nevertheless, the possibility that older people´s health affects the extent to which they experience age discrimination remains very plausible. For instance, it might be that older people with poor health report more incidents of ageism because they are more exposed to situations in which age discrimination might occur (e.g., in the health setting). In reality, even a more complex bi-directional causation may apply and more research is needed to elucidate the cause and effect question in regard to these variables.
Second, the data are representative of countries within the European region so they do not necessarily generalise to other regions or continents. By using a multilevel modelling framework, we made the assumption that our clusters can be regarded as a random sample from a wider population allowing us theoretically and statistically to infer the results beyond the countries that were used in the analysis (Raudenbush & Bryk, 2002). Considering that there are other relatively wealthy regions in the world with an even greater discrepancy in the distribution of income (e.g., in the U.S.; OECD, 2008), it is plausible that there are similar or possibly even stronger relationships when the model is tested in a more diverse,
international dataset. As comparable international data on age discrimination are not yet available, more research is needed to test this hypothesis.
Third, as with most major social surveys our mediator and outcome variables were each measured by single items. However, items included in the ESS meet the highest
methodological standards in survey research to ensure reliability and validity. They are pilot tested extensively for construct validity and are subjected to scrutiny, peer review and evaluation by the ESS Central Coordinating Team. This bolsters confidence that the items are good indicators of self-rated health and serious instances of perceived age
discrimination.
Finally, using archival data constrains the choice of variables that can be included into the model as control variables. For instance, self-rated health may also be explained by the individual´s access to health care services or depressive symptoms which were not available in the ESS. Moreover, the self-rated health variable from the ESS subsumes both physical and mental health and it is unclear which of these components is affected by the predictors we examined. There is some evidence to suggest that the mental health
A recent longitudinal study with different age groups of older adults showed that as old age progresses, self-rated health becomes more closely related to psychological symptoms such as depression. In addition, Luo and colleagues´ (2011) longitudinal study revealed that perceived discrimination specifically affects emotional and mental health. Although we are not able to disentangle mental and physical health in later life, it is important to note that they affect each other, so that mental health can also have an impact on a person´s physical health (see Glaser, Robles, Sheridan, Malarkey, & Kiecolt-Glaser, 2003).
Conclusion
The health status of a nation is an important indicator of whether a population is thriving (Marmot, 2005). Given that population ageing affects countries at all levels of human development (OECD, 2009), a key issue for international policy makers is how to reduce health disparities in older adults. A number of personal factors can contribute to healthy successful ageing, such as lifestyle choices and maintaining an active way of life (World Health Organization, 2002). The present findings strongly suggest that it is not only up to the individual to stay healthy in old age, but that the societal and social context matter too. A country’s income inequality creates a form of ´social inequality´ in which older people are more likely to be discriminated against. This finding is all the more concerning
considering that income inequalities are predicted to increase in the future (OECD, 2008), suggesting that prejudice and discrimination - an important psycho-social stressor - may increase too. Population ageing already puts a great strain on public and private budgets (International Monetary Fund, 2012). However, these findings provide important insights to key challenges more developed countries face in how to prolong the healthy, active years in the ageing population. Policy initiatives targeted at promoting health in later life need to take into account a multilevel perspective in order to be effective.
The results are consistent with other research showing the detrimental impact of ageist practices on older people’s functioning and health (Abrams et al., 2008; Levy, 2009; Swift, Lamont, & Abrams, 2012). Especially in more unequal countries, it is important that politicians and health practitioners are aware of the health risks that age discrimination poses for older people. Some studies suggest that health practitioners are subjected to the same type of social stereotypes and the same type of attitudes towards stigmatized groups as the general population (e.g., Blumberg & Mellis, 2007).Research in other domains (e.g., obesity) has shown that it may be hard for practitioners to escape the effects that these types of representations have on the way they diagnose and treat patients (Wigton & McGaghie, 2001).Moreover, health practitioners may even hold more negative representations of stigmatised groups such as older people, because of the increased opportunity to interact with them who in turn confirm societal age-stereotypes of physical or cognitive decline. This is problematic given that discrimination is more likely to occur in situations when there is an opportunity to deny resources or opportunities, such as
treatment, and that it is often difficult not to make assumptions of health and competence based on age. Taking into consideration the role of age discrimination on older people’s health, it is important to recognise this influence and to develop an international policy framework in order to counteract it.
References
Abrams, D., Crisp, R. J., Marques, S., Fagg, E., Bedford, L., & Provias, D. (2008). Threat inoculation: Experienced and imagined intergenerational contact prevents stereotype threat effects on older people’s math performance. Psychology and Aging, 23, 934– 939.
Abrams, D., Russell, P. S., Vauclair, C.-M., & Swift, H. (2011). Ageism in Europe and the UK. Findings from the European Social Survey. A Report from EURAGE (European Research
Group on Attitudes to Age) commissioned by Age UK.
Baron-Epel, O. (2004). Self-reported health. In Anderson NB (Ed.), Encyclopedia of health
and behavior (pp. 714–719.). Thousand Oaks, CA: Sage.
Bjørnskov, C. (2007). Determinants of generalized trust: A cross-country comparison. Public
Choice, 130, 1 – 21.
Blumberg, P., & Mellis, L. P. (2007). Medical students’ attitudes toward the obese and the morbidly obese. International Journal of Eating Disorder, 4, 169–175.
Daróczi, E. (2007). Ageing and health in the transition countries of Europe with focus on the Hungarian case. In United Nations Department of Economic and Social Affairs
Population Division (Ed.), Proceedings of the United Nations Expert Group Meeting on Social and Economic Implications of Changing Population Age Structures (pp. 221-252). United Nations: New York.
Dickerson, S. S., & Kemeny, M. E. (2004). Acute stressors and cortisol responses: A theoretical integration and synthesis of laboratory research. Psychological Bulletin,
130, 355–391.
Erikson, I., Undén, A.L., & Elofsson, S. (2001). Self-rated health. Comparisons between three different measures. Results from a population study. International Journal of
Epidemiology 30, 326–333
European Social Survey Round 4 Data. (2008). Data file edition 3.0. Norwegian Social Science Data Services, Norway - Data Archive and distributor of ESS data.
Freitag, M., & Marc, B. (2011). Crafting Trust. The Role of Political Institutions in a Comparative Perspective. Comparative Political Studies, 42, 1537–1566.
Fuller-Rowell, T. E., Evans, G. W., & Ong, A. D. (2012). Poverty and health: The mediating role of perceived discrimination. Psychological Science, Online first.
Garstka, T. A., Schmitt, M. T., Branscombe, N. R., & Hummert, M. L. (2004). How young and older adults differ in their responses to perceived age discrimination. Psychology and
Aging, 19, 326–335.
Glaser, R., Robles, T. F., Sheridan, J., Malarkey, W. B., Kiecolt-Glaser, J. K. (2003). Mild depressive symptoms are associated with amplified and prolonged inflammatory responses after influenza virus vaccination in older adults. Archives of General
Idler, E. L., & Benyamini, Y. (1997). Self-rated health and mortality: A review of twenty-seven community studies. Journal of Health and Social Behavior, 38, 21–37.
Idler, E. L., & Kasl, S. V. (1995). Self-Ratings of health: Do they also predict change in functional ability? The Journals of Gerontology Series B: Psychological Sciences and
Social Sciences, 50B, S344–S353.
International Monetary Fund. (2012). The financial impact of longevity risk. Global Financial
Stability Report.
Kawachi, I, & Kennedy, B. P. (1999). Income inequality and health: Pathways and mechanisms. Health services research, 34, 215–27.
Kawachi, I, Kennedy, B. P., & Glass, R. (1999). Social capital and self-rated health: A contextual analysis. American Journal of Public Health, 89, 1187–1193.
Kawachi, I., Subramanian, S. V., & Kim, D. (2008). Social capital and health: A decade of progress and beyond. In I. Kawachi, S. V. Subramanian, & D. Kim (Eds.), Social Capital
and Health (pp. 1–28). New York: Springer.
Kim, D., Baum, C. F., Ganz, M., Subramanian, S. V., & Kawachi, I. (2011). The contextual effects of social capital on health: A cross-national instrumental variable analysis. Social
Science & Medicine, 73, 1689–1697.
Kondo, N., Sembajwe, G., Kawachi, I., Van Dam, R. M., Subramanian, S. V, & Yamagata, Z. (2009). Income inequality, mortality, and self rated health: Meta-analysis of multilevel studies. British Medical Journal, 339, b4471–b4471.
Kreft, I., & De Leeuw, J. (1998). Introducing Multilevel Modeling. London: Sage Publications.
Layte, R. (2012). The association between income inequality and mental health: Testing status anxiety, social capital, and neo-materialist explanations. European Sociological
Review , 28, 498–511.
Lee, Y. (2000). The predictive value of self assessed general, physical, and mental health on functional decline and mortality in older adults. Journal of Epidemiology and
Community Health, 54, 123–129.
Levy, B. (2009). Stereotype embodiment: A psychosocial approach to aging. Current
Directions in Psychological Science, 18, 332–336.
Lochner, K., Kawachi, I., & Kennedy, B. P. (1999). Social capital: A guide to its measurement.
Health & Place, 5, 259–270.
Luo, Y., Xu, J., Granberg, E., & Wentworth, W. M. (2011). A longitudinal study of social status, perceived discrimination, and physical and emotional health among older adults. Research on Aging, 34, 275–301.
Lynch, J., Smith, G. D., Harper, S., Hillemeier, M., Ross, N., Kaplan, G. A., & Wolfson, M. (2004). Is income inequality a determinant of population health? Part 1. A systematic review. The Milbank Quarterly, 82, 5–99.
Lynch, J. W., Smith, G. D., Kaplan, G. A., & House, J. S. (2000). Income inequality and mortality: Importance to health of individual income, psychosocial environment, or material conditions. British Medical Journal, 320, 1200–1204.
Mansyur, C., Amick, B. C., Harrist, R. B., & Franzini, L. (2008). Social capital, income
inequality, and self-rated health in 45 countries. Social Science & Medicine, 6, 43–56.
Marmot, M. G. (2004). Status Syndrome: How your Social Standing Directly Affects Your
Health and Life Expectancy. London: Bloomsbury.
Marmot, M. G. (2005). Social determinants of health inequalities. Lancet, 365, 1099–1104.
Marmot, M. G., & Wilkinson, R. G. (2001). Psychosocial and material pathways in the
relation between income and health: A response to Lynch et al. British Medical Journal,
322, 1233–1236.
McEwen, B. S. (1998). Protective and damaging effects of stress mediators. New England
Journal of Medicine, 338, 171–179.
Mossey, J. M., & Shapiro, E. (1982). Self-rated health: A predictor of mortality among the elderly. American Journal of Public Health, 72, 800–808.
Muthén, L. K., & Muthén, B. O. (1998-2012). Mplus User’s Guide. Seventh Edition. Los Angeles, CA: Muthén & Muthén.
OECD. (2008). Growing Unequal? Income Distribution and Poverty in OECD Countries. OECD Publishing.
OECD. (2009). Pensions at a Glance 2009: Retirement-Income Systems in OECD Countries. OECD Publishing.
Pascoe, E. A., & Smart Richman, L. (2009). Perceived discrimination and health: A meta-analytic review. Psychological Bulletin, 135, 531–554.
Ploubidis, G. B., Dale, C., & Grundy, E. (2012). Later life health in Europe: How important are country level influences? European Journal of Ageing, 9, 5–13.
Preacher, K. J., & Hayes, A. F. (2008). Asymptotic and resampling strategies for assessing and comparing indirect effects in multiple mediator models. Behavior Research Methods,
40, 879–891.
Preacher, K. J., Zhang, Z., & Zyphur, M. J. (2011). Alternative methods for assessing mediation in multilevel data: The advantages of multilevel SEM. Structural Equation
Modeling, 18, 161–182.
Preacher, K. J., Zyphur, M. J., & Zhang, Z. (2010). A general multilevel SEM framework for assessing multilevel mediation. Psychological Methods, 15, 209–33.
Ram, R. (2006). Further examination of the cross-country association between income inequality and population health. Social Science & Medicine, 62, 779–791.
Raudenbush, S. W., & Bryk, A. S. (2002). Hierarchical Linear Models. Applications and Data
Analysis Methods (2nd ed.). Thousand Oaks, CA: Sage Publications.
Sirven, N., & Debrand, T. (2012). Social capital and health of older Europeans: Causal pathways and health inequalities. Social Science & Medicine, 75, 1288–1295
Swift, H. J., Lamont, R. A., & Abrams, D. (2012). Are they half as strong as they used to be? An experiment testing whether age-related social comparisons impair older people’s hand grip strength and persistence. BMJ Open, 2(3).
United Nations Development Programme. (2011). Human Development Report 2011: Sustainability and Equity: A Better Future for All. New York: United Nations Development Programme.
Uslaner, E. M., & Brown, M. (2005). Inequality, trust, and civic engagement. American
Politics Research, 33, 868–894.
Van den Heuvel, W. J. A., & Van Santvoort, M. M. (2011). Experienced discrimination amongst European old citizens. European Journal of Ageing, 8, 291–299.
Vogt Yuan, A. S. (2007). Perceived age discrimination and mental health. Social Forces, 86, 291–311.
Wigton, R. S., & McGaghie, W. C. (2001). The effect of obesity on medical students’ approach to patients with abdominal pain. Journal of General Internal Medicine, 16, 262–265.
Wilkinson, R. G, & Pickett, K. E. (2006). Income inequality and population health: A review and explanation of the evidence. Social Science & Medicine, 62, 1768–1784.
Wilkinson, R. G., & Pickett, K. E. (2007). The problems of relative deprivation: Why some societies do better than others. Social Science & Medicine, 65, 1965–1978.
World Health Organization. (2002). Active ageing: A policy Framework. Geneva: World Health Organization.
World Health Organization. (2004). The World Health Report 2004 - Changing History. Geneva: World Health Organization.
Zhang, Z., Zyphur, M. J., & Preacher, K. J. (2008). Testing multilevel mediation using
hierarchical linear models: Problems and solutions. Organizational Research Methods,
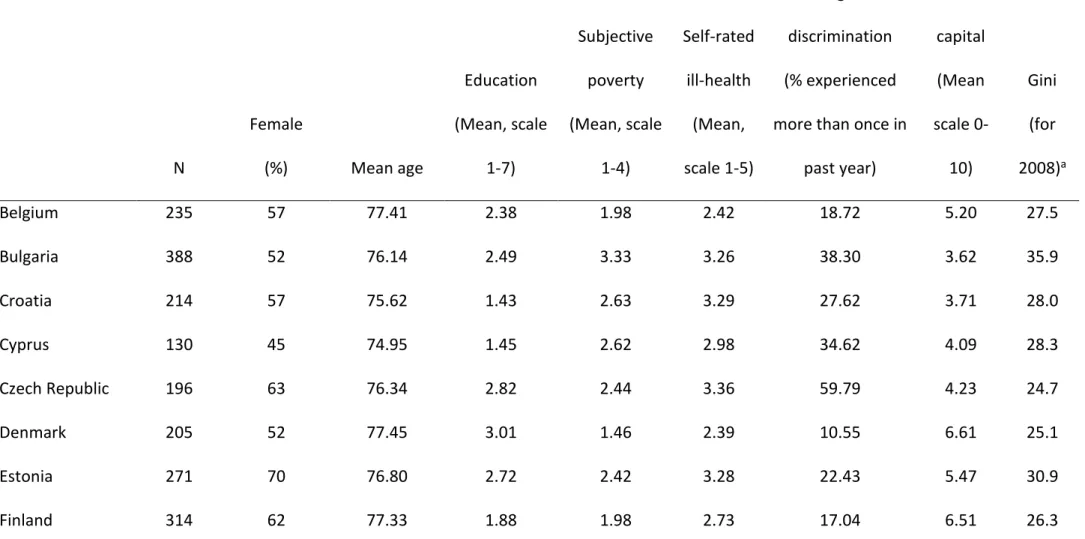
Table 1.Descriptive statistics of the country-specific samples and individual-level predictors used in the MSEM mediation analyses (data source: European Social Survey, Round 4 Data, 2008).
N Female (%) Mean age Education (Mean, scale 1-7) Subjective poverty (Mean, scale 1-4) Self-rated ill-health (Mean, scale 1-5) Age discrimination (% experienced more than once in
past year) Social capital (Mean scale 0-10) Gini (for 2008)a Belgium 235 57 77.41 2.38 1.98 2.42 18.72 5.20 27.5 Bulgaria 388 52 76.14 2.49 3.33 3.26 38.30 3.62 35.9 Croatia 214 57 75.62 1.43 2.63 3.29 27.62 3.71 28.0 Cyprus 130 45 74.95 1.45 2.62 2.98 34.62 4.09 28.3 Czech Republic 196 63 76.34 2.82 2.44 3.36 59.79 4.23 24.7 Denmark 205 52 77.45 3.01 1.46 2.39 10.55 6.61 25.1 Estonia 271 70 76.80 2.72 2.42 3.28 22.43 5.47 30.9 Finland 314 62 77.33 1.88 1.98 2.73 17.04 6.51 26.3
France 332 60 77.97 1.91 1.83 2.68 18.29 4.20 29.2 Germany 374 52 76.02 3.29 1.83 2.87 18.72 4.44 30.2 Greece 183 51 75.69 1.17 3.08 2.80 49.44 3.45 33.4 Hungary 242 60 77.48 2.00 2.67 3.46 28.93 4.07 25.2 Israel 313 53 77.42 2.62 2.13 3.05 27.99 5.63 37.2c Latvia 307 74 76.05 2.92 2.97 3.45 32.01 3.79 37.7 Netherlands 269 58 77.36 2.44 1.68 2.46 14.98 5.84 27.6 Norway 161 51 77.37 3.22 1.38 2.44 11.25 6.43 25.1 Poland 201 58 76.60 1.78 2.45 3.33 28.14 3.79 32.0 Portugal 609 66 77.22 1.00 2.82 3.23 22.24 3.45 35.8 Romania 246 54 75.67 1.98 3.02 3.33 52.52 3.67 36.0 Russia 388 71 76.31 2.51 3.17 3.76 51.58 3.60 45.1b Slovakia 250 80 76.02 2.74 2.56 3.21 53.44 3.49 23.7 Slovenia 186 63 76.63 1.77 2.16 3.15 18.48 4.31 23.4 Spain 410 56 77.71 0.74 2.16 3.06 27.11 4.75 31.1
Sweden 283 57 77.60 2.25 1.59 2.36 8.66 6.28 24.0 Switzerland 292 60 77.66 2.84 1.76 2.26 18.62 5.35 32.0 Turkey 141 49 76.24 0.62 2.66 2.82 31.16 2.30 44.8 Ukraine 300 70 76.35 2.64 3.29 3.74 53.13 4.06 41.0b United Kingdom 379 53 77.96 2.76 1.69 2.38 14.85 5.60 33.9 ESS countries (N=28) 7819 59 76.76 2.19 2.35 2.98 28.95 4.57 31.7
a Data source: Eurostat; Gini coefficient for Turkey is from the year 2006. b Data source: World Income Inequality Database for the year 2006. c Data source: World Income Inequality Database for the year 2001.
Table 2. Mediation of the effect of Income inequality on Self-rated health through Perceived age discrimination and Social capital
Point Estimate SE p AIC Level-2 residual variance in self-rated health Explained variance
Without level-1 covariates Indirect effects
Perceived Age Discrimination 0.02 0.01 <.05 39683 0.15*** 57%
Social Capital 0.02 0.01 <.01 56432 0.10*** 43%
Contrast Perceived Age Discrimination vs. Social
Capital 0.01 0.01 0.46 75681 0.07*** 61%
Indirect effects With level-1 covariates
Perceived Age Discrimination 0.02 0.01 <.05 38992 0.06*** 65%
Social Capital 0.02 0.01 <.05 55689 0.09*** 50%
Contrast
Perceived Age Discrimination vs. Social
Capital 0.01 0.01 0.25 74913 0.06*** 65%
Figure 1. Scatter plot and best fitting regression line showing average self-rated health
scores of older people (above 70 years of age) in ESS countriesa as a function of perceived age discrimination.
aBelgium (BE), Bulgaria (BG), Switzerland (CH), Cyprus (CY), Czech Republic (CZ), Germany (DE), Denmark (DK),
Estonia (EE), Spain (ES), Finland (FI), France (FR), United Kingdom (GB), Greece (GR), Croatia (HR), Hungary
(HU), Israel (IL), Latvia (LV), Netherlands (NL), Norway (NO), Poland (PL), Portugal (PT), Romania (RO), Russian
Figure 2. Multilevel mediation model showing the association between income inequality
and self-rated ill-health as mediated by perceived age discrimination (third step of the mediation analyses), social capital (assessed as general trust) or by both mediators for respondents over 70 years of age a.
a Regression coefficients are unstandardized and those in the second line are estimates based on the mediation model including individual-level covariates in the prediction of health (gender, age, education, and subjective poverty).
*p < .05 (two-tailed). **p < .01 (two-tailed). ***p < .001 (two-tailed).
Endnotes
i http://appsso.eurostat.ec.europa.eu/nui/show.do?dataset=ilc_di12&lang=en, Retrieved December 2012.