A Work Project, presented as part of the requirements for the Award of a Masters Degree in Management from NOVA – School of Business and Economics.
Can location-based mobile marketing enhance the customer experience and increase customer satisfaction and loyalty?
Astrid Gonçalves Brunner Student Number: 1067
Project carried out in the area of Marketing, under the supervision of Professor Carmen Lages
Table of Contents
Abstract ... 3
1) Introduction ... 4
2) Literature Review ... 8
2.1) Mobile Marketing and Location-Based Marketing ... 8
2.2) Customer Experience ... 10
2.3) Customer Satisfaction ... 11
2.4) Customer Loyalty ... 12
3) Research Context ... 14
3.1) iBeacon Technology ... 14
4) Research Framework and Hypotheses ... 17
5) Methodology ... 18
5.1) Data collection and Sampling ... 18
6) Main Findings ... 20 6.1) Sample Profile ... 20 6.2) Frequencies ... 20 6.3) Reliability Test ... 21 6.4) Validity Test ... 22 6.5) Inferential Analysis ... 24
6.5.1) Simple Regression Analysis ... 24
6.5.2) Mediated Regression Analysis ... 25
7) Research and Management Implications ... 26
8) Limitations and Research Directions ... 27
9) Conclusion ... 27
References ... 29
Appendix ... 32
Can location-based mobile marketing enhance the customer experience and increase customer satisfaction and loyalty?
Abstract
This study intends to explore the impact of customer experience on customer satisfaction and loyalty by trying to understand how location-based mobile marketing might enhance the customer experience. Primary data was collected from 201 smartphone users in 24 countries. Results have indicated that targeted location-based marketing positively influences customers’ experiences. Besides, the analysis has also shown a favorable impact on customers’ satisfaction and self-perceived loyalty. This suggests that location-based mobile marketing has the potential to positively add value to a customer’s experience and should therefore be considered an important tool in marketing communications.
Keywords: location-based mobile marketing; customer experience; customer
1) Introduction
As a result of the fast consumer adoption of mobile phones (see Figure 1), accompanied by a significant progress in mobile technology, mobile technological devices – thereafter referred to as “mobile” - have presented themselves as a new medium available to marketing communications (Bauer et al. 2005). Surprisingly, even in cases in which the target market is into mobile, it has been found that companies report a low spending of their marketing budget on mobile (Stuart et al. 2013) or do not seem to have a mobile marketing strategy (Hayzlett, 2014). Yet, it has been argued that organizations that do invest in mobile or put it in the center of their marketing strategy reported a clear increase in their ROI (Briggs, 2012). This might be due to the fact that companies that focus on building remarkable experiences gain massive rewards, such as customer satisfaction and loyalty (Rawson et al. 2013). Also, an increase in customer satisfaction and loyalty may result in larger market share and profitability (Anderson et al. 1994). Mobile marketing might be a resourceful tool to help achieve these desired results, due to its direct impact on all stages of the consumer decision-making process (Shankar & Balasubramanian, 2009).
These insights fueled the motivation for this study. Mobile appears to be an opportunity that has not been embraced by many organizations’ marketing effort. This study intends to understand whether location-based mobile marketing enhances the customer experience and impacts customer satisfaction and loyalty.
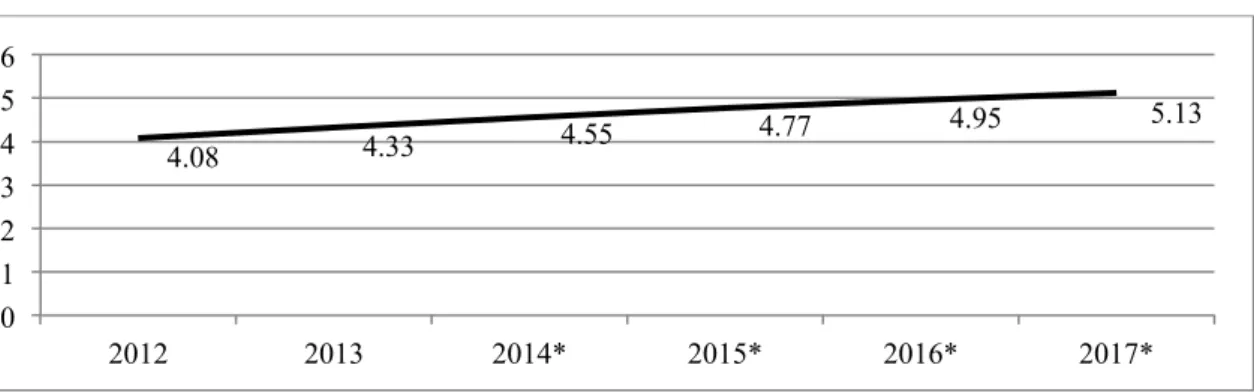
Figure 1: Mobile phone users (billions, worldwide) (Years noted with a star are estimates)
(Source: Adapted from eMarketer, December 2013)
Recent research estimated that there are approximately 4.6 billion people owning at least one mobile phone in 2014 (Figure 1). This currently represents 63.5% of the worldwide population, of which 24.4% are smartphone users (1.75 billion users).
Figure 2: Smartphone users (billions, worldwide) (Years noted with a star are estimates)
(Source: Adapted from eMarketer, December 2013)
This continually increasing number of mobile and smartphone users (Figure 2) has the potential to reach the consumer market in personalized and innovative ways.
Benefits of mobile
Compared to more traditional approaches, the main value mobile marketing provides to companies is the chance to involve the consumer either in-store or online with the brand and motivate a purchase in real time (Stuart et al. 2013). For example, an individual might get informed about a brand’s new arrivals through its mobile app or mobile website and decide to buy the products through the same medium, his smartphone.
4.08 4.33 4.55 4.77 4.95 5.13 0 1 2 3 4 5 6 2012 2013 2014* 2015* 2016* 2017* 1.13 1.43 1.75 2.03 2.28 2.5 0 0.5 1 1.5 2 2.5 3 2012 2013 2014* 2015* 2016* 2017*
Hence, mobile marketing is able to start with a marketing communication campaign and finish with the final transaction (Stuart et al. 2013). Additionally, mobile offers the opportunity to provide psychographic data enabling companies to learn more about their customers (Bieda, 2013) and thus target them more effectively, therefore offering the possibility for powerful tailored communication. Another essential point is its ability to improve communications by offering more dialogue-oriented, personalized, timely and location-specific notifications without limitations of time and place (Bauer et al. 2005; Smutkupt et al. 2010), which in turn also benefits consumers. As a consequence it also helps increasing the visibility and accessibility of the company.
The advantages for consumers rely in the fact that these receive tailored information (Andrews & Johnson, 2012) addressed to meet their expectations and needs as well as relevant messages and entertainment from a brand, thus building relationships and perhaps, as a result, loyalty to the company (Relander, 2014). The consumers can be reached in the context of their daily routines, enabling businesses to contact consumers with contextually relevant information and offers (Rohm et al. 2012). Consumers also enjoy the convenience of being able to access information and special content on-the-go. The ease of action enables consumers to save time when comparing and searching certain information on products and services (Powell, 2010).
Among the marketing benefits of mobile for organizations, the one that was most frequently referred by the academic and professional literature has been to facilitate the engagement with customers (Andrews & Johnson, 2012) through interactive relationships (Friedrich et al. 2009) and a more familiar communication (Smutkupt et al. 2010).
The customer experience
Digital could be even more important when working on enhancing the customer experience, which is perceived as any kind of impressions a customer gains from engaging with a brand. Evidence suggests that smartphones allow a stronger emotional connection with users, due to the fact that these are checked frequently and always kept close (Hinshaw, 2012). Mobile is therefore considered the heart of the customer experience, being able to improve (Castro, 2014) and complement other marketing activities (Smutkupt et al. 2010; Hinshaw, 2014). Many first encounters consumers have with a company are through mobile devices (Castro, 2014; Hinshaw, 2014). The challenge relies upon creating favorable customer experiences, which are meaningful to a mobile consumer’s shopping journey (Barry, 2014).
Although the importance of mobile or location-based marketing has been explored (Kaplan, 2012; Beldona et al. 2012), to the best of our knowledge no research has been developed on its effect on a customer’s experience. Similarly, we can find previous research on the impact of customer experience on customer satisfaction (Maklan & Klaus, 2011; Paula & Iliuta, 2007) and loyalty (Maklan & Klaus, 2011; Brakus et al. 2009; Mascarenhas et al. 2006), very little is known about both in a mobile marketing context. With the emergence of an experience economy, which focuses on creating a differentiated competitive position by designing memorable experiences (Nasermoadeli et al. 2013; Pine & Gilmore, 1998) and the potential of mobile to add value to a customer’s experience (Hayzlett, 2014), this is a field that should be thoroughly explored.
In conclusion, this study intends to explore the impact of customer experience on customer satisfaction and loyalty by trying to understand how location-based mobile
marketing might enhance the customer experience. In order to address the research problem: “the impact of customer experience on customer satisfaction and loyalty in location-based mobile marketing”, three research questions will have to be answered. First, does location-based marketing positively influence a customer’s experience? Second, is a customer’s satisfaction increased after experiencing location-based services? And lastly, is a customer’s self-perceived loyalty increased after being satisfied with location-based services?
2) Literature Review
In the following section the terms mobile marketing and more specifically, location-based marketing, will be briefly explained. Subsequently, a literature review about the central variables of this research, namely customer experience, customer satisfaction and customer loyalty will be presented, and it ends with the hypotheses for this study.
2.1) Mobile Marketing and Location-Based Marketing
The definition of the term “mobile marketing” has been changing over time, due to the constantly transforming nature of technologies and new uses. Mobile marketing has been defined as “a set of practices that enables organizations to communicate and engage with their audience in an interactive and relevant manner through and with any mobile device or network.” (Becker et al. 2009, p.1). Mobile marketing has also been understood as “using interactive wireless media to provide customers with time and location sensitive, personalized information that promotes goods, services and ideas, thereby generating value for all stakeholders” (Dickinger et al. 2004, p. 2).
Location-based marketing is based on the offer of information or entertainment using an individual’s geographical location (Jagoe, 2003). As people are constantly carrying their mobile phones, location-based marketing could clearly become a great medium for
enhancing the customer experience in different settings (O’Hara et. al 2007). For example, a certain retail store has used customers’ locations for mobile app communication. It sends a notification as soon as a customer is in proximity of the store and as soon as the customer opens the app, it starts a countdown timer at 100% off. This timer only stops when the customer gets to the store, thus the faster he/she gets there, the bigger the discount.
The location-sensitive character of mobile marketing offers the possibility to take advantage of location-based services, which are information services that can be used for entertainment, communication and marketing purposes (Steiniger et al. 2006). As such, location-based marketing could be considered a marketing communications tool (Please refer to Appendix 1 for an illustration of the different types of location-based marketing).
Thus, location-based services have recently gained significant attention due to their potential to increase mobile communications and to generate exceptionally personalized and convenient services (Dhar & Varshney, 2011). As a result, location-based marketing allows information to be targeted to the right people in order that these receive relevant notifications that is suitable for the current real time situation (Schiller & Voisard, 2004). Thus, generating more customized messages that are shorter in terms of content but more impactful to customers (Finlay, 2010).
Another advantage of location-based marketing is that it allows marketers to gather critical data from consumers, namely behaviors and journeys to be tracked in order to learn more about their wishes and preferences (Rao & Minakakis, 2003) and that vital information helps brands to target customers more effectively.
Location-based marketing is therefore a tool that offers companies the possibility to promote their products to the right people at the right time (Desai et al. 2011). This possibility is promising, providing room to be creative and to engage with customers in a fun and informal way. It has been suggested that businesses offering location-based marketing that concentrates on the customer experience with a unique, secure and premium service would encounter reliable success (Rao & Minakakis, 2003).
2.2) Customer Experience
Customer experience has been defined as “the internal and subjective response customers have to any direct or indirect contact with a company” (Meyer & Schwager 2007, p.118). This means that a customer experience can be understood as any impression, positive and negative, a customer gains from interacting with a brand. It can be seen as a general or holistic perception of the experience. In the past, a customer experience’s emphasis used to be on the use of exceptional service experiences, for instance parachuting or bungee jumping, (Brakus et al. 2009) and ordinary experiences were not taken into account (Carù and Cova, 2003). Nowadays, its significance is known and subsequently, enhancing the customer experience of ordinary activities, such as going for lunch in a restaurant, is the aim of businesses in various sectors.
Businesses are currently focusing in generating engaging and lasting experiences (Gilmore and Pine, 2002) as well as creating value for customers (Fudenberg, 2000). Today, the emotional relationship with a brand or company through an experience is the main differentiating aspect customers perceive (Mascarenhas et al. 2006).
The focus of companies has also been changing over the years. Quality, functionality, brand and price were important characteristics from 1970 to 1990 and service, information and delivery a distinctive features in the early 2000s (Shaw and Ivens,
2002). Currently, the challenge relies in the fact that today’s customer has constantly changing expectations with high demands and selectivity (Paula & Iliuta, 2007). Therefore exceeding customers’ expectations and, as a result, providing outstanding customer experience has become companies’ desire, leading to the creation of the concept of customer experience management (Smith & Milligan, 2002). Experience-based marketing is so important that the so-called “new experience economy” has been suggested as a method to shift away from the commoditization of products and services (Pine & Gilmore, 1999). Nevertheless, the customer experience has a strong personal character, existing solely in a person’s mind that has been involved on an emotional, physical and intellectual level (Pine & Gilmore, 1998). This element makes it harder to design, control and measure, since each person has a different experience.
Since location-based mobile marketing has the objective to contribute to the customer experience in a positive way by creating an engaging user experience, this study intends to look at the actual influence of this technology on users’ perceptions.
2.3) Customer Satisfaction
Satisfaction is described as an emotional response of consumers to the gap between the expected service and the actually perceived service (Brady et al. 2001; Cronin et al. 2000). Satisfaction can also be understood as an accumulation of a sequence of customer experiences or it can likewise be seen as the final result of the good experiences minus the bad ones (Meyer & Schwager 2007). Similar to this, satisfaction has been illustrated as “an evaluation of an emotion” (Hunt, 1977, pp. 459–460), which is created after experiencing a tangible or intangible product (Parasuraman et al. 1991). In conclusion, satisfaction is the post-purchase assessment, meaning the comparison of pre-purchase expectations with the actual performance (Zikmund et al. 2003).
Due to its importance in consumer behavior and retention (Anderson & Fornell, 1994), customer satisfaction is a concept that has been seen as a central point to the marketing literature (Bitner & Hubbert, 1994) and is the focus of many types of businesses. In fact, customer satisfaction benefits businesses in several ways (Mohr & Bitner, 1995), leading to repurchase intentions and customer retention as well as having positive effects on profitability (Reichheld & Sasser, 1990). It has gained even more importance in the services industry (Spreng & Mackoy, 1996), since customer satisfaction is identified as an evaluative and emotion-based feedback to a service encounter (Oliver, 1977) or a pleasurable fulfillment.
Thus, the satisfaction of customers’ needs and wants results in favorable post-purchase activities, such as attitude change, positive word-of-mouth, repeat purchase as well as loyalty (Churchill & Surprenant, 1982). Nevertheless, although it is believed by some that customer satisfaction always leads to loyalty (Anderson & Fornell, 1994), there is research stating the contrary.
According to Reichheld (1993) customer satisfaction by itself is not the only factor resulting in customer loyalty, due to the fact that loyalty also depends on other drivers. Satisfaction can be seen as the key to loyalty, by reason that completely satisfied customers have the tendency to become loyal customers (Paula & Iliuta, 2007).
2.4) Customer Loyalty
Customer loyalty is a “deeply held commitment to rebuy or repatronize a preferred product/service consistently in the future, thereby causing repetitive same-brand or same brand-set purchasing, despite situational influences and marketing efforts having the potential to cause switching behavior” (Oliver 1997, p. 392). In brief, a customer who is considered loyal would not switch to another business even if he or she could do
so. Thus, Jones & Sasser (1995) state that loyalty is the feeling of attachment or affection for a firm’s people, products or services. According to Kotler (2003), loyalty has the advantage of giving a sort of protection from competitors and stronger control when planning marketing activities. In addition to that, loyalty prevents customers’ switching behavior and gives businesses a long-term competitive advantage (Gremler & Brown, 1996).
Customer loyalty can be divided into three different kinds, namely behavioral, attitudinal and situational loyalty (Chaudhuri & Holbrook, 2001). The behavioral type is seen as an effect of customer satisfaction noticed by a regular purchase behavior and can be described as a polygamous behavior (Uncles et al. 2003). Attitudinal loyalty, on the other hand, is considered as a strong relationship with the brand, explicitly choosing a certain brand over its competition as well as influencing other people with positive word-of-mouth and by having a monogamous behavior. Situational loyalty shows a promiscuous behavior and has a conditional nature, meaning that it only takes place under certain conditions that are favorable for the customer, such as discounts (Mascarenhas et al. 2006).
In conclusion, customer loyalty has the advantage of increasing a company’s profit through a raise in revenues, at the same time helping reduce costs to acquire new customers, since loyal customers tend to recommend a business to other potential ones. On top of that, it decreases the customer-price sensitivity (Reichheld & Sasser, 1990). Amongst others, Oliva et al. (1992) researched the relationship between customer satisfaction and loyalty, getting to the conclusion that it is nonlinear. This means loyalty is usually unaffected by differing degrees of satisfaction and dissatisfaction (Oliva et al.
1992). Contrariwise, Ruyter & Bloemer (1998) appoint that satisfaction and loyalty are associated with each other in a positive way at most times.
As such this study will try to contribute by considering their relationship in the mobile marketing context.
3) Research Context 3.1) iBeacon Technology
The new wave of location-based applications is set to change mobile marketing and shopping, generating modern and creative possibilities (Quelch & Jocz, 2012). One of such innovations is the iBeacon technology. iBeacon represents an innovative type of low-powered, low-cost transmitters, which are able to notify close mobile devices of their presence. By placing beacons (see Figure 3 for some models) around a certain location, smartphone apps send notifications to users whenever they pass by beacons. Depending on a customer’s location in a store, this person may receive different targeted notifications after walking in front of one of these beacons.
The iBeacon technology was used in the context of this research, when measuring the customer experience, satisfaction and loyalty in the questionnaire. Respondents were asked to evaluate their experience based on the use of an application that worked together with iBeacons in order to enhance the shopping experience (see Appendix 2). The iBeacon technology is recent, since it was announced together with Apple’s iOS7 during the World Wide Developer Conference on June 10th, 2013. iBeacon is a technology that uses Bluetooth Low Energy (BLE) in order to offer users location-aware notifications and services on their mobile devices. Beacons are small wireless sensors set indoors, which transfer data to mobile devices using BLE (Gottipati, 2013).
When using iBeacon, businesses have precise information about customers’ in-store locations (i.e. micro-location), offering the chance to deliver highly contextual, hyper-local, relevant messages and promotions on their mobile phones.
Figure 3: Beacons in the market
(Source: Qualcomm, 2014; Estimote, 2014; PunchThrough, 2014; Roximity, 2014; BeaconInside, 2014; Sensorberg, 2014)
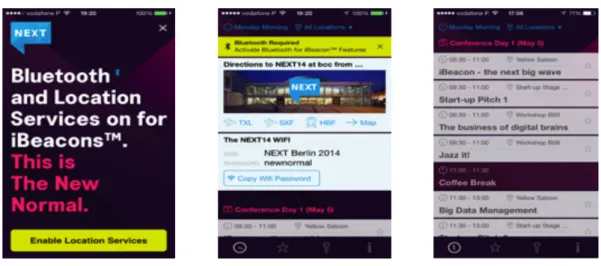
An example of beacons being used in an event setting includes the NEXT conference, a digital conference held in Berlin, Germany, on May 5th and 6th, 2014 (Figure 4). Visitors that had downloaded the event’s app, named NEXT Now, were able to receive special information every time they passed by beacons.
Figure 4: Next Now App
(Source: Screenshots from the NEXT Now application, Germany, 2014)
The example of the NEXT Now application had the objective to enhance the conference experience of its app users. On top of regular application features, such as schedules of sessions, the NEXT Now application enabled communication with conference speakers,
thus offering the possibility to connect with these on social media (Next14, 2014). With the help of beacons, some features provided the possibility to find out what sessions were near or upcoming and even to get special content regarding the session a person is attending at the moment (Next14, 2014).
For that reason, Bluetooth Low Energy used in iBeacons has been considered an “emerging wireless technology” (Gomez et. al 2012, p.11735). The iBeacon technology has several benefits and opportunities to succeed in the market (see Figure 5) as well as the potential to transform how businesses and consumers communicate with each other.
Figure 5: Strengths and weaknesses of iBeacons
Strengths Weaknesses
Exact micro-location targeting and indoor usability without requiring a wi-fi
connection.
User needs the businesses’ app, which in turn has to be running as well as a
BLE compatible device. Battery efficiency
(2 months – 2 years) and low-cost (US$ 0 – US$ 99)
Bluetooth and location services have to be turned on in smartphones. (Source: Martin, 2013)
When evaluating iBeacons strengths and weaknesses, one can identify the opportunity to add value to customers’ experiences by providing highly contextual and local offers and services, while creating a differentiation in the users’ experience. The challenge remains in promoting the use of the application and letting customers know the benefits of using it and therefore actively turning Bluetooth and the location-tracking feature on. iBeacon and other competing technologies, such as Near Field Communication (NFC), have thus the potential to transform how mobile users engage and communicate with retail shops, shopping centers, event venues, museums, games, and so forth.
4) Research Framework and Hypotheses Figure 6: Research Framework
This research intends to identify whether location-based mobile marketing has a favorable effect on a customer’s experience. Subsequently, whether it demonstrates a positive outcome on a customer’s satisfaction that will, in turn, positively affect the customer loyalty. In sum, this research study aims to empirically test and appoint the direct and mediating relationships between customer experience, customer satisfaction and loyalty through measured hypotheses. Figure 6 represents the research framework for this study.
Based on the previously mentioned research questions in the article’s introduction, the following three hypotheses were developed in order to test this research.
H1: Customer experience has a positive impact on customer satisfaction. H2: Customer experience is positively related to customer loyalty.
H3: There is a positive significant relationship between customer experience and
5) Methodology
This research started with a literature review to know what had previously been written about the variables used in this research, namely customer experience, satisfaction and loyalty, and their relationship. A conceptual framework and respective hypotheses were tested through an online questionnaire (Appendix 2).
5.1) Data collection and Sampling
The questionnaire was sent to smartphone users who were directed to an experience characterized by mobile marketing. Since this research is based on an imaginary experience, the respondents had to imagine the process of going to a store to buy a new television and receiving several targeted messages throughout the shopping journey on the store’s mobile app.
The online survey created for this research had two parts (please refer to the Appendix 2 for an illustration of the survey). Part 1 of the survey measured the three variables from this study (customer experience, customer satisfaction and customer loyalty). In this part, respondents were asked to evaluate their experience of using an in-store location-based application in a retail environment. In specific, an imaginary situation of a user going to his favorite electronics store, which has placed beacons throughout the store. Part 2 of the survey identified the respondents’ profile, including demographic and behavioral questions. Literature review has indicated that the total customer experience includes the sensory, social and emotional experience. The items of the survey for the customer experience used a four-item measurement scale adapted from Wen (2007) for the sensory experience, another four-item scale adapted from Fan & Li (2006) for the social experience and finally, a six-item scale adapted from Brengman & Geuens (2004) for the emotional experience. Additionally, in order to test customer satisfaction, a
four-item measurement scale adapted from Bitner & Hubbert (1994) was used. For the variable customer loyalty, a five-item measurement scale created by Zeithaml, Berry, and Parasuraman’s (1996), was employed in the survey.
Respondents were then asked to specify their extent of agreement according to each of the given items. A five-point Likert scale ranging from “1-completely disagree” to “5-completely agree” was applied as an opinion measurement for questions relating to the customer experience and customer loyalty as well as for behavioral questions. Sample items for measuring the customer experience included “The experience brought me great interest”. Regarding customer loyalty, items, such as “Recommending the store to someone who seeks advice” were incorporated. For the variable customer satisfaction, a five-point Likert scale anchored by “1-completely dissatisfied” to “5-completely satisfied” was applied as a satisfaction measurement for the tested variable. Sample items involved “Compared to other similar stores you have gone to...”. In addition to that, a five-point Likert scale ranging from “1-never” to “5-always” was also used to evaluate respondents’ attitudes regarding Bluetooth and the location tracking feature on their mobile phones.
A chain-referral sampling technique was used in this research as a mean to reach a wide audience (Biernacki & Waldorf, 1981). In this method, a study sample is created through recommendations made among individuals who share or know of others who meet certain prerequisites that meet the aim of the research (Biernacki & Waldorf, 1981). This research in specific performed a cross-sectional analysis directed to smartphone users of all ages, since these were seen as the target population. Respondents were informed of the voluntary and confidential conditions of the survey, which was sent through a Qualtrics link.
The sample size reached a total of 320 respondents, of which 201 responses could be used for the research, yielding a 63% response rate. 118 responses could not be taken into account, due to the fact that either respondents did not meet the requirement of having a smartphone or did not complete the survey. All responses were analyzed using SPSS software version 22.
6) Main Findings 6.1) Sample Profile
Regarding the demographic profile of the sample (Appendix 3), male respondents represented 43.8% of total respondents, while female respondents represented 56.2%. Moreover, the vast majority of respondents were between the ages of 21 to 30 (85.1%), followed by the age group of 31 to 40 years representing 8% of the sample. In terms of the country of residence, the respondents were living in Brazil (19%), Portugal (19%), Austria (13%), Germany (13%), Holland (7%), Italy (6%), the United Kingdom (4%), Spain (3%) and others (16%). Concerning the employment status, students represented 51% of the sample followed by respondents that were currently employed (41%). Based on education, 38% of the sample had a master degree, 37% a bachelor degree and 13% a graduate degree.
6.2) Frequencies
The remaining questions of the survey had the objective to assess respondents’ perceptions regarding location-based services and ascertain their opinion regarding the acceptance and adoption of location-based marketing (see Appendix 3 for the results). The majority of respondents agreed (52%) or completely agreed (13%) with the statement “mobile telephone apps that identify my location in a space and allow me to receive information about opportunities improve my consumer experience”.
Furthermore, most respondents agreed (47%) or completely agreed (15%) with “mobile telephone apps that identify my location in a space and allow me to receive information about opportunities add value to my experience”. However, on the negative side, 40% of respondents thought that “mobile telephone apps that identify my location in a space and allow me to receive information about opportunities are a threat to my privacy.” In addition, 33.7% agreed that “mobile telephone apps that identify my location in a space and allow me to receive information about opportunities are perceived as spam.”
Furthermore, respondents turn off the location-tracking feature on their mobile phones most of time (31%) or sometimes (27%). Additionally, respondents turn off Bluetooth on their smartphones always (45%) or most of the time (27%).
The app characteristics respondents value the most, are, in order of preference, ease of use (84%), time saving (66%), convenience (65%), design simplicity (62%) and security (53%). Examples of additional characteristics respondents wished to see in an app were “upgrade feature that helps improve my experience and options to suit my needs”, “user friendliness, accuracy and purposeful”, “does everything I want quickly and easily” and “exclusive deals featured on the app only”. Furthermore, venues respondents would like to see a similar kind of app - using a micro-location technology – is first the transportation and travel sectors (32%), followed by retail (20%) and restaurants (18%).
6.3) Reliability Test
In order to estimate the internal consistency reliability of the scale, Cronbach’s Alpha was used as a metric. This consistency of a measure aims to identity whether the test is reliable (Wells, 2003). This is the case when the identical result can be observed many times, meaning the stability of measurement is evident over time. According to Nunnaly and Bernstein (1994), a score above .70 is recommendable. Conversely, some argue that
a minimum reliability of .80 should be eligible or, in case of important decisions, a reliabitlity of .90 should be seen as a suitable standard. The Cronbach’s Alpha for the three constructs of this research can be seen in Table 1.
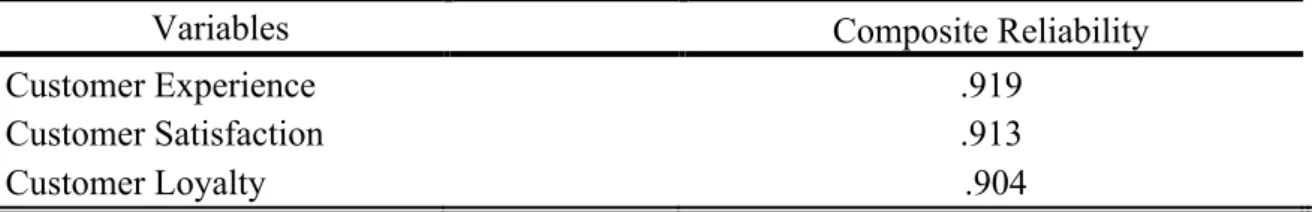
Table 1: Reliability test of variables
Variables Composite Reliability
Customer Experience .919
Customer Satisfaction .913
Customer Loyalty .904
The results reveal that the Cronbach’s Alpha for all three constructs is definitely above the .70 minimum that was recommended by Nunnaly and Bernstein (1994). The Cronbach’s Alpha of this research ranged from the lowest of .904 (Customer Loyalty) to the highest of .919 (Customer Experience). It has been shown that the result of the Cronbach’s Alpha for the three variables in this research go even beyond the optimal advised scores of .90 used in important decisions. Therefore it can be concluded that the measurement scales used in this research are reliable.
6.4) Validity Test
After approving the reliability of the measurement scales, a validity test was conducted in order to measure the construct validity. The measure will indicate its validity if it approves to measure what it is supposed to be measuring. Construct validity can be explained as the degree to which the constructs of theoretical interest have been effectively operationalized (Gebotys, 1999). As seen on Table 2, a factor analysis was conducted to support the construct validity.
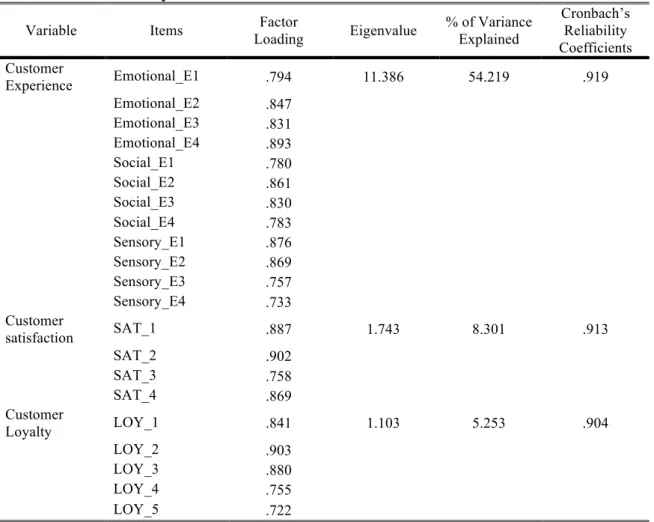
The results from Table 2 indicate that a factor analysis was suitable, due to the fact that the score of Kaiser-Mayer-Olkin (KMO) corresponds to 0.940. The KMO score measures the sample adequacy and is supposed to be between 0.5 and 1.0. Values
exceeding 0.8 can be regarded as good values and it gets better the closer it is to 1.0 (Kaiser, 1970). This confirms that a factor analysis will be helpful for these variables. Additionally, the Bartlett’s test shows a significant result (p=0.000; df=210) for all the correlations. The factor analysis extraction method used was maximum likelihood with an oblique rotation method, namely direct oblimin, thus allowing the factors to correlate. The results show three Eigenvalues greater than 1.0, ranging from the highest of 11.386 to the lowest of 1.103. Regarding factor loadings, the values indicate strong results ranging from .733 to .893, .758 to .902, and .722 to .903 on the three factors. This result shows that the factor loadings for all items were beyond 0.5, therefore supporting the construct validity.
Table 2: Factor analysis
Variable Items Factor
Loading Eigenvalue % of Variance Explained Cronbach’s Reliability Coefficients Customer Experience Emotional_E1 .794 11.386 54.219 .919 Emotional_E2 .847 Emotional_E3 .831 Emotional_E4 .893 Social_E1 .780 Social_E2 .861 Social_E3 .830 Social_E4 .783 Sensory_E1 .876 Sensory_E2 .869 Sensory_E3 .757 Sensory_E4 .733 Customer satisfaction SAT_1 .887 1.743 8.301 .913 SAT_2 .902 SAT_3 .758 SAT_4 .869 Customer Loyalty LOY_1 .841 1.103 5.253 .904 LOY_2 .903 LOY_3 .880 LOY_4 .755 LOY_5 .722 Note:
6.5) Inferential Analysis
Inferential analyses are done in order to make predictions about a population with analyses of a sample. Tests of significance inform the probability that the outcome of the analysis on the sample is meaningful and able to represent the entire population (Nie et al. 1975). This way the dimension of the relationship between the independent (customer experience) and dependent variables (customer satisfaction and loyalty) can be evaluated.
6.5.1) Simple Regression Analysis
In order to test the first hypothesis (H1) a simple regression analysis was done. As seen
on Table 3, the p value for customer satisfaction is significant being less than 0.05 and the value of the unstandardized beta coefficient is equal to 0.293. Since the change in customer satisfaction can be explained 59.8% by customer experience, it can be concluded that these variables are positively related. Thus, H1 can be supported.
Table 3: Simple regression analysis for H1
Variables Unstandardized
Beta Coefficients
t-value Significant
Customer Experience .293 17.620 .000
Note: Dependent variable: Customer Satisfaction
R = .773; R Square = .598; Adjusted R Square = .596; F = 310.451; p = .000 (p < 0.05)
After analyzing the results from Table 4, it can be seen that the linear regression for the customer experience and customer loyalty shows a significant p value of 0.000 and an unstandardized beta coefficient of 0.381. It can be concluded that 64.7% of the change in customer loyalty results from customer experience, thus supporting H2.
Table 4: Simple regression analysis for H2
Variables Unstandardized
Beta Coefficients
t-value Significant
Customer Experience 0.381 19.141 .000
Note: Dependent variable: Customer Loyalty
In sum, both linear regression analyses support the positive relationships between the three variables used in the research. To be specific, 67.7% of customer experience’s impact on customer satisfaction comes from the following four items: Sensory_E4, Social_E3, Emotional_E1, Emotional_E3. In addition, results suggest that 63% of the change in customer loyalty comes from the following four items of customer experience: Sensory_E2, Sensory_E4, Emotional_E2, Emotional_E4.
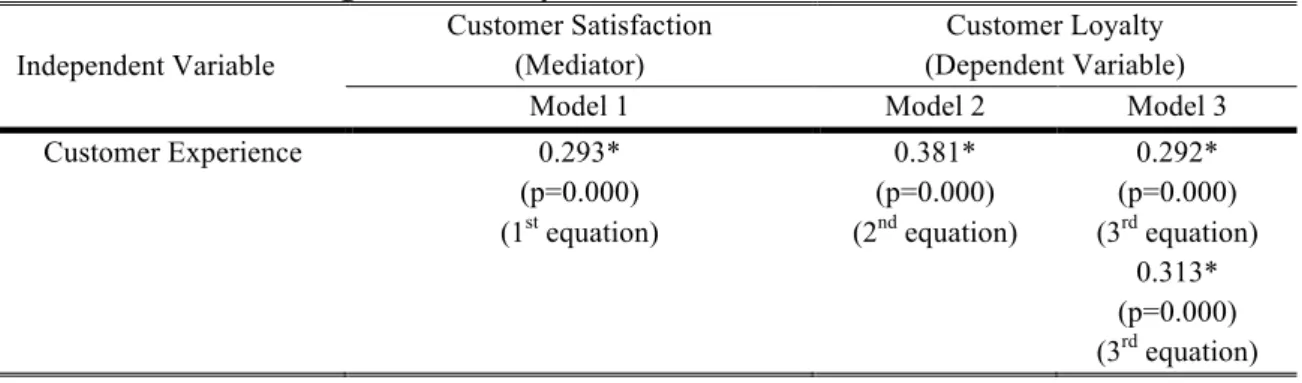
6.5.2) Mediated Regression Analysis
Mediation refers to a causal chain, where one variable impacts a second variable that, in turn, impacts a third one. Based on Baron and Kenny’s (1986) four-step approach, many regression analyses are done and significance of the coefficients is evaluated at each of the steps. The 1st step is a simple regression analysis between the independent variable (customer experience) and the mediator (customer satisfaction) and relates to the 1st
equation. The 2nd step is a simple regression analysis between the independent variable (customer experience) and the dependent variable (customer loyalty), and the last step is a regression of the dependent variable simultaneously on the independent variable and mediating variable, as seen on the two 3rd equations.
Table 5 shows the results of these equations. As seen on the 1st equation, it can be
affirmed that customer experience significantly affects customer satisfaction.
Table 5: Mediated regression analysis for H3
Independent Variable
Customer Satisfaction (Mediator)
Customer Loyalty (Dependent Variable)
Model 1 Model 2 Model 3
Customer Experience 0.293* 0.381* 0.292*
(p=0.000) (p=0.000) (p=0.000)
(1st equation) (2nd equation) (3rd equation)
0.313* (p=0.000)
(3rd equation)
The 2nd equation indicates that customer experience significantly impacts customer loyalty. Finally, the 3rd equation denotes that both customer experience and satisfaction
significantly affect customer loyalty. These equations confirm a partial mediation of the variable customer satisfaction, since all three equations indicate a significant impact on one another, thus supporting H3. It cannot be considered a full mediation due to the fact
that the inclusion of the mediation variable did not reduce the relationship between customer experience and customer loyalty to zero. In this case the mediating variable is simply responsible for some of the relationship between the independent variable and dependent variable. In sum, customer satisfaction partially acts as a mediator in mediating the relationship between customer experience and customer loyalty.
7) Research and Management Implications
This study confirms past research on the relationship between customer experience, customer satisfaction and loyalty by testing it in a new context, the location-based mobile. It confirms that location-based mobile marketing has the possibility to positively affect a customer’s experience, satisfaction and loyalty.
This study presents many managerial implications. This research offers several arguments to develop and invest in a powerful mobile marketing communications strategy and work on improving a customer’s experience through location-based marketing. Also, the behavioral questions allow identifying what characteristics users value in an app (i.e. ease of use, time saving, convenience, design simplicity and security). This can be of assistance when deciding on what attributes to emphasize when elaborating an application aimed at enhancing a customer’s experience. This suggests that applications should be designed carefully, directed at the true needs and wants of customers while focusing on avoiding intrusiveness. Spam and privacy threats are still
important concerns for customers that should always be taken into account during mobile marketing activities.
8) Limitations and Research Directions
As seen on the survey, since this research is based on an imaginary experience, respondents had to evaluate a non-real experience, in terms of perceived satisfaction and loyalty responses. Further research should focus on measuring customer experience with users that have actually used apps with a micro-location technology. Although the researcher tried to get in touch with users of the Next Now app, the number of responses was insufficient. Since there are not many applications using a micro-location technology at the moment, especially in Europe, it was challenging to find other real world alternatives.
The current sample cannot be said to be representative of the whole population (N=201). As a recommendation for further research, a longitudinal study could be of interest when assessing the observations of e.g. customer experience over different periods of time. For instance, observing the change in customer experience before, during and after the introduction of an app with a micro-location technology.
9) Conclusion
This study is about the impact of customer experience on customer satisfaction and loyalty in location-based mobile marketing. The following answers were found to the three research questions that guided this study. 1) Does location-based marketing positively influence a customer’s experience? Targeted location-based marketing is indeed perceived by the customer as positively influencing his/her experience as the majority of respondents in the sample agreed to the fact that location-based marketing increases and adds value to the customer experience. 2) Is a customer’s satisfaction
increased after experiencing location-based services? Customers’ satisfaction is certainly increased after considering an experience positive with a location-based service (as the confirmation of H1 suggests). 3) Is a customer’s self-perceived loyalty
increased after being satisfied with location-based services? Customers’ self-perceived loyalty is also increased after being satisfied with location-based services (confirmation of H2 and H3). The findings suggest that location-based mobile marketing might have an
important role in affecting a customer’s experience, satisfaction and loyalty.
References
Anderson, E. and Fornell, C. (1994). A Customer Satisfaction Research Prospectus. in R. T. Rust and
R. L. Oliver (Eds.) Service Quality: New Directions in Theory and Practice.Thousand Oaks, CA: Sage Publications, 241–268.
Anderson, E. W., Fornell, C., & Lehmann, D. R. (1994). Customer satisfaction, market share, and
profitability: findings from Sweden. The Journal of Marketing, 53-66.
Andrews, J. and Johnson, B. (2012). Ten Tips for Creating Engaging Mobile Experiences. An Oracle
White Paper, February 2012. Oracle Corporation.
Baron, R. M., & Kenny, D. A. (1986). The moderator–mediator variable distinction in social
psychological research: Conceptual, strategic, and statistical considerations. Journal of
personality and social psychology, 51(6), 1173.
Barry, J. Dr. (2014). Part I of Mobile Marketing Trends: Customer Experience Gap. Social
Content Marketing Blog. March, 2014.
Bauer, H. H., Barnes, S. J., Reichardt, T. & Neumann, M. M. (2005). Driving consumer
acceptance of mobile marketing: a theoretical framework and empirical study. Journal of
Electronic Commerce Research, 6 (3), 181-192.
BeaconInside. (2014). www.beaconinside.com - last accessed on April 17th, 2014.
Becker, M. Wehrs, M. Philbin, J. and Mandel, M. (2009). MMA Updates Definition of Mobile
Marketing. The Mobile Marketing Forum, November 2009. The Mobile Marketing Association (MMA).
Beldona, S., Lin, K., and Yoo, J. (2012). The roles of personal innovativeness and push vs pull
delivery methods in travel-oriented location-based marketing services. Journal of Hospitality
and Tourism Technology, 3(2), 86-95.
Bieda, L. (2013). Marketing Success In A Digital World: The Power Of Customer Analytics In Mobile
And Online Commerce. SAS Americas, July 2013.
Biernacki, P., and Waldorf, D. (1981). Snowball sampling: Problems and techniques of chain referral
sampling. Sociological methods & research, 10(2), 141-163.
Bitner, M. J. and Hubbert, A. R. (1994). “Encounter Satisfaction versus overall satisfaction versus
quality”, in Rust, R.T. and Oliver, R.L. (Eds), Service Quality: New Directions in Theory and Practice, Sage, London, 72-94.
Brady, M. K., Christopher, J. Robertson and Cronin, J. J. (2001). Managing behavioral
intentions in diverse cultural environments-an investigation of service value and satisfaction for American and Ecuadorian fast-food customers. Journal of International Management, 7, 129-149.
Brakus, J. J. Schmitt, B. H. and Zarantonello, L. (2009). Brand Experience: What Is It? How Is It
Measured? Does It Affect Loyalty? Journal of Marketing, Vol. 73, 52–68.
Brengman M., Geuens, M. (2004). The Four Dimensional Impact of Color on Shopper's Emotions. Adv. Consum. Res., 31: 122-128.
Briggs, R. (2012). MXS: Mobile’s X% Solution. A Marketing Evolution Whitepaper, August 2012.
Marketing Evolution.
Buczkowski, A. (2011). Types of Location Based Marketing. Retrieved from
www.geoawesomeness.com.
Carù, A. and Cova, B. (2003). Revisiting Consumption Experience: A More Humble but Complete
View of the Concept, Marketing Theory, Vol. 3, No. 2, 267-286.
Castro, J. P. (2014). How To Create A Better Experience For Your Mobile Customer. Lander App
Blog. April, 2014.
Chaudhuri, A. and Holbrook, M. B. (2001). The chain of effects from brand trust and brand affect to
brand performance: the role of brand loyalty, Journal of Marketing, Vol. 65, No. 2, 81-94.
Churchill, G. A. JR., and Surprenant, C. (1982). An Investigation Into the Determinants of
Customer Satisfaction. Journal of Marketing Research Vol. XIX, 491-504.
Cronin, J. J., Jr., Brady, M. K., Tomas, G. and Hult, M. (2000). Assessing the effects of
quality, value and customer satisfaction on consumer behavioral intentions in service environments. Journal of Retailing, 76(2), 193–218.
Desai, M. Louer, G. King and R. Wolvin, M. (2011). LBS Marketing: Why The Federal
Government Cares and What You Can Do About It. International Journal of Mobile
Dhar, S. and Varshney, U. (2011). Challenges and Business Models for Mobile Location-based
Services and Advertising. Communications of the ACM, May 2011, Vol. 54, No. 5, 122-129.
Dickinger, A. Haghirian, P. Murphy, J. and Scharl, A. (2004). An Investigation and Conceptual
Model of SMS Marketing, Proceedings of the 37th Hawaii International Conference on System Sciences, Big Island, Hawaii, January, 2004, 1-10.
eMarketer. (2014). Worldwide Mobile Phone Users: H1 2014 Forecast and Comparative Estimates,
December, 2013. Retrieved from www.emarketer.com.
Estimote. (2014). www.estimote.com - last accessed on April 17th, 2014.
Fan, X. C. and Li, J. Z. (2006). Analysis of Customers' Restaurant Experiences: An Empirical
Research. Tour. Tribune, 21(3): 56-61.
Finlay, S. (2010). Internet Shopping Irks Some. WARD’s Dealer Business, December 2010. Penton Media, Inc., 24-25.
Friedrich, R., Gröne, F. Hölbling, K. and Peterson, M. (2009). The March of Mobile Marketing:
New Chances for Consumer Companies, New Opportunities for Mobile Operators.
Journal of Advertising Research, March 2009. World Advertising Research Center Limited.
Fudenberg, D. (2000) Customer Poaching and Brand Switching. The Rand Journal of Economics,
Vol. 31, No. 4, 634-57.
Gebotys, R. Dr. (1999). Handout on Validity. Wilfrid Laurier University, March 1999.
Gilmore, J.H. and Pine, J.B. II (2002). Customer experience places: the new offering frontier.
Strategy and Leadership, Vol. 30 No. 4, 4-11.
Gomez, C., Oller, J., & Paradells, J. (2012). Overview and evaluation of bluetooth low energy: An
emerging low-power wireless technology. Sensors, 12(9), 11734- 11753.
Gottipati, H. (2013). With iBeacon, Apple is going to dump on NFC and embrace the internet of things.
Gigaom, Semptember 2013.
Gremler, D.D. and Brown, S.W. (1996). Service loyalty; its nature, importance and implications', in
Edvardsson, B., Brown, S.W., Johnston, R. and Scheuing, E. (Eds), QUIS V: Advancing Service Quality: A Global Perspective, ISQA, New York, NY, 171-81.
Hayzlett, J. (2014). Mobile, Mobile, Mobile. Marketing News, March 2014. American Marketing
Association, 26-28.
Hinshaw, M. (2012). Digital Experience: The New Heart Of Customer Engagement.
MCorpConsulting Blog, December, 2012. MCorpConsulting.
Hinshaw, M. (2014). Mobile: The New Heart Of Digital Customer Experience. CMO by Adobe.
February, 2014.
Hunt, H. K. (1977). CS/D–Overview and Future Directions, in Conceptualization and Measurement
of Consumer Satisfaction and Dissatisfaction, H. Keith Hunt (Ed.). Cambridge, MA:
Marketing Science Institute, 7–23.
Jagoe, A. (2003). Mobile Location Services: The Definitive Guide, Prentice-Hall, Upper Saddle River,
NJ.
Jones, T. O. and Sasser, E. W. (1995). Why satisfied customers defect. Harvard Business
Review, 73(6), 88-99
Kaiser, H. F. (1970). A second generation Little Jiffy. Psychometrika, 35, 401-415.
Kaplan, A. M. (2012). If you love something, let it go mobile: Mobile marketing and mobile social
media 4x4. Business Horizons, 55(2), 129-139.
Kotler, P. (2003). Marketing Management, 11th ed., Prentice-Hall, Upper Saddle River, NJ.
Maklan, S., & Klaus, P. (2011). Customer experience: are we measuring the right things?
International Journal of Market Research, 53(6), 771-792.
Martin, T. (2013). Here’s why you should be thrilled about Bluetooth 4.0. Pocketnow, May, 2013. Mascarenhas, O. A. Kesavan, R. and Bernacchi, M. (2006). Lasting customer loyalty: a total
customer experience approach. College of Business Administration, University of Detroit Mercy, Detroit, Michigan, USA. Journal of Consumer Marketing 23/7, 397-405.
Meyer, C. and Schwager, A. (2007). Understanding Customer Experience. Harvard Business
Review, 117-126.
Mohr, L. A. and Bitner, M. J. (1995). The Role of Employee Effort in Satisfaction with Service
Transactions. Journal of Business Research 32, 239-252.
Nasermoadeli, A., Ling, K. C. and Maghnati, F. (2013). Evaluating the Impacts of Customer
Experience on Purchase Intention." International Journal of Business & Management, 8.6.
Next14. (2014). Next Now – The Digital Conference Guide For NEXT14. http://nextberlin.eu/app -
last accessed on May 17th, 2014.
Nie, N. H., Bent, D. H., & Hull, C. H. (1975). SPSS: Statistical package for the social sciences (Vol.
421, pp. 250-265). New York: McGraw-Hill.
Nunnaly, J. C., & Bernstein, I. H. (1994). Psychometric theory. Sydney: McGraw-Hill.
O’Hara, K., Kindberg, T., Glancy, M., Baptista, L., Sukumaran, B., Kahana, G., and Rowbotham, J. (2007). Collecting and sharing location-based content on mobile phones in a zoo visitor
experience. Computer Supported Cooperative Work (CSCW), 16(1-2), 11-44.
Oliva, T.A., Oliver, R.L. and MacMillan, I.C. (1992). A catastrophe model for developing service
satisfaction strategies', Journal of Marketing, Vol. 56, 83- 95.
Oliver, R. L. (1997). Effect of Expectation and Disconfirmation on Post-Expense Product
Evaluations: An Alternative Interpretation, Journal of Applied Psychology, 62: 480–486.
Paula, R. M. and Iliuta, N. C. (2007). Customer Experience Management – The Most Important
Dimension of the Service Firm Strategy. Annals of the University of Oradea, Economic Science Series.
Parasuraman, A. and Berry, L. L. (1991). Marketing for Services: Competing through Quality. The
Free Press, New York, NY.
Pine, B. J. and Gilmore, J. H. (1999). The Experience Economy: Work is theatre and every business
a stage. Boston, MA: Harvard Business School Press.
Pine, B. J., & Gilmore, J. H. (1998). Welcome to the experience economy. Harvard business review, 76,
97-105.
Powell, F. (2010). Five Advantages Of Mobile Marketing Over Online. Mobile Marketer, February, 2010.
PunchThrough. (2014). www.punchthrough.com - last accessed on April 17th, 2014.
Qualcomm. (2014). www.qualcomm.com - last accessed on April 17th, 2014.
Quelch, J. A. and Jocz, K. E. (2012). Possibilities and pitfalls for location-based marketing. Market
Leader Quarter 2, 2012, Warc Ltd., 44-46.
Rao, B. and Minakakis, L. (2003). Evolution of mobile location-based services.
Communications of the ACM, 46(12), 61-65.
Rawson, A., Duncan, E., & Jones, C. (2013). The truth about customer experience. Harvard
Business Review, 91(9), 90-98.
Reichheld, F. F., and Sasser, W. E., Jr. (1990). Zero Defections: Quality Comes to Services.
Harvard Business Review, 68: 105-111.
Reichheld, F. F. (1993). Loyalty-Based Management, Harvard Business Review, 71 (March-April),
64-73.
Relander, B. (2014). How Mobile Marketing Can Benefit Your Business. Benchmark Internet Group.
February, 2014.
Rohm, A. J., Gao, T. T., Sultan, F. and Pagani, M. (2012). "Brand in the hand: A cross-market
investigation of consumer acceptance of mobile marketing." Business Horizons 55.5: 485-493.
Roximity. (2014). www.roximity.com - last accessed on April 17th, 2014.
Ruyter, K. and Bloemer, J. (1998). Customer loyalty in extended service settings: The interaction
between satisfaction, value attainment and positive mood. International Journal of Service
Industry Management, Vol. 10 No. 3, 1999, 320-336.
Schiller, J. and Voisard, A. (Eds.) (2004). Location-Based Services. Elsevier. Sensorberg. (2014). www.sensorberg.com - last accessed on April 17th, 2014.
Shankar, V., & Balasubramanian, S. (2009). Mobile marketing: a synthesis and prognosis.
Journal of Interactive Marketing, 23(2), 118-129.
Shaw, C. and Ivens, J. (2002). Building Great Customer Experiences, Palgrave Macmillan, Basingstoke. Smith, S. & Milligan, A. (2002). Uncommon Practice: People who Deliver a Great Brand
Experience. Harlow, UK: Pearson Education.
Smutkupt, P. Krairit, D. and Esichaikul, V. (2010). Mobile Marketing Implications for Marketing
Strategies. International Journal of Mobile Marketing, Winter 2010, Vol. 5., No. 2, 126-139.
Spreng, R. A. and Mackoy, R. D. (1996). An empirical examination of a model of perceived service
quality and satisfaction', Journal of Retailing, Vol. 72 No. 2, 201-14.
Steiniger, S., Neun, M., & Edwardes, A. (2006). Foundations of location based services.
Lecture Notes on LBS, 1, 272.
Uncles, M. D., Dowling, G. R. and Hammond, K. (2003). Customer loyalty and customer loyalty
programs, Journal of Consumer Marketing, Vol. 20 No. 4, 294-316.
Wells, C. S., & Wollack, J. A. (2003). An instructor’s guide to understanding test reliability.
Testing & Evaluation Services. University of Wisconsin.
Wen, T. (2007). The Impact of Customer Experience on Service Brand Equity - The Empirical
Research Based on Department Store. Dalian University of Technology, Dalian.
Zeithaml, V. A., Berry, L. L. and Parasuraman, A. (1996). The Behavioral Consequences of Service
Quality, Journal of Marketing, 60 (2), 31-46.
Zikmund, W. G., Mcleod, R. and Gilbert, F. W. (2003). Customer Relationship Management:
Integrating Marketing Strategy and Information Technology. John Wiley and Sons.Inc, USA.
Appendix
Appendix 1: Types of Location-based marketing
Type of LBM Description
Location Based Social Media Social networks, such as Foursquare and
Facebook Places allow a direct contact with the consumer.
Check-in Based Contests and Games
When a customer “checks in” in a restaurant or store, he gets rewarded with special promotions and discounts. E.g. SCVNGR is a game about doing challenges at places.
Geo-targeted Text and Display Advertising
Placing an advertisement or sending messages to mobile devices based on the users’ locations. This can either be user targeting, when companies just want to reach individuals in a specific location or message targeting that happens when there are several different messages to individuals depending on their locations.
Embedded Icons Sponsored embedded advertising, which appears without having previously searched for it but is
based on the individual’s interests.
Local Search Advertising Advertising for listings of local shops, such as
the Yellow Pages.
Location Triggered Notifications
With the usage of proximity information (e.g. wi-fi) the user receives app alerts or
notifications according to his preferences. When opted-in, notifications are received as soon as a consumer is nearby a store, and can be changed depending on the location.
Location Branded Application The use of location-based services in
brand-owned mobile apps.
Click-to-X Routing Routing e.g. calls from general campaigns to local call centers in order to get localized
information.
Appendix 2: Survey
Dear participant,
I am currently completing a Master degree in Management at Nova School of Business and Economics in Lisbon, Portugal, under the supervision of Prof. Carmen Lages. I am doing a study on marketing and customer satisfaction with mobile technology. I would like to ask you for your kind cooperation, without which I cannot complete my master thesis. Please answer to my brief questionnaire. It takes approximately 5 minutes to complete. All of your answers are treated with confidentiality and the results will only be presented in aggregated form.
If you have any questions or concerns, please feel free to contact me. Thank you.
Best regards,
Astrid Brunner (+351 918 725 432) E-mail: [email protected]
Q1 Do you have a smartphone?
q Yes q No
Situation
IMAGINARY EXPERIENCE
Imagine you want to buy a new television and decide to go to your favorite electronics store. On your mobile you have the store’s mobile app (that you have downloaded for free before). As soon as you enter the store, you receive a message welcoming you and showing you a button to be clicked if you need any assistance from a salesperson. After spending some minutes in front of the television sets, you get a message about TVs on special discount and information about them. As you reach another section, you receive a message with a recommendation for a new purchase, a home theater that will complement your TV purchase. You decide to purchase both items and pay through the store’s mobile app.
About the imaginary experience previously described with the in-store mobile application.
Q2 Please indicate your degree of agreement with the following statements about your
imaginary experience using the store’s application during your shopping trip: Completely Disagree Disagree Neither Agree nor Disagree Agree Completely Agree The experience aroused my strong sensations. q q q q q The experience brought me great interest. q q q q q The experience was very attractive. q q q q q The experience was quite worthwhile. q q q q q
Q3 From 1-Completely Disagree to 5-Completely Agree, please indicate your degree of
agreement with the following statements about your imaginary experience previously described: Completely Disagree Disagree Neither Agree nor Disagree Agree Completely Agree The experience can
promote my relationship with others. q q q q q By shopping in this establishment, I can get recognition. q q q q q By shopping in this establishment, I can find a sense of belonging. q q q q q By shopping in this establishment, I can position my social status. q q q q q
About what you felt and thought of your imaginary experience.
Q4 Please select the option that best describes your feelings about your imaginary
experience with the in-store mobile application:
q Depressed q Somewhat depressed
q Neither Contented nor Depressed q Somewhat contented q Contented
q Unhappy q Somewhat unhappy
q Neither Happy nor Unhappy q Somewhat happy q Happy q Dissatisfied q Somewhat dissatisfied q Neither Satisfied nor Unsatisfied q Somewhat satisfied q Satisfied
q Annoyed q Somewhat annoyed
q Neither Pleased nor Annoyed q Somewhat pleased q Pleased
Q5 Please state your degree of satisfaction from 1-Completely Dissatisfied to
5-Completely Satisfied with the following statements about using the in-store mobile application:
Completely
Dissatisfied Dissatisfied Somewhat Neutral Somewhat Satisfied Completely Satisfied Based on all of
your experience, how satisfied overall are you?
q q q q q Based on all my experience, I am... q q q q q Compared to other similar stores you have gone to...
q q q q q
In general I am... q q q q q
Q6 Please state your degree of agreement with the following statements about using the
in-store mobile application from 1-Completely Disagree to 5-Completely Agree. Completely Disagree Disagree Neither Agree nor Disagree Agree Completely Agree Saying positive
things about the store. q q q q q Recommending the store to someone who seeks advice. q q q q q Encouraging friends and relatives to go to this store. q q q q q Considering this store your first choice to buy products.
q q q q q
Going more to this store in the next few years.
Q7 Please state your degree of agreement or disagreement with the following statements. Completely Disagree Disagree Neither Agree nor Disagree Agree Completely Agree Mobile telephone
apps that identify my location in a space and allow me to receive information about opportunities improve my consumer experience. q q q q q Mobile telephone apps that identify my location in a space and allow me to receive information about opportunities add value to my experience. q q q q q Mobile telephone apps that identify my location in a space and allow me to receive information about opportunities are a threat to my privacy. q q q q q Mobile telephone apps that identify my location in a space and allow me to receive information about opportunities are perceived as spam. q q q q q
About you
Q8 How often do you turn off the following settings on your mobile device?
Never Rarely Sometimes Most of the Time Always Location-tracking feature q q q q q Bluetooth q q q q q
Q9 What characteristics of an app do you value the most?
(Multiple choice available) q Ease of use
q Design simplicity q Convenience q Time saving
q Shareability with social media q Security
q Personalization option q Fun
q Other ____________________
Q10 Of the following, in which venue would you most like to have this kind of app
service on your mobile device? Please choose only one. q Retail (e.g. clothing, supermarkets, etc.)
q Gyms and spas q Restaurants and cafes q Hotels
q Financial institutions
q Transportation and travel (e.g. airports, train stations, etc.) q Events
q All of the above
Q11 Please specify your gender:
q Male q Female
Q12 What is your age group?
q Under 20 q 21-30 q 31-40 q 41-50
q 51 and above
Q13 What is the highest degree or level of school that you have obtained? If currently
enrolled, please mark that degree. q No schooling completed q High school degree
q Bachelor degree or equivalent q Graduate or professional degree q Master degree or equivalent q Doctorate/PhD
Q14 What is your current occupation?
q Student q Employed q Unemployed q Retired
q Other ____________________
Q15 Please indicate your country of residence.