Rev. Caatinga
GYPSUM AND PHOSPHORUS IN IMPROVING BIOMETRIC AND
NUTRITIONAL ATTRIBUTES OF SOYBEAN/SECOND SEASON CORN
SUCCESSION
1GUILHERME FILGUEIRAS SOARES2*, SIMÉRIO CARLOS SILVA CRUZ3, TIAGO CAMILO DUARTE4, CARLA
GOMES MACHADO3, DARLY GERALDO DE SENA JUNIOR3
ABSTRACT- The objective with this work was to evaluate the effect of the agricultural gypsum, associated with phosphate fertilization, on the nutrition, development and yield of soybean and corn in succession, under no-tillage system. The experiment was conducted at Universidade Federal de Goiás, Regional Jataí, in a randomized blocks design 5x3 factorial arrangement, with 4 replicates. The first factor consisted of the gypsum
doses (0, 1, 2, 4 and 8 Mg ha-1) and the second the phosphorus doses (0, 50 and 100% of the recommended
dose). Leaf nutrient contents, leaf area index, SPAD index, dry plant mass, final plant population, one thousand grain mass and grain yield were evaluated in the crops. In the soybean, the number of pods was also obtained and in the corn the average ear length, number of rows per ear, number of grain per ear and number of ears. Phosphorus doses increase leaf Mg contents in soybean and corn. The application of gypsum reduces the Mg and K leaf contents and increases the Ca, S, and Mn contents in the two cultures. Gypsum provides increases in the SPAD index in soybean plants. The unbalance of the N / K ratio in corn leaves, provided by the increase of the gypsum doses, reduces the leaf area of this crop. Doses of P and gypsum do not influence the yield of soybeans and maize.
Keywords: Glycine max (L.). Zea mays. Gypsum. Phosphate applications.
GESSO E FÓSFORO NA MELHORIA DOS ATRIBUTOS BIOMÉTRICOS E NUTRICIONAIS DA SUCESSÃO SOJA/MILHO SAFRINHA
RESUMO- Objetivou-se com este trabalho avaliar o efeito do gesso agrícola associado à adubação fosfatada,
sobre a nutrição, desenvolvimento e produtividadeda da soja e do milho em sucessão, sob sistema plantio direto. O experimento foi conduzido na Universidade Federal de Goiás, Regional Jataí, com delineamento experimental constituído de 15 tratamentos estabelecidos em blocos casualizados em esquema fatorial 5x3,
com 4 repetições. O primeiro fator correspondeu as doses de gesso (0, 1, 2, 4 e 8 Mg ha-1) e o segundo fator às
doses de fósforo (0, 50 e 100% da dose recomendada). Foram avaliados nas culturas os teores foliares de nutrientes, índice de área foliar, índice SPAD, massa de plantas secas, população final de plantas, massa de mil grãos e produtividade de grãos. Ainda, na soja foi obtido o número de vagens e no milho o comprimento médio de espiga, número de fileiras de grãos por espiga, número de grãos por espiga e o número de espigas. As doses de fósforo aumentam os teores foliares de Mg na soja e no milho. A aplicação de gesso reduz os teores de Mg e K e aumentam os de Ca, S e Mn nas duas culturas. O gesso proporciona incrementos no índice SPAD em plantas de soja. O desbalanço da relação N/K nas folhas de milho, proporcionadas pelo incremento das doses de gesso, reduz a área foliar desta cultura. Doses de P e de Gesso não influenciam a produtividade da soja e do milho safrinha.
Palavras-chave: Glycine max (L.). Zea mays. Gessagem. Fosfatagem.
____________________
*Corresponding author
1Received for publication in 10/28/2016; accepted in 05/11/2017.
Paper extracted from the master's dissertation of the first author.
2Universidade de Brasília, Brasília, DF, Brazil; soaresgf30@gmail.com.
INTRODUCTION
As widely known, the productive potential of the cerrado soils is only reached due to the use of limestone that corresponds to an agricultural input that promotes pH correction and reduces soil toxic aluminum. However, the sole use of this correction practice is strongly questioned since superficial liming without soil revolving (as recommended in the no-tillage system) limits the corrective effect of limestone to the superficial layers (CAIRES et al., 2003). This situation requires the use of soil conditioners, such as agricultural gypsum, to neutralize aluminum and provide calcium in depth (OLIVEIRA et al., 2009; ZANDONÁ et al., 2015). The high levels of Al+ 3 and the reduction of exchangeable bases in the deeper soil layers was indicated as limiting parameters of root development and consequently a decrease in crop yield (MATTIELLO et al., 2008; NORA et al., 2014).
Agricultural gypsum is a by-product of the phosphate fertilizer industry that mainly contains calcium sulfate and small concentrations of P and F (CAIRES et al., 2003; SÁVIO et al., 2011). It is used
as a source of Ca2+ and as a soil subsurface
conditioner to reduce the toxicity of Al3+ (BROCH et
al., 2008; OLIVEIRA et al., 2009).
The conditions that can be expected with the positive effects of gypsum application on crop production continue to be unclear (CAIRES et al., 2011). It is important to highlight that the use of agricultural gypsum is not always associated with high levels of Al3+ in the subsoil. This is because gypsum is used to supply calcium in conditions of Al3+ and Ca2+ low concentrations, and this provides better root growth in depth and allows for the increased efficiency of the absorption of water and nutrients (RITCHEY; SILVA; COSTA, 1982; SORATTO; CRUSCIOL, 2008).
In studies by Zandoná et al. (2015), gypsum application allowed better soybean root development
in a no-tillage system and favored water absorption
from deeper soil layers and provided greater tolerance to the water deficit.
As previously reported, responses to gypsum application were more frequent with water deficit. However, increases in corn yield by using gypsum without water deficit were observed in studies by Caires et al. (2011) and Zandoná et al. (2015). Nevertheless, several studies did not indicate responses to gypsum applied in soybeans (CAIRES et al., 1998; 1999; 2003; NEIS et al., 2010; RAMPIM et al., 2011; MODA et al., 2013).
Thus, it is hypothesized that the increased development of the crop root system provided by agricultural gypsum as frequently reported in the literature increases the absorption efficiency of plant phosphorus due to the increased volume of soil explored since the main factors that affect phosphorus absorption by the crops correspond to the root growth rate, P concentration in the soil solution, and root mean radius (ROSOLEM; ASSIS; SANTIAGO, 1994).
Given the fore-mentioned points, the
objective of this study involves evaluating the effect of agricultural gypsum associated with phosphate fertilization on the nutrition, development, and yield of soybeans and second season corn in succession under a no-tillage system.
MATERIAL AND METHODS
The experiment was performed in Jataí, GO, growing season 2014/2015, at the Universidade
Federal de Goiás - Regional Jataí experimental area
with coordinates corresponding to 17º55'32'' S and 51º42'32'' W, and altitude of 685 m. The soil of the area was classified as LATOSSOLO VERMELHO Distroférrico (LVdf) by using the Brazilian soil classification system with a clayey texture (EMBRAPA, 2006). The predominant climate in the region corresponds to the Aw type based on the Köppen classification that is typical of the savannas with two well defined seasons, namely a dry and cold season (autumn and winter) and a hot and humid season(spring and summer).
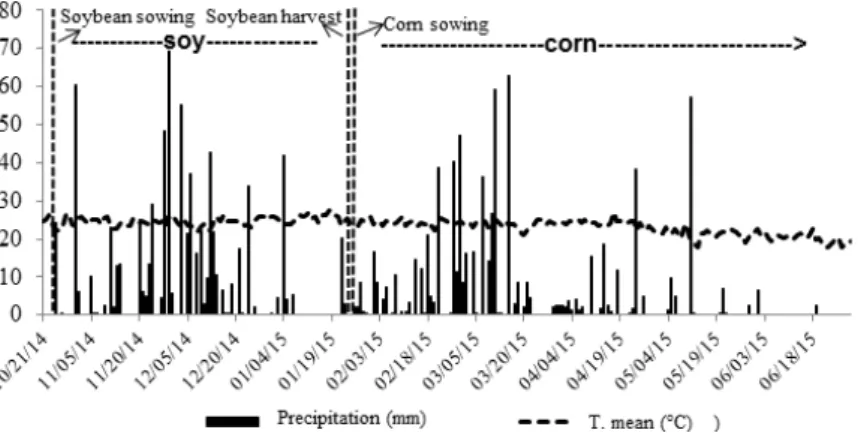
The meteorological data collected during the experiment conduction are presented in Figure 1.
Rev. Caatinga
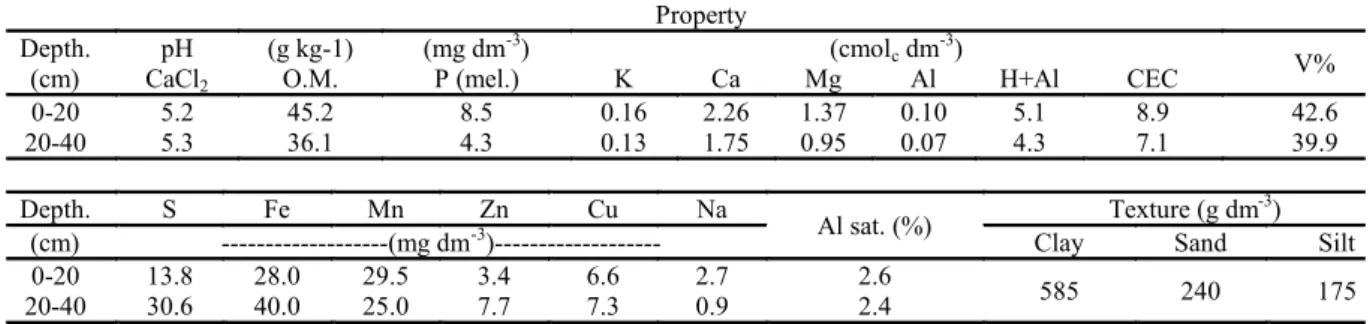
Soil samples were collected at depths corresponding to 0 to 20 cm and 20 to 40 cm (Table 1) to enable soil correction, determination of crop fertilization levels, and chemical and textural characterization of the soil in the experimental area.
The experiment consisted of 15 treatments established in a 5 x 3 factorial scheme randomized blocks design with four replications. Each plot corresponded to 11.25 m2 (2.25 x 5.00 m), and the useful area corresponded to the three central lines excluding 1 m from each end. The first factor corresponded to the gypsum doses (0 Mg ha-1, 1 Mg ha-1, 2 Mg ha-1, 4 Mg ha-1 and 8 Mg ha-1) and the second factor corresponded to the phosphorus
doses (0 kg ha-1, 40 kg ha-1, and 80 kg ha-1). These P2O5 doses represent 0%, 50%, and 100% of the recommended dose by Sousa and Lobato (2004).
Soil correction was performed with 3.0 Mg ha-1 of dolomitic limestone (RTNP = 85%)
that was applied in the area three months prior to the soybean crop seeding with a gravitational metering system and gravity distribution equipment without incorporation. The gypsum was manually and superficially applied 30 days after limestone in the area in each treatment dose. Agricultural gypsum samples were collected for chemical characterization by using the methodology described in the manual of official analytical methods (Table 2).
Table 1. Soil characterization of the chemical and textural experimental area at depths of 0-20 cm and 20-40 cm prior to the experiment.
Table 2. Chemical characterization of agricultural gypsum.
Ca S P2O5 Cu Fe Mn Zn
--- % ---
23.56 18.64 0.70 0.014 0.25 0.012 0.005
1
Property
Depth. pH (g kg-1) (mg dm-3) (cmolc dm-3) V%
(cm) CaCl2 O.M. P (mel.) K Ca Mg Al H+Al CEC
0-20 5.2 45.2 8.5 0.16 2.26 1.37 0.10 5.1 8.9 42.6
20-40 5.3 36.1 4.3 0.13 1.75 0.95 0.07 4.3 7.1 39.9
Depth. S Fe Mn Zn Cu Na
Al sat. (%) Texture (g dm
-3
) (cm) ---(mg dm-3)--- Clay Sand Silt 0-20 13.8 28.0 29.5 3.4 6.6 2.7 2.6
585 240 175
20-40 30.6 40.0 25.0 7.7 7.3 0.9 2.4
1
According to Sousa and Lobato (2004), the P
and K recommended doses corresponded to 80 kg ha-1 of P
2O5 and 80 kg ha-1 of K2O. Triple super phosphate and potassium chloride were used as sources for supplying P and K, respectively. The phosphorus doses corresponding to each treatment for the soybean crop were distributed in the planting furrow during seeding. Potassium was manually distributed in each plot on the soil surface and corresponded to 60 kg ha-1 of K
2O 15 days after sowing and the remaining 20 kg ha-1 10 days after the previous application .
The soybean sowing was performed on October 24, 2014 by using a 5-row tractor seeder
with an interval of 0.5 m between rows and 22 seeds planted per meter of the cultivar Anta
82 RR (medium cycle, 112 to 114 days and
semi-determined growth habit).
The second season corn was seeded on February 24, 2015 after the soybean harvest with the same seeder and distributed 2.8 seeds per meter of the hybrid 2B587 PW RR (early cycle, 138 days).
According to Sousa and Lobato (2004), the recommended doses of NPK to the second season corn crop corresponded to 150 kg ha-1 of N and 80 kg ha-1 of P
2O5 and K2O. The sources of these
nutrients corresponded to urea, monoammonium phosphate, and potassium chloride, respectively. The phosphorous doses, corresponding to each treatment for the corn crop were distributed at seeding in the planting furrow. Nitrogen and potassium were
superficially manually distributed in each plot 15 days after sowing. Leaf samples were collected in
the soybean crop at the beginning of flowering 27 days after emergence (DAE) and the samples were collected at full flowering for the corn crop, and this corresponded to 60 DAE. The dry material was submitted to chemical analysis to determine the N, P, K, Ca, Mg, S, Zn, Mn, Al, B, Cu, and Fe contents by following the methodology described in a study by Malavolta, Vitti and Oliveira (1997).
With respect to the flowering of the two crops, the SPAD index, leaf area index, and dry plant mass were also evaluated. The SPAD index was determined by using a chlorophyll meter (ClorofiLOG® model CFL 1030) that was operated based on the manufacturer's instructions. The leaf area index was obtained with an Accupar®
ceptometer that measured the active
determined by cutting five plants close to the soil and subsequently drying the same in an air circulation oven by maintaining a temperature in the range of 65 °C to 70 ° C.
The following components were evaluated at the soybean harvest: final plant population, number of pods, one thousand grains mass, weighting eight replicates of 100 seeds, and grain yield corrected to 13% moisture. With respect to the corn, the final plant population, number of ears, number of grain rows per ear, number of grains per ear, one thousand grains mass, and grain yield corrected to 13% moisture were determined.
The data were submitted to variance analysis at 5% and 1% of probability by the F test, and the Tukey test was used to compared the means referring to the P doses. The gypsum doses data were submitted to regression analysis calculated for linear
and quadratic equations with an acceptance level corresponding to a significance level of 5% of probability with the F test.
RESULTS AND DISCUSSION
With respect to the soybean crop, significant interaction was not observed between the doses of phosphorus and gypsum for any of the evaluated variables. Only the Mg leaf content varied based on the phosphorus doses (Table 3). Additionally, the Mg increased and corresponded to 3.53 g kg-1 in the treatment with the recommended dose
of P corresponding to 80 kg ha-1. The values
corresponded to 3.45 g kg-1 and 3.28 g kg-1 when the P dose was reduced to 40 kg ha-1 and 0 kg ha-1, respectively.
Variation Causes N P K Ca Mg S Zn Mn Fe Al
Block 10.11 ** 8.42 ** 1.71 ns 1.69 ns 2.37 ns 4.23 ns 9.88 ** 8.03 ** 1.60 ns 3.68 *
Gypsum 1.32 ns 1.66 ns 5.13 ** 17.85 ** 16.67 ** 4.86 ** 8.27 ** 2.84 ** 1.57 ns 1.57 ns Phosphorus 0.37 ns 1.02 ns 2.99 ns 2.77 ns 3.89 * 0.11 ns 0.90 ns 0.49 ns 1.00 ns 0.65 ns Gypsum x Phosphorus 1.44 ns 0.37 ns 0.80 ns 0.67 ns 0.48 ns 1.52 ns 1.38 ns 0.42 ns 1.15 ns 1.69 ns
Polynomial Regression
Equation N P K Ca Mg S Zn Mn Fe Al
Linear 2.00 ns 2.20 ns 13.12 ** 70.96 ** 65.67 ** 14.71 ** 30.22 ** 8.67 ** 0.51 ns 2.47 ns Quadratic 0.15 ns 0.01 ns 0.27 ns 0.02 ns 0.01 ns 2.11 ns 2.81 ns 0.23 ns 2.01 ns 1.59 ns
Table 3. Summary of variance analysis: block, gypsum, phosphorus, and its interactions for leaf analysis as determined in the full flowering stage of the soybean crop.
**Significant at 1% probability (p < 0.01). * Significant at 5% probability (0.01 =< p < 0.05). ns not significant
(p >= 0.05).
A reason for the increase in the Mg leaves contents with increases in the doses of P is that the P availability is an important factor for the mobilization, absorption, and translocation of Mg to the plant (ZHONG; SCHOBERT; KOMOR, 1993). Thus, an application of 100% of the recommended P dose increased the access of the plant to the nutrient and consequently increased the absorption of Mg when compared to the lower doses of P.
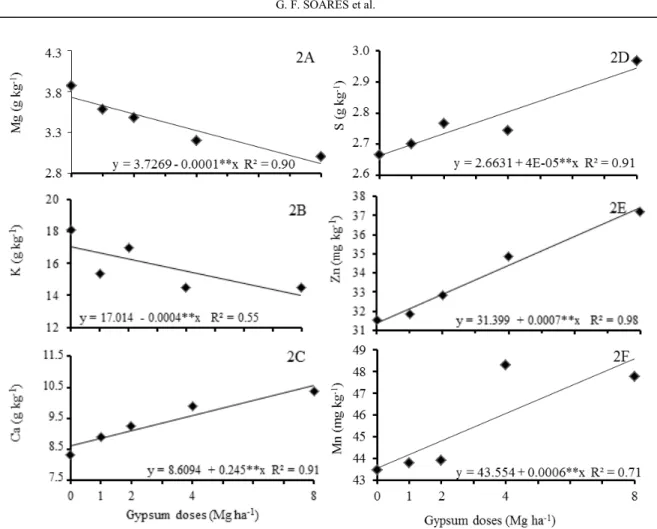
With respect to the gypsum dose variation factor, the K, Ca, Mg, and S macronutrients contents were adjusted to a linear regression equation (Table 3). The Mg and K contents decreased with increases in the gypsum doses (Figure 2A and 2B) and indicated that the application of high doses of gypsum reduces the concentration of these ions in soybean leaf at levels below those that are considered critical (MARTINEZ; CARVALHO; SOUZA, 1999). A reason for these results is related to the occurrence of competitive inhibition between K and Mg (MALAVOLTA; VITTI; OLIVEIRA, 1997) in relation to the elevation of Ca levels in soybean plant tissue (Figure 2C). This occurs when increases in ion concentration causes a partial and reversible decrease
in the absorption of another element that combines with the same charger site to cross the membrane (MALAVOLTA, 2006). This behavior may also be related to the leaching of these nutrients in the soil profile due to the use of high gypsum doses as observed in studies by Caires et al. (1999), Caires et al. (2003), and Nava et al. (2012).
The Ca and S contents increased with increases in the gypsum doses (Figure 2C and 2D). The increase in Ca and S in the leaf contents was expected since this corrective is a source of these nutrients. Increases in Ca and S concentrations in soybean leaves were also observed in other studies (CAIRES et al., 2003; CAIRES; JORIS; CHURKA, 2011; GELAIN et al., 2011).
The Zn and Mn leaf contents also increased with increases in the gypsum doses (Figure 2E and 2F). This increase is related to the presence of these micronutrients in gypsum (Table 2) since significant amounts of these micronutrients are added when high doses of the fertilizer are applied.
Rev. Caatinga
Figure 2. Leaf contents Mg (A); K (B); Ca (C); S (D); Zn (E); and Mn (F) based on the gypsum doses. (**Significant at 1% probability).
Table 4. Summary of variance analysis: block, gypsum, phosphorus, and its interactions for leaf area index (LAI), SPAD index (SPAD), dry plant mass (DM), final plant population (PP), number of pods (NP), thousand grain mass (TGM), and soybean grain yield (YIE).
Variation Causes LAI SPAD DM PP NP TGM YIE
Block 3.94 * 10.12 ** 4.68 ** 5.83 ** 4.42 ** 2.37 ns 1.62 ns Gypsum 0.58 ns 3.44 ** 0.19 ns 0.33 ns 1.68 ns 2.04 ns 1.38 ns Phosphorus 0.36 ns 0.09 ns 0.31 ns 1.25 ns 0.84 ns 0.06 ns 0.78 ns Gypsum x Phosphorus 0.80 ns 0.44 ns 0.78 ns 0.29 ns 0.44 ns 0.77 ns 1.84 ns
Polynomial Regression
Equations IAF SPAD MS PP NV PMG PROD
Linear 0.10 ns 10.35 ** 0.04 ns 0.23 ns 0.43 ns 0.27 ns 0.01 ns Quadratic 0.86 ns 3.24 ns 0.51 ns 0.26 ns 2.91 ns 4.35 ns 2.37 ns
Phosphorus IAF SPAD MS PP NV MMG PROD
0% 2.67 a 42.19 a 32.23 a 56.45 a 27.13 a 11.37 a 3187.33 a 50% 2.61 a 42.29 a 31.78 a 54.55 a 28.78 a 11.31 a 2993.30 a 100% 2.49 a 42.31 a 30.75 a 53.45 a 27.63 a 11.30 a 3097.49 a MSD 0.51 0.72 4.69 4.66 3.16 0.53 378.13
VC 25.88 2.21 19.33 11.08 14.80 6.04 15.92
**Significant at 1% probability (p < 0.01). *Significant at 5% probability (0.01 =< p < 0.05). ns not significant
(p >= 0.05).
The lack of response of phosphate fertilization potentially occurred due to the adequate P soil levels at the time of sowing the soybean crop. Thus, the soil capacity factor provided the nutrient to the soil solution and made it available to the plants. When phosphorus levels exceeded the critical level, the probability of crop response is very low or absent
(PAVINATO; CERETTA, 2004). The critical level for clay soils on the Cerrado region corresponds to
8 mg dm-3 for rainfed systems (SOUSA; LOBATO,
fertilization.
With respect to gypsum doses, it was possible to adjust a positive linear regression equation for the SPAD index of soybean plants (Figure 3). The increase based on the gypsum doses is associated with the increased addition of S to the soil that increases its availability and absorption in plants. The SPAD index increased because the nutrient participates in chlorophyll synthesis as a component
of ferrodoxins and thioredoxins (MALAVOLTA, 2006).
The gypsum doses did not influence other variables including soybean crop yield. Similar results were found in studies by Caires et al. (1999), Neis et al. (2010), Caires, Joris and Churka (2011), Rampim et al. (2011), Moda et al. (2013), and Pauletti et al. (2014).
Figure 3. SPAD index based on the gypsum doses. (**Significant at 1% probability).
Interaction between gypsum and phosphorous was not observed in the macro and micronutrients contents for the corn crop (Table 5). The P doses were evaluated in isolation, and it was observed that they influence the Mg and Zn leaf contents (Table 5). The results verified that the Mg levels in corn
presented behavior similar to that observed in the soybean crop. The Mg contents increased
(2.29 g kg-1.) in the treatment with the recommended
doses of P (80 kg ha-1 of P
2O5). A decrease in the doses led to values of 2.13 g kg-1 and 2.10 g kg-1 with respect to the 40 kg ha-1 and 0 kg ha-1 doses, respectively. An explanation for this behavior is the same as that used for soybean crop in which higher Mg levels in corn leaves were observed in the plots that received phosphate fertilization due to increased
availability of P to the plants since phosphorous is an important factor for mobilization, absorption, and translocation of Mg into a plant (ZHONG; SCHOBERT; KOMOR, 1993).
The Zn corn leaf contents responded negatively to the P doses, and thus the Zn contents
decreased (20.65 mg kg-1) in the treatment in which
80 kg ha-1 of the nutrient were applied. Values
increased and corresponded to 21.23 and
22.21 mg kg-1 when the dose was halved and when
the dose was absent, respectively. The use of high P doses could impair the assimilation of the Zn micronutrient (MUNER et al., 2011) wherein the deficiency is relatively common mainly due to the low amount in the cerrado soils (VENDRAME et al., 2007).
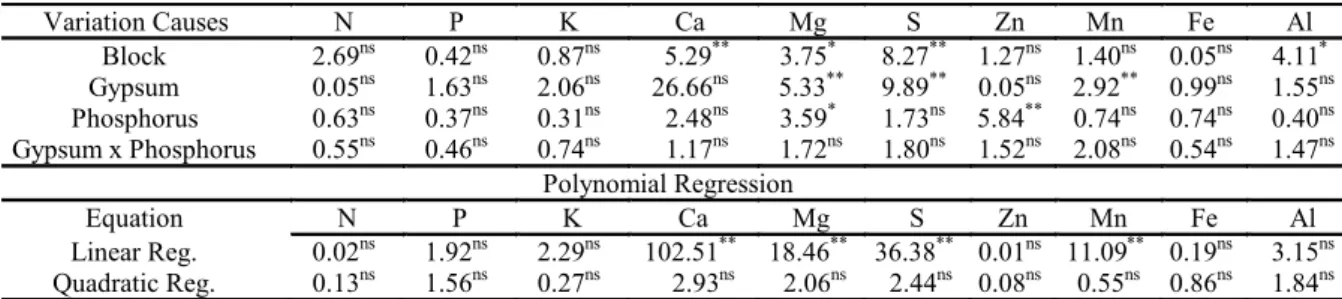
Table 5. Summary of variance analysis: block, gypsum, phosphorus, and its interactions for leaf macro nutrients determined at the full flowering stage of the corn.
**Significant at 1% probability (p < 0.01). *Significant at 5% probability (0.01 =< p < 0.05). nsnot significant (p >= 0.05).
Variation Causes N P K Ca Mg S Zn Mn Fe Al
Block 2.69ns 0.42ns 0.87ns 5.29** 3.75* 8.27** 1.27ns 1.40ns 0.05ns 4.11* Gypsum 0.05ns 1.63ns 2.06ns 26.66ns 5.33** 9.89** 0.05ns 2.92** 0.99ns 1.55ns Phosphorus 0.63ns 0.37ns 0.31ns 2.48ns 3.59* 1.73ns 5.84** 0.74ns 0.74ns 0.40ns Gypsum x Phosphorus 0.55ns 0.46ns 0.74ns 1.17ns 1.72ns 1.80ns 1.52ns 2.08ns 0.54ns 1.47ns
Polynomial Regression
Equation N P K Ca Mg S Zn Mn Fe Al
Linear Reg. 0.02ns 1.92ns 2.29ns 102.51** 18.46** 36.38** 0.01ns 11.09** 0.19ns 3.15ns
Rev. Caatinga
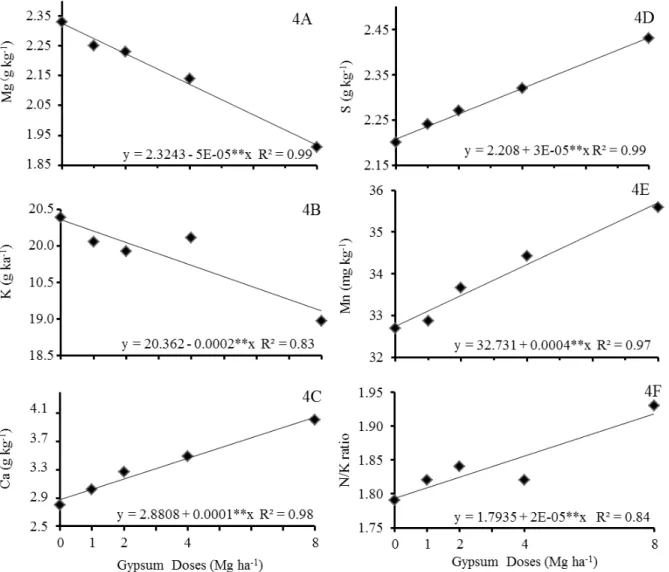
The applied gypsum doses did not vsignificantly affect the corn N content. This result agrees with those obtained by Caires et al. (2011) that evaluated the gypsum effects on corn nutrition and yield and did not observe the effect of this product on the corn N content. The Mg and K contents decreased with increases in the gypsum doses (Figure 4A and 4B), and indicated that high doses of gypsum reduced the concentration of these elements in the corn leaf. This behavior was similar to that observed in soybean leafs and is explained by the same reasons.
The reduction in K levels that was observed in the present study led to an increase in the N-K ratio and made it adverse for crop development (Figure 4F). It should be noted that the K leaf contents are in the range that are considered adequate for the corn crop as indicated by Martinez, Carvalho
and Souza (1999). However, the N contents exceeded the level that is considered as adequate.
The Ca and S adjusted to positive linear equations based on the gypsum doses. Their corn leaf contents increased with increases in the gypsum doses (Figure 4C and 4D). The increase in foliar contents of these elements was expected since this corrective is a source of these nutrients. This result agreed with those obtained by Caires et al. (1999) in which it was observed that an increase of in S leaf content of corn crop was observed with gypsum application.
Additionally, Mn contents also increased with the application of gypsum doses (Figure 4E). The increase in corn leaf tissue follows the same explanation reported in the case of the soybean crop, which is related to the residuals of the element in agricultural gypsum.
With respect to the morphological components of corn, and the yield and its components, interaction between gypsum and phosphorus were not observed (Table 6). A significant difference was observed for the P2O5 doses only for ear length (EL), number of rows (NR), and number of grains per ear (NGE). The treatments that received 40 kg ha-1 and 80 kg ha-1 of P
2O5 exhibited higher values for variables EL, NR, and NGE when compared to the treatment that did not receive phosphate fertilization (Table 6).
In the treatments in which phosphorus was not applied, the soil provided this nutrient to the plants. However, the relative absorption of P from soil and fertilizer may differ as a function of the plant type and stage of development (GRANT et al., 2001). Results with respect to wheat indicated that the phosphorus absorption rate from the soil increased during the growth period from four to six weeks and that soil phosphorus increased with an expansion in the volume of the roots.
Variation Causes LAI SPAD DM PP EL NR NGE NE MTG YIE
Block 0.10ns 14.95** 10.52** 6.99** 2.41ns 1.19ns 1.58ns 3.04* 1.44ns 3.99ns Gypsum 1.78ns 0.51ns 0.03ns 0.67ns 1.52ns 0.64ns 0.40ns 0.41ns 1.55ns 0.14ns Phosphorus 1.10ns 0.28ns 0.06ns 1.73ns 8.18** 6.55** 11.29** 1.00ns 0.64ns 0.89ns
Gyspsum x P 0.20ns 0.82ns 0.31ns 0.89ns 0.73ns 1.62ns 1.90ns 0.78ns 1.36ns 0.81ns Polynomial Regression
Equation LAI SPAD DM PP EL NR NGE NE MTG YIE
Linear Reg. 5.26* 0.73ns 0.01ns 1.84ns 0.08ns 1.24ns 0.70ns 0.46ns 2.62ns 0.40ns Quadratic Reg. 1.74ns 1.20ns 0.01ns 0.09ns 0.62ns 0.19ns 0.84ns 0.61ns 0.06ns 0.03ns
Phosphurus LAI SPAD DM PP EL NR NGE NE MTG YIE
0% 4.54 a 1040.50 a 5807.96 a 2.59 a 15.02 b 16.00 b 506.47 b 23.50 a 285.36 a 6719.97 a 50% 4.66 a 1048.98 a 5930.16 a 2.58 a 16.01 a 16.43 a 550.07 a 23.35 a 282.63 a 7181.00 a 100% 4.76 a 1043.26 a 5873.83 a 2.49 a 15.66 a 16.44 a 537.43 a 22.55 a 289.84 a 6895.00 a MSD 0.37 27.21 855.09 0.16 0.60 0.33 22.92 1.75 15.67 846.34 VC% 10.40 3.39 18.97 8.26 5.05 2.64 5.62 9.85 7.14 15.90
Table 6. Summary of variance analysis: block, gypsum, phosphorus, and its interactions and means related to the P doses for the following: leaf area index (LAI), SPAD index (SPAD), dry plant mass (DM), final plant population (PP), ear length (EL), ear number of rows (NR), number of grains per ear (NGE), number of ears per hectare (NE), mass of a thousand grains (MTG), and grain yield (YIE).
**Significant at 1% probability (p < 0.01). *Significant at 5% probability (0.01 =< p < 0.05). nsnot significant (p >= 0.05).
The means followed by the same letter do not differ statistically by the Tukey test at 5% probability.
A potential explanation for inferior results at zero phosphorus doses is the occurrence of a nutrient deficiency during ear formation (V6 and V7) as a function of the difference in the relative phosphorus absorption from the soil when compared with that from the fertilizer. This deficiency of this element in the plant may decrease the size of the ear and consequently decrease grain number per ear (GRANT et al., 2001). However, these production components differences were insufficient to promote an increase in grain yield.
With respect to the gypsum doses, it was possible to adjust linear regression equations for the leaf area index (Figure 5). It is observed that an increase in gypsum doses decreased leaf area index values. According to Fancelli (1994), photosynthetic rate reduction after flowering may be caused by drought, excess rainfall, prolonged cloudiness, and
an unfavorable N - K ratio in which excess nitrogen
typically contributes to the imbalance.
Rev. Caatinga
Leaf N contents did not change based on the applied gypsum doses (Table 5). However, the K leaf content decreased linearly with increases in the gypsum doses (Figure 4B). This reduction in K contents results in an increase in the N-K ratio and makes it adverse for the development of crops as previously mentioned.
It is important to note that the K leaf levels observed in the study when compared to the results obtained by Martinez, Carvalho and Souza (1999) are in the range considered adequate for the corn crop although the N contents are excessive. This justifies the negative behavior of the leaf area index with respect to an increase in gypsum doses.
The expected effect of an improvement in the distribution of soil profile cations and higher Ca and S concentrations in depth promoted by the gypsum are insufficient to provide increases in corn yield in the first cultivation year.
This lack of response in corn crop yield based on gypsum doses could be related to the good rainfall distribution during crop development (Figure 1) and the adequate soil nutrient levels for corn development and yield (Table 1).
CONCLUSIONS
The soil and climate conditions in which the experiment was conducted indicated that the phosphorus doses increase Mg foliar contents in soybean and corn. The application of gypsum reduces Mg and K foliar contents and increases Ca, Z, and Mn contents in the two crops. Gypsum increases the SPAD index in soybean plants. The
increase in the gypsum doses leads to a N - K ratio
unbalance in corn leaves and reduces the crop leaf area. Doses of P and gypsum do not influence yields of soybean and corn crops.
REFERENCES
BROCH, D. L. et al. Influência no Rendimento de Plantas de Soja pela Aplicação de Fósforo, Calcário e
Gesso em um Latossolo Sob Plantio Direto. Revista
Ciências Exatas e Naturais, Guarapuava, v. 10, n. 2, p. 211-220, 2008.
CAIRES, E. F. et al. Alterações de características químicas do solo e resposta da soja ao calcário e gesso aplicados na superfície em sistema de cultivo
sem preparo do solo. Revista Brasileira de Ciência
do Solo, Viçosa, v. 22, n. 1, p. 27-34, 1998.
CAIRES, E. F. et al. Produção de milho, trigo e soja em função das alterações das características químicas do solo pela aplicação de calcário e gesso na
superfície, em sistema de plantio direto. Revista
Brasileira de Ciência do Solo, Viçosa, v. 23, n. 2, p. 315-327, 1999.
CAIRES, E. F. et al. Alterações químicas do solo e resposta da soja ao calcário e gesso aplicados na
implantação do sistema plantio direto. Revista
Brasileira de Ciência do Solo, Viçosa, v. 27, n. 2, p. 275-286, 2003.
CAIRES, E. F. et al. Surface application of gypsum
in low acidic Oxisoil under no-till cropping system.
Scientia Agricola, Piracicaba, v. 68, n. 2, p. 45-53, 2011.
CAIRES, E. F.; JORIS, H. A. W.; CHURKA, S.
Long-term effects of lime and gypsum additions on
no-till corn and soybean yield and soil chemical
properties in southern Brazil. Soil use and
Management, Weinheim, v. 27, n. 1, p. 45-53, 2011.
EMPRESA BRASILEIRA DE PESQUISA
AGROPECUÁRIA - EMBRAPA. Sistema
brasileiro de classificação de solos. 2. ed. Rio de
Janeiro, RJ: Embrapa - SPI, 2006. 286 p.
FANCELLI, A. L. Milho e feijão: Elementos para
manejo em agricultura irrigada. Piracicaba, SP: Departamento de agricultura/ESALQ/USP, 1994. 14 p.
GELAIN, E. et al. Fixação biológica de nitrogênio e teores foliares de nutrientes na soja em função de
doses de Molibdênio e gesso agrícola. Ciência e
Agrotecnologia, Lavras, v. 35, n. 2, p. 259-269,
2011.
GRANT, C. A. et al. A importância do fósforo no
desenvolvimento inicial da planta. 95. ed. Piracicaba, SP: Informações Agronômicas Potafos, 2001. 16 p.
MALAVOLTA, E. Manual de nutrição mineral de
plantas. São Paulo, SP: Agronômica Ceres, 2006. 638 p.
MALAVOLTA, E.; VITTI, G. C.; OLIVEIRA, S. A. Avaliação do estado nutricional das plantas: princípios e aplicações. 2. ed. Piracicaba, SP: POTAFOS, 1997. 319 p.
MARTINEZ, H. E. P.; CARVALHO, J. G.; SOUZA, R. B. Diagnose foliar. In: RIBEIRO, A. C.; GUIMARÃES, P. T. G.; ALVAREZ V. V. H. (Eds.). Recomendações para o uso de corretivos e fertilizantes em Minas Gerais. 5ª Aproximação. 20.
ed. Viçosa: UFV, 1999. cap. 17, p. 143-168.
MATTIELLO, E. M. et al. Produção de matéria seca, crescimento radicular e absorção de cálcio, fósforo e
influência da atividade do alumínio em solução. Revista Brasileira de Ciência do Solo, Viçosa, v. 32, n. 1, p. 425-434, 2008.
MODA, L. R. et al. Gessagem na cultura da soja no sistema de plantio direto com e sem adubação
potássica. Revista Agro@mbiente On-line, Boa
Vista, v. 7, n. 2, p. 129-135, 2013.
MUNER, L. H. et al. Disponibilidade de zinco para milho em resposta à localização de fósforo no solo. Revista Brasileira de Engenharia Agrícola e Ambiental, Campina Grande, v. 15, n. 1, p. 29–36, 2011.
NAVA, G. et al. Soil composition and nutritional status of apple as affected by long-term application
of gypsum. Revista Brasileira de Ciência do Solo,
Viçosa, v. 36, n. 1, p. 215-222, 2012.
NEIS, L. et al. Gesso agrícola e rendimento de grãos
de soja na região do sudoeste de Goiás. Revista
Brasileira de Ciência do Solo, Viçosa, v. 34, n. 2, p. 409-416, 2010.
NORA, D. D. et al. Alterações químicas do solo e produtividade do milho com aplicação de gesso
combinado com calcário. Magistra, Cruz das Almas,
v. 26, n. 1, p. 1-10, 2014.
OLIVEIRA, I. P. et al. Efeitos de fontes de cálcio no desenvolvimento de gramíneas solteiras e
consorciadas. Ciência e Agrotecnologia, Lavras, v.
33, n. 2, p. 592-598, 2009.
PAULETTI, V. et al. Efeitos em longo prazo da aplicação de gesso e calcário no sistema de plantio
direto. Revista Brasileira de Ciência do Solo,
Viçosa, v. 38, n. 2, p. 495-505, 2014.
PAVINATO, P. S.; CERETTA, C. A. Fósforo e potássio na sucessão trigo/milho: épocas e formas de aplicação. Ciência Rural, Santa Maria, v. 34, n. 6, p. 1779-1784, 2004.
RAMPIM, L. et al. Atributos químicos de solo e resposta do trigo e da soja ao gesso em sistema
semeadura direta. Revista Brasileira de Ciência do
Solo, Viçosa, v. 35, n. 5, p. 1687-1698, 2011.
RITCHEY, K. D.; SILVA, S. E.; COSTA, V. F. Calcium deficiency in clayey B horizons of savannah
Oxisols. Soil Science, New Brunswick, v. 133, n. 6,
p. 378- 382, 1982.
ROSOLEM, C. A.; ASSIS, J. S.; SANTIAGO, A. D. Root growth and mineral nutrition of corn hybrids as
affected by phosphorus and lime. Communications
in Soil Science and Plant Analysis, New York, v. 25, n. 13-14, p. 2491-2499, 1994.
SÁVIO, F. L. et al. Calagem e gessagem na nutrição e produção de soja em solo com pastagem
degradada. Revista Agrotecnologia, Anápolis, v. 2,
n. 1, p. 19-31, 2011.
SORATTO, R. P.; CRUSCIOL, C. A. C. Atributos químicos do solo decorrentes da aplicação em superfície de calcário e gesso em sistema plantio
direto recém-implantado. Revista Brasileira de
Ciência do Solo, Viçosa, v. 32, n. 2, p. 675-688,
2008.
SOUSA, D. M. G.; LOBATO, E. Calagem e adubação para culturas anuais e semiperenes. In: ___. (Eds.). Cerrado: correção do solo e adubação. 2. ed. Brasília: Embrapa Informação Tecnológica, 2004. cap. 12, p. 283-315.
VENDRAME, P. R. S. et al. Disponibilidade de cobre, ferro, manganês e zinco em solos sob
pastagens na Região do Cerrado. Pesquisa
Agropecuária Brasileira, Brasília, v. 42, n. 6, p. 859 -864, 2007.
ZANDONÁ, R. R. et al. Gesso e calcário aumentam a produtividade e amenizam o efeito do déficit
hídrico em milho e soja. Pesquisa Agropecuária
Tropical, Goiânia, v. 45, n. 2, p. 128-137, 2015.
ZHONG, W.; SCHOBERT, C.; KOMOR, E. Transport of magnesium ions in the phloem of
Ricinus communis L. seedlings. Planta, Freiburg, v.