* Corresponding author: E-mail: ivanatuchtenhagen@ gmail.com
Received: August 28, 2017 Approved: December 15, 2017
How to cite: Tuchtenhagen IK, Lima CLR, Bamberg AL, Guimarães RML, Pulido-Moncada M. Visual evaluation of the soil structure under different management systems in lowlands in southern Brazil. Rev Bras Cienc Solo. 2018;42:e0170270.
https://doi.org/10.1590/18069657rbcs20170270
Copyright: This is an open-access article distributed under the terms of the Creative Commons Attribution License, which permits unrestricted use, distribution, and reproduction in any medium, provided that the original author and source are credited.
Visual Evaluation of the Soil
Structure under Different
Management Systems in Lowlands
in Southern Brazil
Ivana Kruger Tuchtenhagen(1)*
, Cláudia Liane Rodrigues de Lima(2)
, Adilson Luís Bamberg(3)
, Rachel Muylaert Locks Guimarães(4)
and Mansonia Pulido-Moncada(5)
(1) Universidade Federal de Pelotas, Faculdade de Agronomia “Eliseu Maciel”, Departamento de Solos, Programa de Pós-Graduação em Manejo e Conservação do Solo e da Água, Pelotas, Rio Grande do Sul, Brasil.
(2) Universidade Federal de Pelotas, Faculdade de Agronomia “Eliseu Maciel”, Departamento de Solos, Pelotas, Rio Grande do Sul, Brasil.
(3) Empresa Brasileira de Pesquisa Agropecuária, Embrapa Clima Temperado, Pelotas, Rio Grande do Sul, Brasil. (4) Universidade Tecnológica Federal do Paraná, Departamento de Agronomia, Pato Branco, Paraná, Brasil. (5) Aarhus University, Department of Agroecology, Research Centre Foulum, Denmark.
ABSTRACT: The “Visual Evaluation of Soil Structure” (VESS) is a method used primarily
to evaluate the soil structural quality of Oxisols in Brazil and secondly for more specific
research, consultancy, and teaching purposes. Since the methodology was never applied and compared with laboratory evaluations of physical properties of hydromorphic soils of the Pampa biome in the south of Brazil, this study evaluated the use of VESS as a visual indicator of the structure quality of a typic eutrophic Albaqualf soil under native grassland, crop-livestock integration, no-tillage, and conventional management systems.
Experimental areas with these different management systems were subjected to visual
(VESS) and laboratory evaluation of the soil structure. The laboratory evaluation was based on traditional methods and on measurements of bulk density, porosity, aggregate mean weight diameter, aggregate tensile strength (ATS), and total organic carbon (TOC).
It was concluded that VESS was efficient in differentiating the management system.
The management systems based on minimum soil disturbance and mulching with crop residues improved the soil quality, as evidenced by the VESS scores, bulk density, porosity, aggregation, and organic carbon. The TOC content was inversely related with
ATS. The quality of a typic eutrophic Albaqualf was benefitted by organic matter in the
surface layer.
Keywords: soil degradation, bulk density, tensile strength, no-tillage, conventional tillage.
INTRODUCTION
The Rio Grande do Sul State has 5.4 million hectares of lowlands, corresponding to 20 % of its total area. Hydromorphic soils are predominant in these areas and normally found on plains
of rivers and lakes, established under conditions of drainage deficiency (hydromorphism) and usually plain topography (Parfitt et al., 2014). They have a naturally high bulk density, high micro∕macropore ratio, drainage limitations, and an impermeable sub-surface layer
(Pauletto et al., 2004). These properties confer adverse soil hydric conditions (saturation
and aeration deficiency) (Ribeiro et al., 2016) when compared to other Brazilian soils. The purpose of the different management systems is to establish adequate soil conditions
and increase crop yields. If only higher yields are pursued, the soil structural quality
may be compromised, with negative effects on agricultural sustainability in the long
term. According to Reis et al. (2016), management systems including vegetation cover
and control of soil disturbance and machinery traffic, such as the no-tillage system, can benefit soil physical properties in lowlands.
Bulk density, porosity (Neves et al., 2006), aggregate stability (Salton et al., 2008), and aggregate tensile strength have been used to characterize changes resulting from land use
and soil management (Imhoff et al., 2002). Although these physical properties are important
tools for monitoring impacts of management systems, for being exact and accurate, they are
sometimes difficult to use since the measurements are time-consuming and cost-intensive. Direct, fast, and sensitive methods to different management systems and their consequences
in the long term can be used (Askari et al., 2013; Guimarães et al., 2017) to help decision making about a suitable soil management e.g., visual soil evaluation (VSA) (Shepherd et al.,
2009). Direct field evaluations such as methods of visual soil evaluation are presented as complementary or alternative methods for a fast and efficient evaluation of the soil
structural conditions. Among these, the visual soil structure evaluation (VESS), developed by Ball et al. (2007) and Guimarães et al. (2011) is particularly interesting for being a method
that differentiates layers with structural differences directly and quickly and assesses the
soil structural quality.
Researchers from different parts of the world have tested the capacity and consistency of
VESS to determine the soil structural quality, contrasts in texture conditions, land use, and soil management (Askari et al., 2013; Ball et al., 2013; Munkholm et al., 2013; Abdollahi and Munkholm, 2014; Pulido-Moncada et al., 2014a; Pulido-Moncada et al., 2014b; Askari and Holden, 2015; Cui and Holden, 2015; Guimarães et al., 2017). In Brazil, VESS has been used and validated mainly for Oxisols, in no-tillage, and other management systems, evidencing the reliability of the method as an alternative to monitor soil quality (Giarola et al., 2009; Giarola et al., 2013; Silva et al., 2014; Cherubin et al., 2017; Guimarães et al., 2017).
Studies assessing this method in hydromorphic soils subjected to different managements,
of the Pampa biome of southern Brazil, are still inexistent. The hypothesis tested was that a visual evaluation of soil structure, in comparison to conventional methods of soil
physical properties quantification, allows for a soil quality diagnosis providing quick, exact, and easy answers for farmers and scientific community. This study aimed to use
a visual evaluation of the soil structure as a visual indicator of the structural quality of an Albaqualf under no-tillage, conventional tillage, crop-livestock integration, and native grassland in the lowlands of southern Brazil.
MATERIALS AND METHODS
Experimental area
The experimental area is representative of the typical farming environment in the
Pampa biome in the south of Brazil. The soil is classified as a typic eutrophic Albaqualf/
Planossolo háplico eutrófico (Cunha and Costa, 2013), with a sandy loam texture
(131 g kg-1
clay, 314 g kg-1
silt, and 554 g kg-1
sand) from the surface to a depth of 0.40 m (Ribeiro et al., 2016). The regional climate is Cfa according to the Köppen
classification system, humid subtropical, with mean annual temperature and rainfall
of 17.8 °C and 1,366 mm, respectively.
The management systems evaluated at the experimental station were native grassland (NG), crop-livestock integration (CLI), no-tillage (NT), and conventional tillage (CT) (Table 1). The experiment was initiated in 2011.
Soil sampling and analyses
Each management system was subdivided into four equal plots and one sampling point per plot was randomly selected. Then, undisturbed samples (blocks) were taken from mini-trenches (0.15 × 0.25 × 0.10 m), with a straight shovel spade, totaling 16 samples of the tested management systems (Table 1) (four management systems × four samples per management). The water content during sampling indicated a friable consistency of the soil. The soil slices were then broken by hand, along the natural fault lines of the aggregates, to reveal the soil structure.
The soil was visually evaluated according to the methodology proposed by Ball et al. (2007), comparing the appearance of soil aggregates after manual crushing, as suggested by Guimarães et al. (2011). The methodology proposes that after a soil slice is extracted,
aggregates are classified from the fracture lines and the structure is scored (Guimarães
et al., 2011). Aggregates are evaluated according to their size, resistance, color, visible porosity, and shape. The scores range from 1 (good structural quality) to 5 (poor structural
quality). Score assignment and final score calculations were performed using weighted
means, according to Guimarães et al. (2011).
Next, soil was collected from the 0.00-0.10 and 0.10-0.20 m layers, resulting in a total of 32 samples (4 management systems × 4 replications per management × 2 soil layers) and the mean weight diameter (MWD), aggregate tensile strength (ATS), friability (F), and total organic carbon (TOC) were evaluated in the laboratory.
To determine WMD, the samples were manually broken at their weak points, air-dried, and sieved (9.52 mm mesh), based on wet sieving, by the method described by Kemper and Rosenau (1986) and adapted by Palmeira et al. (1999), in a vertical oscillation equipment.
To evaluate ATS, the samples were dried by natural aeration in the shadow until the soil reached friability. Then the samples were manually crushed, observing the weak points of soil, and 1,280 aggregates (4 management systems × 4 replications per management ×
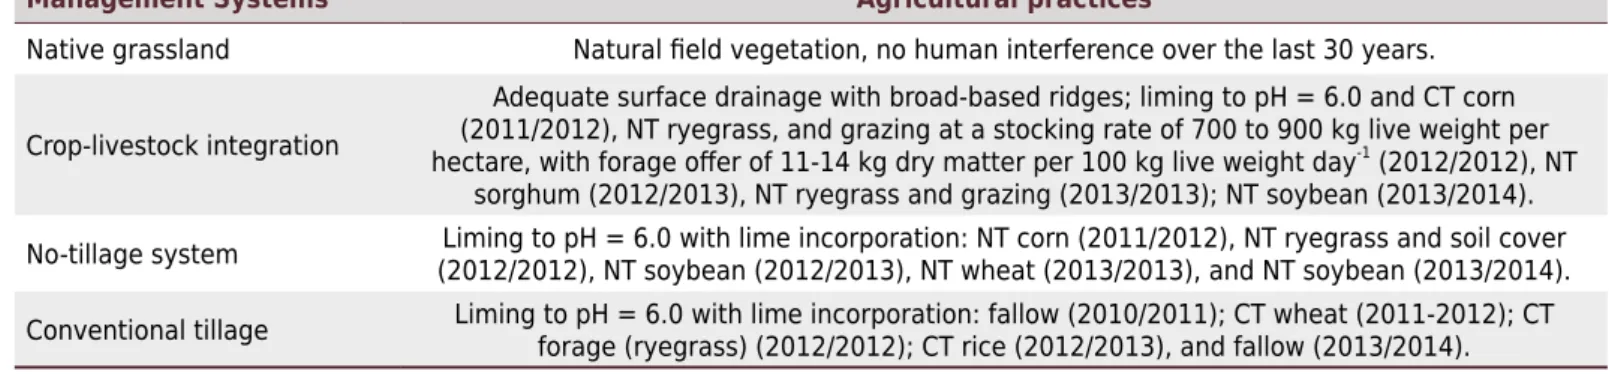
Table 1. Agricultural practices applied under different management systems, on a typic eutrophic Albaqualf - Planossolo háplico
eutrófico in the south of Brazil
Management Systems Agricultural practices
Native grassland Natural field vegetation, no human interference over the last 30 years.
Crop-livestock integration
Adequate surface drainage with broad-based ridges; liming to pH = 6.0 and CT corn (2011/2012), NT ryegrass, and grazing at a stocking rate of 700 to 900 kg live weight per
hectare, with forage offer of 11-14 kg dry matter per 100 kg live weight day-1 (2012/2012), NT
sorghum (2012/2013), NT ryegrass and grazing (2013/2013); NT soybean (2013/2014).
No-tillage system Liming to pH = 6.0 with lime incorporation: NT corn (2011/2012), NT ryegrass and soil cover (2012/2012), NT soybean (2012/2013), NT wheat (2013/2013), and NT soybean (2013/2014).
Conventional tillage Liming to pH = 6.0 with lime incorporation: fallow (2010/2011); CT wheat (2011-2012); CT forage (ryegrass) (2012/2012); CT rice (2012/2013), and fallow (2013/2014).
2 soil layers × 40 aggregates), between 12.5 and 19 mm mean diameter were selected
(Imhoff et al., 2002). The same disturbed soil samples were air-dried for about 72 h,
sieved (2 mm mesh), ground in an agate mortar, and 100 % of the material was sieved
(<0.105 mm mesh), and analyzed in a CHN-S elemental analyzer (Perkin Elmer®) by dry
combustion. For this evaluation, 160 aggregates were selected (4 management systems × 4 replications per management × 2 soil layers × 5 aggregates).
To define ATS, a linear electronic actuator was used at constant speed (MA 933 manufactured
by Marconi, Ltda) until the aggregates cracked, i.e., a continuous tensile crack was formed
approximately between the polar diameters, as described by Imhoff et al. (2002).
Prior to stress application, the weight of each aggregate was measured with a precision balance and the mean diameter calculated based on height, width, and length measurements determined with a paquimeter. Each aggregate was placed in the most stable position possible and a stress up to 20 kgf was applied. The value of the tensile stress required for aggregate rupture was registered in a data acquisition electronic system connected to a computer, and the ATS was calculated according to equation 1, suggested by Dexter and Kroesbergen (1985):
ATS = 0.576 P
D2 Eq. 1
in which: 0.576 represents the proportionality constant, reflecting the relation between
the compressive stress applied and the tensile stress generated within the aggregate; P is
the applied stress (N), and D is the effective diameter (mm), calculated by equation 2:
D = Dm M
1/3
M0
Eq. 2
in which: M is the mass of the individual aggregate (g); M0 is the average mass of the
aggregates in each treatment (g); and Dm is the average diameter of the aggregates
(mm), defined by the average sieve sizes [(12.5 + 19.0)/2 = 15.75 mm]. Usually, ATS
of soil aggregates is expressed in kPa.
Soil friability (F) was calculated using the variation coefficient method (Equation 3),
proposed by Watts and Dexter (1998):
F = σY
Y ± σY
Y√2n Eq. 3
in which F is the soil friability; σY is the standard deviation of the mean ATS value; Y is the means of all ATS values, and n is the number of replications, and the second
term is the variance coefficient standard error. Based on the F values (dimensionless), as proposed by Imhoff et al. (2002), friability was classified as: non-friable (<0.10),
slightly friable (0.10-0.20), friable (0.20-0.50), highly friable (0.50-0.80), and mechanically unstable (>0.80).
Undisturbed samples were collected from the same layers, in stainless steel cylinders (0.025 m height × 0.070 m diameter), resulting in a total of 96 samples (4 management systems × 4 replications per management × 3 cylinders per replication × 2 soil layers), to determine macroporosity (Ma), total porosity (Tp), and bulk density (Bd). The samples were saturated by capillary pressure saturation, and then equilibrated in a pressure plate apparatus at - 6 kPa, to separate Ma (>0.05 mm diameter) from the microporosity (Mi). Both Tp and Bd were obtained using the volumetric ring method (Donagema et al., 2011).
Statistical analysis
The raw dataset was subjected to descriptive statistics (mean, variation coefficient, standard
test was applied at a 5 % significance level to test the normality of data distribution prior to analysis of variance (Anova). When the values were significant (p<0.05), they were
compared by the Tukey test with statistical software R (R Development Core Team, 2013).
RESULTS AND DISCUSSION
Visual evaluation of soil structure
According to the visual quality classification of the soil structure (Ball et al., 2007;
Guimarães et al., 2011), the aggregates under NT were easily breakable, due to the presence of roots, high porosity (<6 mm) and a few aggregates with diameter >1 cm (Figure 1).
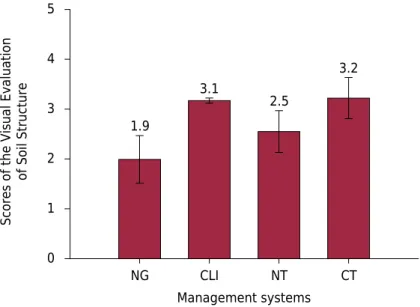
For NG, a score of 1.9 was established (Figure 2); according to Ball et al. (2017), scores between 1 and 2.9 indicate good structural quality and require no remediation procedures. This result for NG was probably due to the absence of soil tillage, the presence of plant residues, and higher organic matter content in the soil surface, which is fundamental to the maintenance of a good soil structure.
NG CLI NT CS
Figure 1. Pictures of the Visual Evaluation of Soil Structure (VESS) of an Albaqualf under different
management systems in the 0.00-0.20m layer. NG: native grassland; CLI: crop-livestock integration; NT: no-tillage; CT: conventional tillage system.
Management systems
NG CLI NT CT
Scores of the Visual Evaluation
of Soil Structur
e
0 1 2 3 4 5
1.9
3.1
2.5
3.2
Figure 2. Mean scores of the Visual Evaluation of Soil Structure of an Albaqualf under different
The systems CLI (3.1) and CT (3.2) had a moderate structure and scores between 3 and 3.9, indicating acceptable quality conditions (Figure 2). However, they will need improvement in the long term. A score of 3 indicates the rupture of most of the aggregates by hand, with porous aggregates between 2 to 100 mm and some angular, non-porous clods (Figure 1), while at a score of 4, it is impossible to break aggregates by hand (Ball et al., 2017).
In spite of having fewer roots, the NT system scored 2.5 (Figure 2), which is related to the same type of easily breakable, porous aggregates with diameter larger than 30 mm and with most of them corresponding to the diameter 10 to 20 mm (Figure 1).
The classification of the two systems CLI and CT indicated the same structural quality,
based on the soil quality scores (Figure 2). The quality of the NG aggregates in the uppermost centimeters of the surface layer was better than in the other managements (Figure 1). According to Askari et al. (2013), the soil structure quality of minimum tillage (conservation management) systems was better than that of the conventional system in temperate climate soils in Ireland. Likewise, Giarola et al. (2009) reported a higher visual score in soils under CLI, followed by no-tillage systems and forest soils in Paraná, Brazil. These results of VESS show the applicability of the method to distinguish
structural differences of soil quality of an Albaqualf in the south of Brazil between different
management systems in this study.
Soil physical properties and their relation with VESS
The mean Bd values in the 0.00-0.10 m layer in all management systems under evaluation (Figure 3a) were not higher than those reported by Reichert et al. (2009) as limiting to
plant development (1.70 Mg m-3
) for soils with a similar texture to the one in this study. The minimum soil tillage under NT, with gradual accumulation of dead vegetation on the surface and of crop roots in the uppermost centimeters of the soil surface, contributed
mainly to reduce Bd values (1.39 Mg m-3
) in the surface layer (Figure 3a), differing from the other systems. However, in the deeper layer, Bd was statistically different in CLI from
the other management systems (mean of 1.74 Mg m-3
), indicating a possible restriction to
plant growth (Figure 3b). Problems associated to deficient aeration might be evident mainly
in the 0.10-0.20 m layer of the CLI system (Figure 3d), in agreement with the Bd in this layer (Figure 2). However, in coarse-textured soils, the macropores (Ma) consist mainly of textural pores, resulting from soil particle arrangement (Reichert et al., 2009). These Ma
are weakly interconnected and, therefore, rarely contribute to gas fluxes, indicating that
the minimum Ma threshold for plant growth may be higher than 0.10 m3
m-3
.
Many authors reported correlations between VESS and other soil physical properties, indicating that the method, along with other visual evaluation procedures, can reveal
differences between soil units and management (Batey et al., 2015). The values of some soil quality indicators evaluated in this study (Table 2) are in line with findings of other
studies (Guimarães et al., 2011; Guimarães et al., 2013; Pulido-Moncada et al., 2014a,b). These results clearly show the reliability of VESS for soil structure evaluation.
In the 0.00-0.10 m layer of the management systems CT, CLI, and NT (Figure 3c), Ma may be related to a higher volume of hairy roots, characteristic of grass, and to possible channels (biopores) resulting from the decomposition and renewal of these roots (Lima et al., 2012), aside from the intense biological activity of the mesofauna and organic carbon accumulation. The Ma was correlated with the VESS in 80 % in the 0.00-0.20 m layer.
The positive effects of management systems that ensure minimum soil disturbance are
observed to present closer conditions in the superficial layer(Figure 4a). The presence
of grass may also be beneficial to aggregate structure and stability, promoting particle
approximation and a uniform distribution of soil exudates, favoring microbial activity Figure 3. Bulk density (Bd) (a, b), macroporosity (Ma) (c, d), and total porosity (Tp) (e, f) of an Albaqualf under different management
systems in the 0.00-0.10 and 0.10-0.20 m layers. NG: native grassland; CLI: crop-livestock integration; NT: no-tillage; CT: conventional
tillage. Means followed by the same letter in a column, within each variable and soil layer, were not significantly different from each
other by the Duncan test at 5 %. Vertical bars indicate the standard deviation.
(a)
1.39 b
Bd (Mg m
-3 )
1.45 a
1.44 a
1.58 a 0.00-0.10 m
1.8
1.6
1.4
0.6 1.0 1.2
0.4
0.2
0.0 0.8
2.0
-0.10-0.20 m
1.61 b
1.74 a
1.61 b 1.57 b (b)
(c)
Ma (m
3 m -3 )
0.12ns
0.13ns
0.13ns
0.09ns
0.18
0.14 0.16
0.12
0.10
0.08
0.06
0.04
0.00 0.02
(d)
0.10 a
0.04 b
0.07 b
0.10 a
0.49 a
NG CLI NT CT
0.49 a
0.47 ab 0.43 b (e)
0.6
0.5
0.4
0.3
0.2
0.1
0.0
Tp (m
3 m -3 )
0.47 a
Management systems
NG CLI NT CT
0.39 b (f)
and consequently aggregate formation and stabilization (Salton et al., 2008) in the
different soil layers.
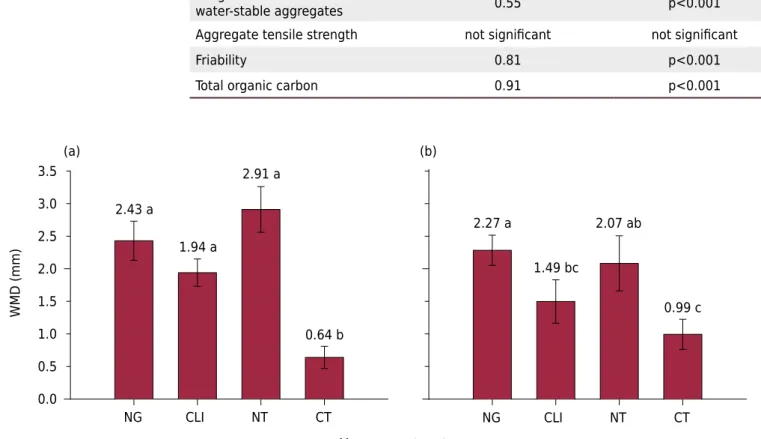
Under CT, the WMD was lowest in both layers (Figures 4a and 4b), differing from the
other managements and evidencing that the physical rupture of aggregates results in organic matter exposure and gradual decrease, due to intensive and repeated soil tillage.
Mean ATS values in the 0.00-0.20 m layer did not differ between managements, except for CT (Figures 5a and 5b), which might be ascribed to the effect of machinery traffic and
soil tillage. The highest ATS values found in this system are in line with the structural quality level assessed by VESS (Figures 1 and 2), since higher VESS values are related to higher compaction and higher aggregate resistance to rupture. A positive relation
between ATS and VESS was found by Guimarães et al. (2011), which is justified by the score classification, based on aggregate resistance to rupture. Other international studies also confirmed the relation between VESS and ATS (Guimarães et al., 2011) and
other parameters such as bulk density (Guimarães et al., 2013; Pulido-Moncada et al., 2014a,b; Cherubin et al., 2017), porosity (Pulido-Moncada et al., 2014a,b), WMD (Abdollahi and Munkholm, 2014; Pulido-Moncada et al., 2014b), and organic carbon content (Pulido-Moncada et al., 2014a,b).
Table 2. Correlation coefficients and their significance levels between VESS scores (Sq) and soil
properties
Soil property Correlation coeffiecient Significance level
Bulk density 0.91 p<0.001
Macroporosity 0.80 p<0.001
Total porosity 0.60 p<0.001
Weighted mean diameter of
water-stable aggregates 0.55 p<0.001
Aggregate tensile strength not significant not significant
Friability 0.81 p<0.001
Total organic carbon 0.91 p<0.001
(a)
2.43 a
Management systems
NG CLI NT CT
WMD (mm)
1.94 a
2.91 a
0.64 b 3.0
2.0 2.5
1.5
1.0
0.5
0.0 3.5
(b)
2.27 a
NG CLI NT CT
1.49 bc
2.07 ab
0.99 c
Figure 4. Weighted mean diameter of water-stable aggregates (WMD) (a, b) of an Albaqualf under different management systemsin the 0.00-0.10 m layer (a) and 0.10-0.20 m layer (b). Vertical bars indicate the standard deviation. NG: native grassland; CLI: crop-livestock integration; NT: no-tillage; CT: conventional tillage system. Averages followed by the same lowercase letter in a column, within each
The ATS and WMD results showed that soil tillage decreased the aggregate size, mainly in CT, even if the structural quality was moderate, according to the VESS evaluation in this system. The friability amplitude in the 0.00-0.10 m layer was 0.46 (NT) to 0.94 (CT) (Figures 5c and 5d), corresponding to from friable to mechanically unstable classes,
respectively (Imhoff et al., 2002). This reinforces that tillage reduces the aggregate
size without improving their inner quality. In the 0.10-0.20 m layer, the systems were
classified as friable, as suggested by Imhoff et al. (2002).
Mean TOC values in the surface layer (0.00-0.10 m) ranged from 11.89 to 31.36 g kg-1
(Figure 6a). The TOC values of CLI and CT were lowest in this layer (Figure 6a). However,
no significant difference was observed between systems in the 0.10-0.20 m layer for
this parameter (Figure 6b). Also, the relation between VESS and TOC in this study was
linear and significant (r = 0.91, p<0.01).
Higher TOC content in NT than CT systems can be mostly related to: undisturbed soil surface, vegetation cover and crop residues resulting from crop successions, and increase in root density, favoring higher C allocation in the surface layers. According to Boddey et al. (2010), management systems with intensive and successive soil tillage
decrease the organic matter content, confirming the results of this study.
Figure 5. Aggregate tensile strength (ATS) (a, b) and friability (F) (c, d) of an Albaqualf under different management systems in the
0.00-0.10 and 0.10-0.20 m layers. NG: native grassland; CLI: crop-livestock integration; NT: no-tillage; CT: conventional tillage system.
ns: not significant at 5 %. Means followed by the same lowercase letter in a column were not significantly different by Duncan’s test
at 5 %. Vertical bars indicate the standard deviation.
50.02 b
ATS (kPa
)
0 50 100 150 200 250
70.32 b
50.45 b
135.39 a
(a) 0.00-0.10 m
63.28 b
76.90 b
69.77 b
195.38 a
(b) 0.10-0.20 m
Management systems
NG CLI NT CT
(c)
NG CLI NT CT
(d)
F 0.54 c
0.63 b
0.46 d
0.94 a 1.2
1.0
0.8
0.6
0.4
0.2
0.0
0.76 a
0.62 c
0.73 b
One of the factors that influence ATS is associated to TOC (Imhoff et al., 2002). However, the discussion on the positive or negative effects of organic matter on ATS is still not
settled. Our results indicated an inverse relation between ATS and TOC (Figures 7a and
7b), confirming results of Reis et al. (2014), but contrasting with those of Imhoff et al. (2002) and Guimarães et al. (2009). There are two effects of soil organic matter on ATS: an increase in the number and strength of particle bonds and a dilution effect, related to
a reduction in bulk density or increase in aggregate porosity. The increase in soil organic matter raises aggregate porosity, reducing the number of bonds between particles; in wich case the strength of this links is not increased, then there is a consequent reduction in tensile strength. According to Zhang (1994), the predominance of one or the other mechanism will determine the direction of correlation between aggregate tensile strength and soil organic matter.
In the CT system, the mean ATS value was 63 % in the 0.00-0.10 m and 67 % in the 0.10-0.20 m layer, higher than under NG. In the 0.00-0.10 m layer, this value was 62 %, and 64 % in 0.10-0.20 m, higher than under NT, indicating an increasing tendency of
ATS when soil tillage is intensified and TOC is reduced.
These results reinforce that the use of management systems which favor improvement and conservation of physical properties is relevant for the environmental sustainability of the agricultural production, even in lowlands and temperate climates. Therefore, one of the alternatives to maximize agricultural yields as well as promote soil quality would be the adoption of no-tillage and crop livestock integration systems. Systems such as no-tillage can also induce reductions in greenhouse gas emissions (Ball et al., 2013; Silva et al., 2014), and increase carbon stocks and microbial diversity in the soil (Reis et al., 2016), mainly by the accumulation of surface crop residues.
The VESS, a method that assigns scores based on simple and objective criteria and
rapid determination, can be a practical tool to demonstrate the effects of management
systems on soil properties and the soil quality in general. The correlation analysis of the
VESS score data with bulk density, total porosity, and macroporosity clearly confirmed
this possibility (Table 2).
When comparing the soil structural evaluation carried out in the field with the traditional
determination of physical properties in the laboratory, the potential use of the VESS Figure 6. Mean values of total organic carbon content (TOC) of an Albaqualf under different management systems, in the 0.00-0.10 m
(a) and 0.10-0.20 m (b) layers. NG: native grassland; CLI: crop-livestock integration; NT: no-tillage; CT: conventional tillage system;
ns: no significant. Means followed by the same letter in a column, within each variable and soil layer, were not significantly different
from each other by the Duncan test at 5 %. Vertical bars indicate the standard deviation.
21.36 a
NG CLI NT CT
TOC (g kg
-1 )
0 5 10 15 20 25
13.88 c
17.16 b
11.89 c (a)
15.00ns
Management systems
NG CLI NT CT
14.25ns 14.52ns
diagnosis proved useful to distinguish structural differences between physical quality
properties of a typic eutrophic Albaqualf, which validates the hypothesis of the applicability of VESS for this soil type.
CONCLUSIONS
The Visual Evaluation of Soil Structure proved adequate to differentiate management
systems and can be considered a visual indicator of soil structure quality in comparison to quantitative laboratory methods of evaluation of the physical properties of a typic eutrophic Albaqualf.
Management systems with limited soil disturbance that accumulate crop residues resulted in improvements in the soil physical quality with regard to plant development, as indicated by the scores of VESS, and bulk density, porosity, aggregation, and organic
carbon. Aggregate tensile strength was higher in soils with intensified tillage, and inversely
related with the total organic carbon content. The quality of a typic eutrophic Albaqualf
was benefitted by organic matter in the surface layer.
REFERENCES
Abdollahi L, Munkholm LJ. Tillage system and cover crop effects on soil quality: I.
Chemical, mechanical, and biological properties. Soil Sci Soc Am J. 2014;78:262-70. https://doi.org/10.2136/sssaj2013.07.0301
Askari MS, Cui J, Holden NM. The visual evaluation of soil structure under arable management. Soil Till Res. 2013;134:1-10. https://doi.org/10.1016/j.still.2013.06.004
Askari MS, Holden NM. Quantitative soil quality indexing of temperate arable management systems. Soil Till Res. 2015;150:57-67. https://doi.org/10.1016/j.still.2015.01.010
Ball BC, Batey T, Munkholm LJ. Field assessment of soil structural quality - a development of the Peerlkamp test. Soil Use Manage. 2007;23:329-37. https://doi.org/10.1111/j.1475-2743.2007.00102.x
Ball BC, Guimarães RML, Cloy JM, Hargreaves PR, Shepherd TG, McKenzie BM. Visual soil evaluation: a summary of some applications and potential developments for agriculture. Soil Till Res. 2017;173:114-24. https://doi.org/10.1016/j.still.2016.07.006
Ball BC, Munkholm LJ, Batey T. Applications of visual soil evaluation. Soil Till Res. 2013;127:1-2. https://doi.org/10.1016/j.still.2012.12.002
(a)
10
ATS (kPa
)
0 50 100 150 200
250 y = 22.53 - 0.084x
R2 = 0.78
p<0.05
TOC (g kg-1)
10 (b)
y = 18.339 - 0.036x R2 = 0.92
p<0.05
24 22 20 18 16 14
12 12 14 16 18 20
Figure 7. Relation between the aggregate tensile strength (ATS) and total organic carbon content (TOC) of an Albaqualf under
Batey T, Guimarães RML, Peigné J, Boizard H. Assessing structural quality for crop performance
and for agronomy (VESS, VSA, SOILpak, Profil Cultural, SubVESS). In: Ball BC, Munkholm LR,
editors. Visual soil evaluation: realising potential crop production with minimum environmental impact. Wallingford: CABI; 2015. p. 15-30.
Boddey RM, Jantalia CP, Conceicão PC, Zanatta JA, Bayer C, Mielniczuk J, Dieckow J, Santos HP, Denardin JE, Aita C, Giacomini SJ, Alves BJR, Urquiaga S. Carbon accumulation at depth in Ferralsols under zero-till subtropical agriculture. Glob Change Biol. 2010;16:784-95. https://doi.org/10.1111/j.1365-2486.2009.02020.x
Cherubin MR, Franco ALC, Guimarães RML, Tormena CA, Cerri CEP, Karlen DL, Cerri CC. Assessing soil structural quality under Brazilian sugarcane expansion areas using Visual Evaluation of Soil Structure (VESS). Soil Till Res. 2017;173:64-74. https://doi.org/10.1016/j.still.2016.05.004
Cui J, Holden NM. The relationship between soil microbial activity and microbial biomass, soil structure and grassland management. Soil Till Res. 2015;146:32-8. https://doi.org/10.1016/j.still.2014.07.005
Cunha NG, Costa FA. Solos da estação Terras Baixas da Embrapa Clima Temperado. Pelotas: Embrapa Clima Temperado; 2013. (Circular técnica, 152).
Dexter AR, Kroesbergen B. Methodology for determination of tensile strength of soil aggregates. J Agric Engng Res. 1985;31:139-47. https://doi.org/10.1016/0021-8634(85)90066-6
Donagema GK, Campos DVB, Calderano SB, Teixeira WG, Viana JHM, organizadores. Manual de métodos de análise do solo. 2. ed. rev. Rio de Janeiro: Embrapa Solos; 2011.
Giarola NFB, Silva AP, Tormena CA, Guimarães RML, Ball BC. On the visual evaluation of soil structure: the Brazilian experience on Oxisols under no-tillage. Soil Till Res. 2013;127:60-4. https://doi.org/10.1016/j.still.2012.03.004
Giarola NFB, Tormena CA, Silva AP, Ball B. Método de avaliação visual da qualidade da estrutura aplicado a Latossolo Vermelho Distroférrico sob diferentes sistemas de uso e manejo. Cienc Rural. 2009;39:2531-4. https://doi.org/10.1590/S0103-84782009000800041
Guimarães RML, Ball BC, Tormena CA. Improvements in the visual evaluation of soil structure. Soil Use Manage. 2011;27:395-403. https://doi.org/10.1111/j.1475-2743.2011.00354.x
Guimarães RML, Ball BC, Tormena CA, Giarola NFB, Silva AP. Relating visual evaluation of soil structure to other physical properties in soils of contrasting texture and management. Soil Till Res. 2013;127:92-9. https://doi.org/10.1016/j.still.2012.01.020
Guimarães RML, Neves Junior AF, Silva WG, Rogers CD, Ball BC, Montes CR, Pereira BFF. The merits of the Visual Evaluation of Soil Structure method (VESS) for assessing soil physical quality in the remote, undeveloped regions of the Amazon basin. Soil Till Res. 2017;173:75-82. https://doi.org/10.1016/j.still.2016.10.014
Guimarães RML, Tormena CA, Alves SJ, Fidalski J, Blainski E. Tensile strength, friability and organic carbon in an Oxisol under a crop-livestock system. Sci Agric. 2009;66:499-505. http://dx.doi.org/10.1590/S0103-90162009000400011
Imhoff S, Silva AP, Dexter A. Factors contributing to the tensile strength and friability of Oxisols.
Soil Sci Soc Am J. 2002;66:1656-61. https://doi.org/10.2136/sssaj2002.1656
Kemper WD, Rosenau RC. Aggregate stability and size distribution. In: Klute A, editor. Methods of soil analysis. Physical and mineralogical methods. 2nd ed. Madison: American Society of Agronomy; 1986. Pt 1. p. 425-42.
Lima CLR, Pillon CN, Suzuki LEAS, Cruz LEC. Atributos físicos de um Planossolo Háplico sob sistemas de manejo comparados aos do campo nativo. Rev Bras Cienc Solo. 2008;32:1849-55. https://doi.org/10.1590/S0100-06832008000500006
Lima VMP, Oliveira GC, Serafim ME, Curi N, Evangelista AR. Intervalo hídrico ótimo como
indicador de melhoria da qualidade estrutural de Latossolo degradado. Rev Bras Cienc Solo. 2012;36:71-8. https://doi.org/10.1590/S0100-06832012000100008
Munkholm LJ, Heck RJ, Deen B. Long-term rotation and tillage effects on soil structure and crop
Neves CSVJ, Feller C, Kouakoua E. Efeito do manejo do solo e da matéria orgânica solúvel em água quente na estabilidade de agregados de um Latossolo argiloso. Cienc Rural. 2006;36:1410-55. https://doi.org/10.1590/S0103-84782006000500010
Palmeira PRT, Pauletto EA, Teixeira CFA, Gomes AS, Silva JB. Agregação de um Planossolo submetido a diferentes sistemas de cultivo. Rev Bras Cienc Solo. 1999;23:189-95. https://doi.org/10.1590/S0100-06831999000200001
Parfitt JMB, Pinto MAB, Timm LC. Efeito da sistematização sobre atributos físicos, químicos e
biológicos de um solo de várzea no Rio Grande do Sul. Pelotas: Embrapa Clima Temperado; 2014. (Boletim de Pesquisa e Desenvolvimento, 189).
Pauletto EA, Gomes AS, Pinto LFS. Física de solos de várzea cultivados com arroz irrigado. In: Gomes AS, Magalhães Júnior AM, editores. Arroz irrigado no Sul do Brasil. Brasília, DF: Embrapa Informação Tecnológica; 2004. p. 119-42.
Pulido-Moncada M, Gabriels D, Lobo D, Rey JC, Cornelis WM. Visual field
assessment of soil structural quality in tropical soils. Soil Till Res. 2014a;139:8-18. https://doi.org/10.1016/j.still.2014.01.002
Pulido-Moncada M, Penning LH, Timm LC, Gabriels D, Cornelis WM. Visual examinations and soil physical and hydraulic properties for assessing soil structural quality of soils with contrasting textures and land uses. Soil Till Res. 2014b;140:20-8. https://doi.org/10.1016/j.still.2014.02.009
R Development Core Team. R: a language and environment for statistical computing. R
Foundation for Statistical Computing, Vienna, Austria; 2013 [accessed at 29 April 2017].
Available at: http://www.R-project.org/.
Reichert JM, Suzuki LEAS, Reinert DJ, Horn R, Håkansson I. Reference bulk density and critical degree-of-compactness for no-till crop production in subtropical highly weathered soils. Soil Till Res. 2009;102:242-54. https://doi.org/10.1016/j.still.2008.07.002
Reis DA, Lima CLR, Bamberg AL. Qualidade física e frações da matéria orgânica de um Planossolo sob sistema plantio direto. Pesq Agropec Bras. 2016;51:1623-32. https://doi.org/10.1590/s0100-204x2016000900062
Reis DA, Lima CLR, Pauletto EA. Resistência tênsil de agregados e compressibilidade de um solo construído com plantas de cobertura em área de mineração de carvão em Candiota, RS. Rev Bras Cienc Solo. 2014;38:669-78. http://dx.doi.org/10.1590/S0100-06832014000200031
Ribeiro PL, Bamberg AL, Reis DA, Oliveira ACB. Condições físico-hídricas de Planossolo cultivado com soja em plantio direto e preparo convencional. Pesq Agropec Bras. 2016;51:1484-91. https://doi.org/10.1590/s0100-204x2016000900047
Salton JC, Mielniczuk J, Bayer C, Boeni M, Conceição PC, Fabrício AC, Macedo MCM, Broch DL. Agregação e estabilidade de agregados do solo em sistemas agropecuários em Mato Grosso do Sul. Rev Bras Cienc Solo. 2008;32:11-21. https://doi.org/10.1590/S0100-06832008000100002
Shepherd. Visual soil assessment - field guide for pastoral grazing and cropping on flat to rolling
country. 2nd ed. Palmerston North: Landcare Research; 2009.
Silva AP, Ball BC, Tormena CA, Giarola NFB, Guimarães RML. Soil structure and greenhouse
gas production differences between row and interrow positions under no-tillage. Sci Agric.
2014;71:157-62. https://doi.org/10.1590/S0103-90162014000200011
Watts CW, Dexter AR. Soil friability: theory, measurement and the effects
of management and organic carbon content. Eur J Soil Sci. 1998;49:73-84. https://doi.org/10.1046/j.1365-2389.1998.00129.x
Zhang H. Organic matter incorporation affects mechanical properties of soil aggregates. Soil Till