Original Article ISSN 1678-4375 (Online)
Analysis of the landscape complexity and heterogeneity of the
Pantanal wetland
C. S. Miranda
a,b*, R. M. Gamarra
b, C. L. Mioto
b, N. M. Silva
c, A. P. Conceição Filho
band
A. Pott
aaPrograma de Pós-graduação em Biotecnologia e Biodiversidade, Rede Pró Centro-Oeste, Universidade Federal de Mato
Grosso do Sul – UFMS, Cidade Universitária, s/n, CEP 79070-900, Campo Grande, MS, Brazil
bLaboratório de Geoprocessamento para Aplicações Ambientais, Faculdade de Engenharias, Arquitetura e Urbanismo e Geografia, Universidade Federal de Mato Grosso do Sul – UFMS, Cidade Universitária, s/n, Unidade 7A, CEP 79070-900,
Campo Grande, MS, Brazil
cInstituto de Ciências Agrárias e Tecnológicas – ICAT, Universidade Federal de Mato Grosso – UFMT,
Rodovia Rondonópolis-Guiratinga, Km 6, CEP 78735-901, Rondonópolis, MT, Brazil *e-mail: [email protected]
Received: June 20, 2016 – Accepted: December 12, 2016 – Distributed: May 31, 2018 (With 5 figures)
Abstract
This is the first report on analysis of habitat complexity and heterogeneity of the Pantanal wetland. The Pantanal encompasses a peculiar mosaic of environments, being important to evaluate and monitor this area concerning conservation of biodiversity. Our objective was to indirectly measure the habitat complexity and heterogeneity of the mosaic forming the sub-regions of the Pantanal, by means of remote sensing. We obtained free images of Normalized Difference Vegetation Index (NDVI) from the sensor MODIS and calculated the mean value (complexity) and standard deviation (heterogeneity) for each sub-region in the years 2000, 2008 and 2015. The sub-regions of Poconé, Canoeira, Paraguai and Aquidauana presented the highest values of complexity (mean NDVI), between 0.69 and 0.64 in the evaluated years. The highest horizontal heterogeneity (NDVI standard deviation) was observed in the sub-region of Tuiuiú, with values of 0.19 in the years 2000 and 2015, and 0.21 in the year 2008. We concluded that the use of NDVI to estimate landscape parameters is an efficient tool for assessment and monitoring of the complexity and heterogeneity of the Pantanal habitats, applicable in other regions.
Keywords: geotechnology, habitat complexity, habitat heterogeneity, NDVI.
Análise da complexidade e heterogeneidade da paisagem do Pantanal
Resumo
Este é o primeiro trabalho sobre análise da complexidade e heterogeneidade de habitats do Pantanal. O Pantanal é constituído por um mosaico de ambientes com características peculiares, sendo importante a avaliação e o monitoramento dessa área voltado para a conservação da biodiversidade. O objetivo do estudo é mensurar de forma indireta a complexidade e a heterogeneidade do mosaico de habitats os quais formam as sub-regiões do Pantanal, por meio do sensoriamento remoto. Foram obtidas, gratuitamente, imagens de índice de vegetação por diferença normalizada (NDVI) do sensor MODIS e calculado o valor de média (complexidade) e desvio padrão (heterogeneidade) para cada sub-região do Pantanal, para os anos de 2000, 2008 e 2015. Os pantanais de Poconé, Canoeira, Paraguai e Aquidauana são as regiões que apresentaram os maiores valores de complexidade (NDVI médio), variando entre 0.69 a 0.64 para os anos avaliados. Maior heterogeneidade (NDVI desvio padrão) foi observada na sub-região pantaneira do Tuiuiú, sendo o valor para os anos de 2000 e 2015 igual a 0.19 e para o ano de 2008 o valor de 0.21, o que implica que a região tem a maior heterogeneidade horizontal quando comparada com as demais sub-regiões. Constata-se que o uso de NDVI na estimativa de parâmetros da paisagem é uma ferramenta eficiente para o reconhecimento e monitoramento da complexidade e heterogeneidade de habitats do Pantanal, replicável em outras regiões.
Palavras-chave: geotecnologias, complexidade do habitat, heterogeneidade do habitat, NDVI.
1. Introduction
The Brazilian Pantanal wetland achieved a position of international focus for its peculiar socio-environmental features, being considered one of the largest wetlands on
Analysis of the complexity and heterogeneity
on the flood pulses. However, the Brazilian Pantanal is not homogeneous, although the whole plain has a common regional genesis, its vegetational physiognomy exhibits distinct characteristics in various sub-regions, subdivided according to natural intrinsec characteristics, such as vegetation, flooding, and sedimentation process (Mioto et al., 2012). There are various delimitations of sub-regions of the Pantanal, summarized by Silva and Abdon (1998) in two groups, those associated with the “Study of the Integrated Development of the Upper Paraguay River Basin “(EDIBAP), such as Sanchez (1977), Brasil (1974) and Adámoli (1981), and those associados to the “Projeto RADAMBRASIL”, such as Franco and Pinheiro (1982), Alvarenga et al. (1982, 1984) and Amaral Filho (1984), beside Silva and Abdon (1998). We followed Mioto et al. (2012), considering that the structure of ecological hierarchy for the sub-regions are mosaics of habitats distinguished by defined criteria, and the mosaic the sub-regions are integrated to form the Pantanal. The formation of the sub-regions of the Pantanal is result of evolutive changes occurring since the Quaternary, what probably influenced the drainage patterns and differences in annual cycles of dry and wet seasons plus exceptional periods of long inundations or droughts causing retraction or expansion of the wetland (Assine et al., 2015), related to vegetational changes.
Therefore, deepening knowledge upon the Pantanal and to execute monitoring are important requirements for conservation of its biodiversity. In addition, studies having an ecological approach are scarce in the Pantanal (Cunha et al., 2012). Such requirements can be reached by means of remote sensing, the science of obtaining data or images of an object or phenomenon distant from the sampling sensor, the key device that captures data from an object or scene remotely (Paranhos-Filho et al., 2016). The target objects have unique spectral characteristics (reflectance or emission regions) which can be identified from detection by remote images (Xie et al., 2008). Due to the spectral response characteristics of the vegetation it is possible to utilize geoprocessing techniques for its identification and evaluation. An example of such techniques is the vegetation index.
The vegetation indexes are result of equations from different combinations of the reflectances in various spectral bands of electromagnetic radiation, as well as radiometric adimensional measures. The objectives of the vegetation indexes in general are to condense the spectral information, discriminate the vegetation types, observe the amount of green biomass, evaluate the conditions of growth of crops, their diseases and pests, droughts, frosts and meteorological events (Liu, 2006). Among several described vegetation indexes, the main ones are Normalized Difference Vegetation Index (NDVI) (Rouse et al., 1974), Soil Brightness Index, Green Vegetation Index (Kauth and Thomas, 1976), Perpendicular Vegetation Index (Richardson and Wiegand, 1977), Soil Adjusted Vegetation Index (Huete, 1988), and Vegetation Condition Index (Kogan, 1990).
The Normalized Difference Vegetation Index (NDVI) is widely utilized in the assessment of several biophysical parameters, such as vegetation coverage, biomass, fraction of the photosynthetically active radiation (Huete et al., 2002)
and phenological variations (Prabakaran et al., 2013). Furthermore, it is a classic example of vegetation mapping utilizing remote sensing, as it deals with the information from reflectances in the spectrum range of red and near-infrared (Xie et al., 2008).
NASA (National Aeronautics and Space Administration) has developed models for the monitoring of soil cover with the objective to assess changes and foresee possible impacts upon the Planet. Thus, a set of products is being routinely generated by NASA with great precision. For example, the products of the sensor Moderate Resolution Imaging Spectroradiometer (MODIS), on board of the satellites TERRA and AQUA, were projected to provide consistent spatial and temporal comparisons of the conditions of the global vegetation and can be used to monitore photosynthetic activity (Running et al., 1994). The main products of MODIS are the vegetation indeces, including NDVI (Huete et al., 2002), obtained free. One of the outstanding characteristics of MODIS is its wide spatial and spectral cover, with imaged area of 2,330 Km wide, with 36 bands, two of them having spatial resolution of 250 m, five bands of 500 m and the other 29 bands with 1000 m (Anderson et al., 2003).
The habitat complexity can be defined as the development of the vertical stratum of the vegetation combined with density of individuals (plants) per area unit (Root, 1973), and the habitat heterogeneity is the vegetation structure in the horizontal plane, i. e. the horizontal relations (Metzger, 2001). Assessing the distribution of the ecological heterogeneity about the space is fundamental to estimate biodiversity (Boyd and Foody, 2011), once it can be directtly related to species diversity (Rocchini et al., 2015).
In this context, our study aims to utilize remote sensing data, especifically the NDVI images from the sensor MODIS and to measure indirectly the habitat complexity and heterogeneity of the mosaic of each sub-region of the Pantanal.
2. Material and Methods
2.1. Study area
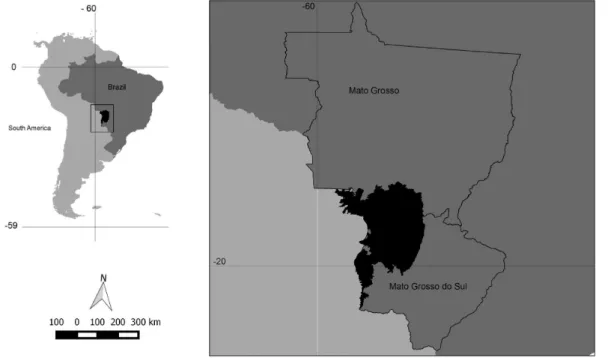
The study area comprehends the Pantanal plain, in the states of Mato Grosso do Sul and Mato Grosso, with an area of 140,640 Km2, located in central-western Brazil,
beside parts in Bolivia and Paraguay (Mioto et al., 2012) (Figure 1). This large wetland shelters a rich biodiversity, including a richness of over 2,000 species of plants, 464 birds, 124 mammals, 177 reptiles, 41 amphibians, and 325 fishes (Junk et al., 2006).
2.2. Normalized difference vegetation index
The Normalized Difference Vegetation Index (NDVI), proposed by Rouse et al. (1974), is calculated by the difference of the vegetation reflectances in the near-infrared (NIR) wavelength and reflectance of the vegetation in the red (R) band (Equation 1). This difference is normalized by the division of NIR and R radiations. For being result of the combination of two bands, the NDVI partially covers-up the effects of the atmospheric constituints and of radiometric and geometric disturbances. The NDVI value varies from -1 to +1. The negative values represent the water bodies, those close to zero represent bare soil or without vegetation, and the values over zero represent the vegetation (Liu, 2006).
(
–) (
/)
= +
NDVI NIR R NIR R (1)
where, NIR: Reflectance of the vegetation in the near-infrared wavelength, and R: Reflectance of the vegetation in the red band.
The mean values of NDVI are considered an indirect measure of the habitat complexity, since they indicate the structural complexity (vertical) and quantity of aerial phytomass of the habitat. Yet the standard deviation of the NDVI values was considered an indirect measure of the habitat heterogeneity, since it indicates the variation/dispersion of the vertical complexity and of the aboveground phytomass of the habitat in the horizontal plane (Corrêa et al., 2011; Oliveira et al., 2012, Gamarra, 2013).
2.3. Data acquisition and processing of data
To perform our work, we obtained images from the sensor MODIS of the satellite TERRA, product MOD13Q1, quadrants h12v10 and h12v11, available in a 16-day composite of cloud-free images, spatial resolution of 250 m, on the site of the USGS – United States Geological Survey. Among the available scenes, we chose the espectral bands of red (R), near-infravred (NIR), and mean infrared (MIR), for elaboration of the false-color compositions, i. e. the channels RGB (red-green-blue) composed of MIR, NIR, R, respectively, plus the already available NDVI (product MOD13Q1). It is interesting to point out that the MODIS products already present geometric and radiometric correction, what eases their utilization. Worth mentioning is that such images are capable to cover the whole studied region in a single day, preventing seasonal and phenological variations to interfere (Paranhos-Filho et al., 2014).
The selected dates were 12/08/2000, 12/08/2008 and 13/08/2015 (USGS, 2000, 2008, 2015), corresponding to the dry season in the Pantanal. We performed the conversion of the projection of the acquired scenes to cartographic projection UTM, Datum WGS1984, zone 21S, and next we followed the procedure of image cropping for each sub-region and for each evaluated year. We utilized the open and free software QGIS 2.8 (QGIS Development Team, 2015) for the procedures with the images, including the mean value of NDVI (indirect estimate of the complexity) and the NDVI standard deviation (indirect estimate of heterogeneity), beside minimum and maximum values.
Analysis of the complexity and heterogeneity
3. Results
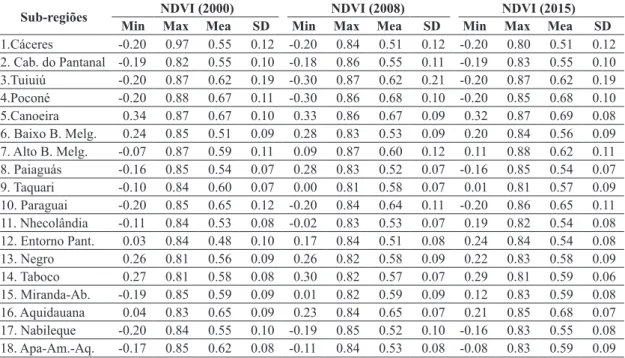
The values extracted from the descriptive analysis of the NDVI data are presented in Table 1. We ascertained that for all the Pantanal sub-regions the mean NDVI values showed a variation of 0.48 to 0.67 in the year 2000, 0.51 to 0.68 in 2008 and 0.51 to 0.69 in 2015. We observed that in the year 2000 the Pantanal plain exhibited the largest quantity of wet area and water bodies.
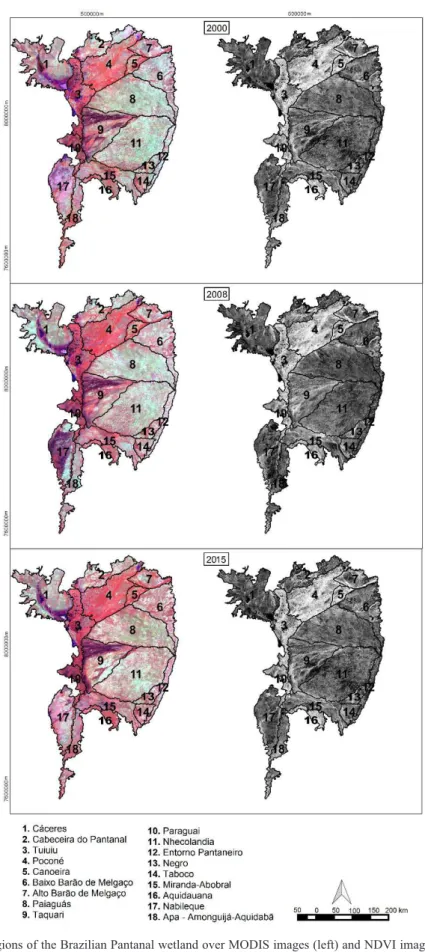
The sub-regions of Poconé, Canoeira, Paraguai and Aquidauana are the sub-regions with the highest values of complexity (mean NDVI), varying between 0.69 and 0.64 for the evaluated years. We highlight that these sub-regions are mostly composed of forest formations, what implies in its vertical structure being more complex and with higher phytomass when compared with the other sub-regions. This finding was noted by the photointerpretation of the composite image in false-color RGB (Figure 2). For each year and in each sub-region of the Pantanal, it was possible to observe areas with predominance of denser vegetation, representing the arboreal/shrubby class and other areas with predominance of short vegetation (grasslands) and with presence of wet areas.
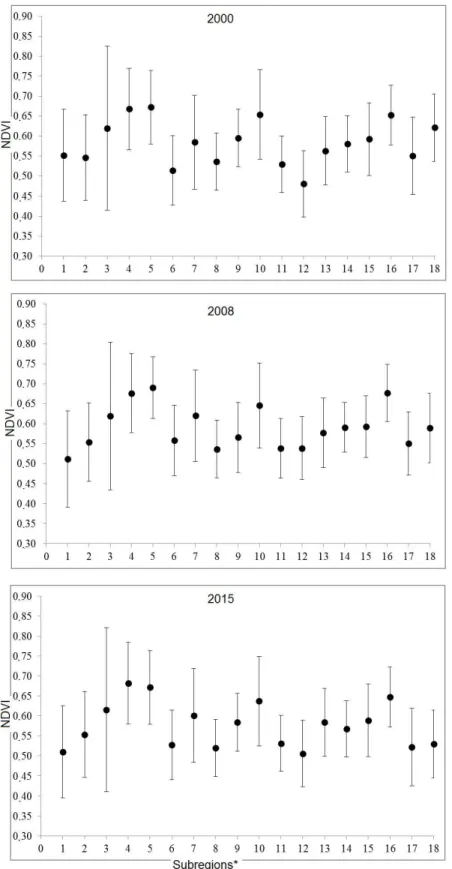
We verified the highest heterogeneity (NDVI standard deviation) in the sub-region Tuiuiú, with values of 0.19 for the years 2000 and 2015, and 0.21 for 2008, what signifies that it had the highest horizontal heterogeneity compared with other sub-regions. The heterogeneity in the sub-region Tuiuiú is evidenced by its landscape formed by expressive areas of water bodies, wet areas and vegetation. In the other sub-regions, the standard deviation stays within 0.12 to 0.08 (Figure 3).
The NDVI values of the Pantanal sub-regions were concentrated in the range 0.5 to 0.6. The sub-regions which extrapolate this range for the entire analyzed period are the same differing in heterogeneity and complexity: Tuiuiú, Poconé, Canoeira, Paraguai and Aquidauana. In addition to those sub-regions, for the year 2000 the sub-region of Apa-Amonguijá-Aquidabã also extrapolates the predominant band, and in the years 2008 and 2015 Alto Barão de Melgaço is another sub-region with NDVI above 0.6 (Figure 3).
The highest NDVI values (above 0.75) were reached by the sub-regions of Tuiuiú, Poconé, Canoeira and Paraguai for the entire studied period. Nonetheless, only the sub-region Tuiuiú reached values above 0.8, what confirmed the presence of florest formations there. Yet the lowest values (bellow 0.4) were obtained in the year 2000 in the sub-region Entorno Pantaneiro, and in the years 2008 and 2015 in the sub-region of Cáceres.
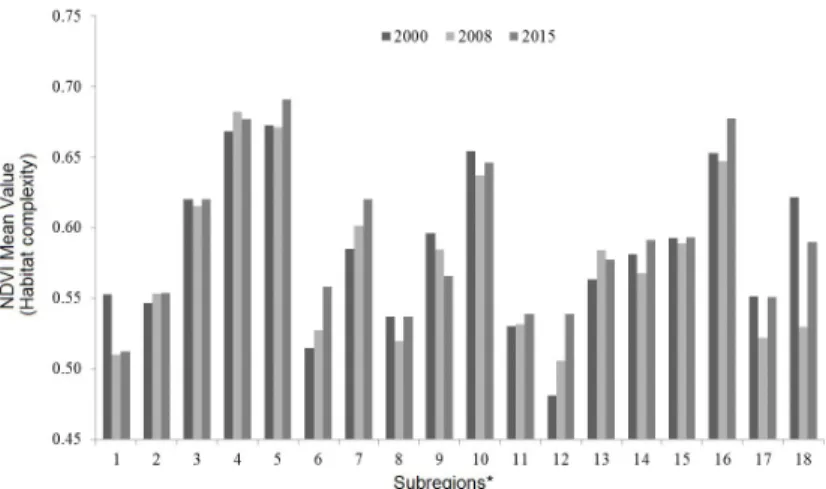
The temporal dynamics of the habitat complexity of the Pantanal sub-regions in the years 2000, 2008 and 2015 is observed in Figure 4. A constant increase was observed during this period in the sub-regions of Alto Barão Melgaço, Baixo Barão Melgaço and Entorno Pantaneiro, with increase of 6%, 8% and 12%, respectively. Nevertheless, in the sub-sub-region Taquari occurred a 5% reduction in complexity.
In the analyzed period it is possible to claim a reduction of 15%, 21%, 19%, 21%, 11%, 9% and 26% in the dynamics of habitat heterogeneity, respectively in the sub-regions of Aquidauana, Canoeira, Entorno Pantaneiro, Nabileque, Paraguai, Poconé and Taboco (Figure 5).
Table 1. Descriptive statistical values: Minimum (Min), Máximo (Max), Mean (Mea), Standard Deviation (SD), Normalized
Difference (NDVI) of the years 2000, 2008 and 2015.
Sub-regiões NDVI (2000) NDVI (2008) NDVI (2015)
Min Max Mea SD Min Max Mea SD Min Max Mea SD
1.Cáceres -0.20 0.97 0.55 0.12 -0.20 0.84 0.51 0.12 -0.20 0.80 0.51 0.12
2. Cab. do Pantanal -0.19 0.82 0.55 0.10 -0.18 0.86 0.55 0.11 -0.19 0.83 0.55 0.10
3.Tuiuiú -0.20 0.87 0.62 0.19 -0.30 0.87 0.62 0.21 -0.20 0.87 0.62 0.19
4.Poconé -0.20 0.88 0.67 0.11 -0.30 0.86 0.68 0.10 -0.20 0.85 0.68 0.10
5.Canoeira 0.34 0.87 0.67 0.10 0.33 0.86 0.67 0.09 0.32 0.87 0.69 0.08
6. Baixo B. Melg. 0.24 0.85 0.51 0.09 0.28 0.83 0.53 0.09 0.20 0.84 0.56 0.09 7. Alto B. Melg. -0.07 0.87 0.59 0.11 0.09 0.87 0.60 0.12 0.11 0.88 0.62 0.11
8. Paiaguás -0.16 0.85 0.54 0.07 0.28 0.83 0.52 0.07 -0.16 0.85 0.54 0.07
9. Taquari -0.10 0.84 0.60 0.07 0.00 0.81 0.58 0.07 0.01 0.81 0.57 0.09
10. Paraguai -0.20 0.85 0.65 0.12 -0.20 0.84 0.64 0.11 -0.20 0.86 0.65 0.11 11. Nhecolândia -0.11 0.84 0.53 0.08 -0.02 0.83 0.53 0.07 0.19 0.82 0.54 0.08 12. Entorno Pant. 0.03 0.84 0.48 0.10 0.17 0.84 0.51 0.08 0.24 0.84 0.54 0.08
13. Negro 0.26 0.81 0.56 0.09 0.26 0.82 0.58 0.09 0.22 0.83 0.58 0.09
14. Taboco 0.27 0.81 0.58 0.08 0.30 0.82 0.57 0.07 0.29 0.81 0.59 0.06
15. Miranda-Ab. -0.19 0.85 0.59 0.09 0.01 0.82 0.59 0.09 0.12 0.83 0.59 0.08
16. Aquidauana 0.04 0.83 0.65 0.09 0.23 0.84 0.65 0.07 0.21 0.85 0.68 0.07
Figure 2. Sub-regions of the Brazilian Pantanal wetland over MODIS images (left) and NDVI images (right) of the years
Analysis of the complexity and heterogeneity
Figure 3. Mean values (dot) and standard deviation (bar) of NDVI of the sub-regions of the Brazilian Pantanal wetland.
4. Discussion
There are other subdivisions of the Pantanal, but we followed Mioto et al. (2012) because they used NVDI to define a new map of sub-regions. For example, the previous sub-region of Poconé had been split into Cabeceira do Pantanal and Poconé because they have distinct flooding, soil and vegetation. The sub-region Taquari is different from Nhecolândia and Paiaguás where it traditionally belong to, due to the increased flooded delta after silting of the
Figure 4. Analysis of the dynamics of the habitat complexity (NDVI mean value) of the sub-regions of the Brazilian
Pantanal wetland in the years 2000, 2008 and 2015. *Sub-regions: 1. Cáceres; 2. Cabeceira do Pantanal; 4. Poconé; 3. Tuiuiú; 5. Canoeira; 6. Baixo Barão de Melgaço; 7. Alto Barão de Melgaço; 8. Paiaguás; 9. Taquari; 10. Paraguai; 11. Nhecolândia; 12. Entorno Pantaneiro; 13. Negro; 14. Taboco; 15. Miranda-Abobral; 16. Aquidauana; 17. Nabileque; 18.
Apa-Amonguijá-Aquidabã.
Figure 5. Analysis of the dynamics of the habitat heterogeneity (NDVI standard deviation) of the sub-regions of the
Brazilian Pantanal wetland in the years 2000, 2008 and 2015. *Sub-regions: 1. Cáceres; 2. Cabeceira do Pantanal; 3. Tuiuiú; 4. Poconé; 5. Canoeira; 6. Baixo Barão de Melgaço; 7. Alto Barão de Melgaço; 8. Paiaguás; 9. Taquari; 10. Paraguai; 11. Nhecolândia; 12. Entorno Pantaneiro; 13. Negro; 14. Taboco; 15. Miranda-Abobral; 16. Aquidauana; 17. Nabileque; 18. Apa-Amonguijá-Aquidabã.
Taquari river, and the consequent changes in vegetation (Pott and Pott, 2006).
Analysis of the complexity and heterogeneity
Thus, this study is a response in view of the need to test methods to analyse lanscape changes and the habitat complexity and heterogeneity considering the spatial and temporal aspect. It is an important task for ecologists and biogeographers (He et al., 2009). Another key issue is the aplicability and the possibility of replication of the method in other study areas, once the utilized images are from the sensor MODIS and the software QGIS, of free global access. Thus, we applied the method to indirectly evaluate the habitat complexity and heterogeneity, respectively by using the NDVI mean value and standard deviation.
We found that most habitats forming the Pantanal have the NDVI concentrated in the range of 0.5 to 0.6, such values represent a vegetation class of lower aerial biomass compared with a forest formation. According to Andrade et al. (2012), the aforementioned values fit into the class of cerrado/savanna and grasslands, and yet in accordance with Oliveira et al. (2012), NDVI values over 0.3 has higher refletance in the infra-red and correspond to healthy vegetation. The sub-regions of Poconé, Canoeira, Paraguai and Aquidauana presented the highest mean values of NDVI, hence they have a higher habitat complexity and consequently higher density of above ground phytomass, an indicator of differentiation in relation to habitat mosaics of the Pantanal (Huete et al., 2002; Giraldelli and Paranhos-Filho, 2006; Andrade et al., 2012; Galvanin et al., 2014). These sub-regions also extrapolate the range of predominant NDVI values. Large areas of Poconé, Canoeira and Paraguai have had encroachment of trees, e.g. Vochysia divergens Pohl.
The structure and complexity of landscapes often differ between protected areas and their surroundings (Nagendra et al., 2013), since the increased habitat complexity is indicative of regeneration of arboreal physiognomies (Gamarra, 2013). Monitoring the complexity of the mosaics of habitats of the Pantanal revealed the increase over time in the sub-regions of Upper and Lower Barão de Melgaço and Entorno Pantaneiro. We can infer that a possible increase of species richness occurred due to the increased complexity of vertical structure, since more niches would be available (Lang and Blaschke, 2009). In Barão de Melgaço also occurred woody encroachment and a large reserve (SESC Pantanal) established there is under succession to denser vegetation, what probably influenced the NDVI.
We observed that the spectral response of the vegetation is a powerful tool in the analysis of variation of habitat composition (Rocchini et al., 2010). Therefore, we utilized the NDVI standard deviation measured for each mosaic of habitats of the Pantanal to evaluate their heterogeneity. We verified that the sub-region Tuiuiú is the most heterogeneous, what combined with the photointerpretation of satellite image indicates a fragmented landscape composed of a vegetational mosaic of forest, savanna and the expressive presence of water bodies. The latter class is characterized by its high standard deviation, probably explained by the presence of vegetation inside water bodies, according to Andrade et al. (2012), who performed an analysis of NDVI for
each class of soil cover in the Pantanal and observed that the class regarding water showed the highest standard deviation, attributed to the presence of vegetation in the class water. This justifies the highest standard deviation of the sub-region Tuiuiú. Although most sub-regions are under the dry season in August, by then the Tuiuiú is still flooded due to the delayed flow of the Paraguay river from the upper basin (Arruda et al., 2016). Such aquatic vegetation over water bodies was described in that area (Catian et al., 2012).
The multitemporal analysis revealed a reduction in habitat heterogeneity in the sub-regions of Aquidauana, Canoeira, Entorno Pantaneiro, Nabileque, Paraguai, Poconé and Taboco, what points out a simplification in the vegetational mosaic. It is an indicative that the physiognomies are evolving towards the same type of vegetation form (Gamarra, 2013). In most of these sub-regions the simplification can be attributed to cultivated pastures.
Nagendra et al. (2013) point out that the global monitoring to pursue conservation of biodiversity should include the assessment of changes in habitat and landscape structure. The use of remote sensing proved to be an efficient tool for assessment and monitoring conservation of biodiversity, once it optimizes costs and time, with periodically available data (Gamarra, 2013; Galvanin et al., 2014). Therefore, it is a potential instrument in studies of landscape ecology, since it allows to monitor species diversity, considering the environmental gradients and spatial discontinuities (Rocchini et al., 2010). The use of NDVI efficiently otimized the discrimination of the main habitats, e. g. in the sub-region of Cáceres (Galvanin et al., 2014), to estimate habitat condition, particularly regarding vegetation cover, compared to conventional mappings (He et al., 2009).
5. Conclusion
The generated products and the applied technique could be useful for public managers and decision makers to monitor landscape variables, complexity and heterogeneity, in the habitat mosaics forming the Pantanal, for implementation of public policies, plans of recovery, delimitation of strategic areas for conservation and other actions aiming maintenance of the ecosystemic services of the Pantanal, a heritage of mankind.
Acknowledgements
To the Brazilian research funding agencies CAPES (Coordenação de Aperfeiçoamento de Pessoal de Nível Superior) and FUNDECT (Fundação de Apoio do Desenvolvimento do Ensino, Ciência e Tecnologia do Estado de Mato Grosso do Sul) for scholarhip to Ciomara de Souza. Miranda and Camila Leonardo Mioto, and to CNPq (Conselho Nacional de Pesquisas e Desenvolvimento Tecnológico) for research grant to Antonio Conceição Paranhos Filho and Arnildo Pott.
References
ADÁMOLI, J., 1981. O Pantanal e suas relações fitogeográficas
com os cerrados: discussão sobre o conceito “Complexo do
Pantanal”. In: 32º Anais Congresso Nacional de Botânica, 1981.
Teresina. Brasília: Sociedade Botânica do Brasil, pp. 109-119. ALVARENGA, S.M., BRASIL, A.E. and DEL’ARCO, D.M.,
1982. Geomorfologia. In: BRASIL. Projeto RADAMBRASIL.
Folha SE. Campo Grande: Ministério das Minas e Energia, pp. 125-184. Levantamento de Recursos Naturais, 28.
ALVARENGA, S.M., BRASIL, A.E., PINHEIRO, R. and KUX,
H.J.H., 1984. Estudo geomorfológico aplicado à Bacia do Alto
Paraguai e Pantanais Matogrossenses. In: BRASIL. Projeto RADAMBRASIL. Salvador: Ministério das Minas e Energia, pp.
89-183. Boletim Técnico Série Geomorfológica.
AMARAL FILHO, Z.P., 1984. Solos do Pantanal Mato-grossense. In: Anais Simpósio Sobre Recursos Naturais e Sócio-Econômicos do Pantanal, Corumbá. Brasília: Embrapa-DDT, pp. 91-104.
ANDERSON, L.O., LATORRE, M.L., SHIMABUKURO, Y.E., ARAI, E. and CARVALHO-JUNIOR, O.A., 2003 [viewed 20
November 2015]. Sensor MODIS: uma abordagem geral [online]. São José dos Campos: INPE. Available from: http://urlib.net/sid.
inpe.br/marciana/2003/12.11.08.55
ANDRADE, R.G., SEDIYAMA, G.C., PAZ, A.R., LIMA, E.P. and FACCO, A.G., 2012. Geotecnologias aplicadas à avaliação
de parâmetros biofísicos do Pantanal. Pesquisa Agropecuária Brasileira, vol. 47, no. 9, pp. 1227-1234. http://dx.doi.org/10.1590/ S0100-204X2012000900007.
ARRUDA, W.S., OLDELAND, J., PARANHOS FILHO, A.C., POTT, A., CUNHA, N.L., ISHII, I.H. and DAMASCENO-JUNIOR,
G.A., 2016. Inundation and fire shape the structure of riparian forests in the Pantanal, Brazil. PLoS One, vol. 11, no. 6, pp. 1-18.
http://dx.doi.org/10.1371/journal.pone.0156825.
ASSINE, M., MACEDO, H., STEVAUX, J., BERGIER, I.,
PADOVANI, C. and SILVA, A., 2015. Avulsive rivers in the
hydrology of the pantanal wetland. In: I. BERGIER and M.L. ASSINE, eds. Dynamics of the Pantanal Wetland in South America. Heidelberg: Springer Berlin. pp. 83-110. The Handbook of Environmental Chemistry, 37.
BOYD, D.S. and FOODY, G.M., 2011. An overview of recent
remote sensing and GIS based research in ecological informatics.
Ecological Informatics, vol. 6, no. 1, pp. 25-36. http://dx.doi.
org/10.1016/j.ecoinf.2010.07.007.
BRASIL. Ministério do Interior – MINTER, 1974. Estudos hidrológicos da Bacia do Alto Paraguai. Rio de Janeiro: DNOS.
284 p.
BRASIL, 1988. Constituição da República Federativa do Brasil.
Diário Oficial da União, Brasilia, 5 de outubro.
CATIAN, G., LEME, F.M., FRANCENER, A., CARVALHO, F.S., GALLETTI, V.S., POTT, A., POTT, V.J., SCREMIN-DIAS, E. and DAMASCENO-JUNIOR, G.A., 2012. Macrophyte structure
in lotic-lentic habitats from Brazilian Pantanal. Oecologia Australis, vol. 16, no. 4, pp. 782-796. http://dx.doi.org/10.4257/ oeco.2012.1604.05.
CORRÊA, C.C., PIMENTA, M., DUTRA, S.L. and
MARCO-JÚNIOR, P., 2011. Utilização do NDVI na avaliação da resposta de besouros herbívoros à complexidade e heterogeneidade ambiental em diferentes escalas no Bioma cerrado. In: Anais XV Simpósio Brasileiro de Sensoriamento Remoto, 30 abril - 05 maio 2011,
Curitiba. Curitiba: INPE, pp. 3103-3110.
CUNHA, N.L., DELATORRE, M., RODRIGUES, R.B., VIDOTTO, C., GONÇALVES, F., SCREMIN-DIAS, E.,
DAMASCENO-JÚNIOR, G., POTT, V.J. and POTT, A., 2012. Structure of
aquatic vegetation of a large lake, western border of the Brazilian
Pantanal. Brazilian Journal of Biology = Revista Brasileira de Biologia, vol. 72, no. 3, pp. 519-531. http://dx.doi.org/10.1590/ S1519-69842012000300015.
FRANCO, M.S.M. and PINHEIRO, R., 1982. Geomorfologia. In: BRASIL – Projeto RADAMBRASIL. Folha SE.21 Corumbá / Folha SE.20. Rio de Janeiro: Ministério das Minas e Energia, pp. 161-224. Levantamento de Recursos Naturais, 27. GALVANIN, E.A.S., NEVES, S.M.A.S., CRUZ, C.B.M., NEVES, R.J., JESUS, P.H.H. and KREITLOW, J.P., 2014. Evaluation of
vegetation indexes NDVI, SR and TVI in the discrimination of vegetation types of environments of ‘Pantanal’ in Cáceres, Mato
Grosso state. Ciência Florestal, vol. 24, no. 3, pp. 707-715. GAMARRA, R.M., 2013. Geotecnologias na análise da estrutura e dinâmica da paisagem do Parque Estadual das Nascentes do rio Taquari-MS. Campo Grande: Universidade Federal do Mato Grosso do Sul, 112 p. Tese de Doutorado em Ecologia e Conservação.
GIRALDELLI, G.R. and PARANHOS-FILHO, A.C., 2006. Relação entre as variáveis estruturais do habitat e o índice de
vegetação de diferença normalizada (NDVI) em três tipos de habitat de cerrado na fazenda Diamante, Coxim, MS. In: Anais 1º Simpósio de Geotecnologias no Pantanal. Campo Grande:
Embrapa Informática Agropecuária, INPE, pp. 341-350. HE, K.S., ZHANG, J. and ZHANG, Q., 2009. Linking variability
in species composition and MODIS NDVI based on beta diversity
measurements. Acta Oecologica, vol. 35, no. 1, pp. 14-21. http://
dx.doi.org/10.1016/j.actao.2008.07.006.
HUETE, A., DIDAN, K., MIURA, T., RODRIGUEZ, E.P., GAO, X. and FERREIRA, L.G., 2002. Overview of the radiometric
and biophysical performance of the MODIS vegetation índices.
Remote Sensing of Environment, vol. 83, no. 1-2, pp. 195-213.
http://dx.doi.org/10.1016/S0034-4257(02)00096-2.
HUETE, A.R., 1988. A soil-adjusted vegetation index (SAVI).
Remote Sensing of Environment, vol. 25, no. 3, pp. 295-309.
http://dx.doi.org/10.1016/0034-4257(88)90106-X.
JUNK, W.J., CUNHA, C.N., WANTZEN, K.M., PETERMANN, P., STRÜSSMANN, C., MARQUES, M.I. and ADIS, J., 2006.
Biodiversity and its conservation in the Pantanal of Mato Grosso,
Brazil. Aquatic Sciences, vol. 68, no. 3, pp. 278-309. http://dx.doi. org/10.1007/s00027-006-0851-4.
KAUTH, R.J., THOMAS, G.S., 1976. The tasseled cap: a graphic
Analysis of the complexity and heterogeneity
crops as seen in Landsat. In: Proceedings on the Symposium on Machine Processing of Remotely Sensed Data, June 29 - July 01.
West Lafayette. West Lafayette: Purdue University, pp. 41-51. KOGAN, F.N., 1990. Remote sensing of weather impacts on
vegetation in non-homogeneous areas. Yaogan Xuebao, vol. 11, no. 8, pp. 1405-1419.
LANG, S. and BLASCHKE, T., 2009. Análise da paisagem com SIG. São Paulo: Oficina de Textos. 424 p.
LIU, W.T.H., 2006. Aplicações de Sensoriamento Remoto. Campo
Grande: Editora UNIDERP. 908 p.
METZGER, J.P., 2001. O que é ecologia de paisagens? Biota Neotropica, vol. 1, no. 1, pp. 1-9.
MIOTO, C.L., PARANHOS-FILHO, A.C. and ALBREZ, E.A.,
2012. Contribuição à caracterização das sub-regiões do Pantanal.
Revista Entre-Lugar, vol. 8, pp. 165-180.
NAGENDRA, H., LUCAS, R., HONRADO, J.P., JONGMAN,
R.H.G., TARANTINO, C., ADAMO, M. and MAIROTA, P., 2013.
Remote sensing for conservation monitoring: assessing protected
areas, habitat extent, habitat condition, species diversity, and threats. Ecological Indicators, vol. 33, pp. 45-59. http://dx.doi.
org/10.1016/j.ecolind.2012.09.014.
OLIVEIRA, E.F., SILVA, E.A., FERNANDES, C.E., PARANHOS
FILHO, A.C., GAMARRA, R.M., RIBEIRO, A.A., BRAZIL, R.P. and OLIVEIRA, A.G., 2012. Biotic factors and occurrence of
Lutzomyia longipalpis in endemic area of visceral leishmaniasis,
Mato Grosso do Sul, Brazil. Memorias do Instituto Oswaldo Cruz, vol. 107, no. 3, pp. 396-401. http://dx.doi.org/10.1590/ S0074-02762012000300015.
PALMER, M.W., EARLS, P., HOAGLAND, B.W., WHITE, P.S. and WOHLGEMUTH, T., 2002. Quantitative tools for perfecting species lists. Environmetrics, vol. 13, no. 2, pp. 121-137. http:// dx.doi.org/10.1002/env.516.
PARANHOS-FILHO, A.C., MIOTO, C.L., MARCATO-JUNIOR, J.C. and TORRES, T.G., 2016. Geotecnologias em aplicações ambientais. Campo Grande: Editora UFMS. 383 p.
PARANHOS-FILHO, A.C., MOREIRA, E.S., OLIVEIRA, A.K.M., PAGOTTO, T.C.S. and MIOTO, C.L., 2014 [viewed
18 July 2006]. Análise da variação da cobertura do solo no Pantanal de 2003 a 2010 através de sensoriamento remoto.
Engenharia Sanitaria e Ambiental [online], vol. 19, pp. 69-76. Número Especial. Available from: http://www.scielo.br/scielo. php?script=sci_arttext&pid=S1413-41522014000500069&lng=en& nrm=iso. http://dx.doi.org/10.1590/S1413-41522014019010000305.
POTT, A. and POTT, V.J., 2006. Alterações florísticas na planície
do baixo Taquari. In: S. GALDINO, L.M. VIEIRA and L.A. PELLEGRIN, eds. Impactos ambientais e sócio-econômicos na Bacia do Rio Taquari, Pantanal. Embrapa Pantanal: Corumbá, pp. 255-289.
PRABAKARAN, C., SINGH, C.P., PANIGRAHY, S. and PARIHAR,
J.S., 2013. Retrieval of forest phenological parameters from remote sensing-based NDVI time-series data. Current Science, vol. 105, no. 6, pp. 795-802.
QGIS DEVELOPMENT TEAM, 2015 [viewed 18 June 2016].
QGIS. Versão 2.8 [software]. Available from: http://www.qgis. org/pt_BR/site/index.html.
RICHARDSON, A.J. and WIEGAND, C.L., 1977. Distinguishing
vegetation from soil background information. Photogrammetric Engineering and Remote Sensing, vol. 43, no. 12, pp. 1541-1552.
ROCCHINI, D., BALKENHOL, N., CARTER, G.A., FOODY, G.M., GILLESPIE, T.W., HE, K.S., KARK, S., LEVIN, N., LUCAS, K., LUOTO, M., NAGENDRA, H., OLDELAND, J., RICOTTA, C., SOUTHWORTH, J. and NETELER, M., 2010.
Remotely sensed spectral heterogeneity as a proxy of species
diversity: recent advances and open challenges. Ecological Informatics, vol. 5, no. 5, pp. 318-329. http://dx.doi.org/10.1016/j. ecoinf.2010.06.001.
ROCCHINI, D., HERNÁNDEZ-STEFANONI, J.L. and HE, K.S., 2015. Advancing species diversity estimate by remotely
sensed proxies: a conceptual review. Ecological Informatics, vol. 25, pp. 22-28. http://dx.doi.org/10.1016/j.ecoinf.2014.10.006.
ROOT, R.B., 1973. Organization of a plant-arthropod association
in a simple and diverse habitats: the fauna of collards (Brassica oleracea). Ecological Monographs, vol. 43, no. 1, pp. 95-124. http://dx.doi.org/10.2307/1942161.
ROUSE, J., HAAS, R., SCHELL, J., DEERING, D. and HARLAN,
J., 1974 [viewed 6 February 2016]. Monitoring the Vernal Advancement of Retrogradation of Natural Vegetation: Final Report
[online]. Greenbelt: NASA/GSFC, 371 p. Available from: http:// ntrs.nasa.gov/archive/nasa/casi.ntrs.nasa.gov/19740008955.pdf RUNNING, S.W., JUSTICE, C.O., SALOMONSON, V., HALL, D., BARKER, J., KAUFMANN, Y.J., STRAHLER, A.H., HUETE, A.R., MULLER, J.P., VANDERBILT, V., WAN, Z.M., TEILLET, P. and CARNEGGIE, D., 1994. Terrestrial remote sensing Science
and algorithms planned for EOS/MODIS. International Journal of Remote Sensing, vol. 15, no. 17, pp. 3587-3620. http://dx.doi. org/10.1080/01431169408954346.
SANCHEZ, R.O., 1977. Estudo fluviomorfológico del Pantanal: regionalización, sub-regionalización y sectorización geográfico de la depression de la alta cuenca del Rio Paraguai. Brasília: EDIBAP. 50 p.
SILVA, J.S. and ABDON, M.M., 1998. Delimitação do Pantanal Brasileiro e suas sub-regiões. Pesquisa Agropecuária Brasileira,
vol. 33, pp. 1703-1711. Número Especial.
UNITED STATES GEOLOGICAL SURVEY – USGS, 2000 [viewed 10 January 2016]. Imagens MODIS [online]. Quadrantes
h12v10 e h12v11. Datas de Passagem 12 de agosto de 2000.
Available from: https://mrtweb.cr.usgs.gov
UNITED STATES GEOLOGICAL SURVEY – USGS, 2008 [viewed 10 January 2016]. Imagens MODIS [online]. Quadrantes
h12v10 e h12v11. Datas de Passagem 12 de agosto de 2008.
Available from: https://mrtweb.cr.usgs.gov
UNITED STATES GEOLOGICAL SURVEY – USGS, 2015 [viewed 10 January 2016]. Imagens MODIS [online]. Quadrantes
h12v10 e h12v11. Datas de Passagem 13 de agosto de 2015.
Available from: https://mrtweb.cr.usgs.gov
XIE, Y., SHA, Z. and YU, M., 2008. Remote sensing imagery in