www.ccarevista.ufc.br ISSN 1806-6690
Availability and spatial variability of copper, iron, manganese and zinc
in soils of the State of Ceará, Brazil
1Disponibilidade e variabilidade espacial de cobre, ferro, manganês e zinco em solos
do Estado do Ceará, Brasil
Mara Lucia Jacinto Oliveira2*, Gustavo Souza Valladares2, Johnston Silva Vieira2 and Ricardo Marques Coelho3
ABSTRACT -The aim of the present work was to: (i) determine and map the micronutrient content (copper - Cu, iron - Fe, manganese - Mn and zinc - Zn) in soils of the State of Ceará; (ii) evaluate soil attributes related to micronutrient availability; and (iii) evaluate, by ordinary kriging, the spatial dependence of the micronutrient content. The study area is located in the central region of Ceará, in the basin of the River Banabuiú. Soil samples were collected in the surface and subsurface layers to determine the chemical attributes, granulometry, and micronutrient content, extracted with Mehlich-1 solution. The sites of the principal types of soil in the region were spatialised and the results submitted to descriptive analysis and Pearson correlation analysis. The semivariograms with the best fit were tested using the ordinary kriging method, and the maps of spatial variability were prepared. The highest values for the mean, maximum and minimum levels of Cu and Fe are found in the subsurface layers, while for Mn and Zn, they are found in the surface layers. In the surface layers, the majority of soils present Fe, Mn and Zn in levels suitable for agricultural production, while the levels of Cu are classified as medium to low. The micronutrients showed a significant positive correlation, especially with the soil attributes and with each other. Cu, Fe, Mn and Zn are classified as having medium to strong spatial dependence in the surface and subsurface layers.
Key words: Cationic micronutrients. Geostatistics. Ordinary kriging. Soils of the semi-arid region.
RESUMO -O presente trabalho teve por objetivos: (i) determinar e mapear os teores dos micronutrientes (cobre - Cu, ferro - Fe, manganês - Mn e zinco - Zn) em solos do Estado do Ceará; (ii) avaliar atributos do solo relacionados à disponibilidade dos micronutrientes; (iii) avaliar, por krigagem ordinária, a dependência espacial dos teores dos micronutrientes. A área estudada está localizada na região central do Ceará, na bacia do Rio Banabuiú. Amostras de solo foram coletadas, nas camadas superficiais e subsuperficiais, para determinação dos atributos químicos, granulometria, e dos teores de micronutrientes, extraídos com solução de Mehlich-1. Os pontos dos principais tipos de solos da região foram espacializados. Os resultados foram submetidos a análises descritivas e análises de correlação de Pearson. Foram testados os semivariogramas que tiveram os melhores ajustes, utilizando o método de krigagem ordinária, e elaborados os mapas de variabilidade espacial. Os maiores teores de média, máximo e mínimo para Cu e Fe se encontram nas camadas subsuperficiais, e para Mn e Zn nas camadas superficiais. Nas camadas superficiais, a maioria dos solos apresentam Fe, Mn e Zn em teores adequados à produção agrícola, e Cu apresenta teores nas classes médio a baixo. Os micronutrientes apresentaram correlações significativas positivas, principalmente, com os atributos dos solos e entre si. Cu, Fe, Mn e Zn apresentam dependência espacial classificada como média a forte, nas camadas superficiais e subsuperficiais.
Palavras-chaves: Micronutrientes catiônicos. Geoestatística. Krigagem ordinária. Solos do semiárido.
DOI: 10.5935/1806-6690.20180042 *Author for correspondence
Received for publication in 18/04/2017; approved 26/10/2017
1Parte da Dissertação de Mestrado do terceiro autor apresentada na Universidade Federal do Piauí, pesquisa apoiada pela Petrobrás, CAPES e CNPq 2Universidade Federal do Piauí, Teresina-PI, Brasil, [email protected], [email protected], [email protected]
INTRODUCTION
Knowledge of the relationship between soil fertility and agricultural productivity is central to
agriculture. According to Novais et al. (2007), each
tonne of mineral fertiliser applied to one hectare, following the principles for maximum efficiency, is equivalent in production to four new hectares without fertiliser. In areas of agriculture generally restricted to nitrogen-phosphorus-potassium (NPK) fertiliser, the demand for micronutrients under the various conditions of soil, climate and crops becomes important.
According to Sharmaet al. (2013), the availability
of micronutrients is influenced by several factors: soil type and chemical attributes, chemical speciation and concentration, soil pH, nutrient cycling, the element source and the nature of the microorganisms. Investigating the shortage of these elements, as well as their variability in relation to soil attributes, allows their availability to be predicted and promotes the efficient use of correctives
and fertilisers (BIONDIet al., 2011; PIERANGELIet al.,
2009).
A study of the variability of soil attributes is a basic tool for interpreting the spatial distribution of data, with a strong impact on results and decision-making
(MELO et al., 2016; VALLADARES et al., 2009).
Geostatistics is defined as a set of spatial modelling techniques, including probabilistic sampling, which allow surfaces to be mapped and data to be gauged at unsampled sites, taking into account the spatial and/or temporal behaviour of a particular phenomenon and reducing any error in this evaluation (LADO; HENGL; REUTER, 2008). Such techniques make it possible to understand the continuity of a variable of interest throughout the study area, demonstrating the spatial variation of the phenomenon through maps of spatial variability (CHAVES; FARIAS, 2009).
Ryan et al. (2013) found that studies of
micronutrient mapping by geostatistics facilitated the definition of suitable management practices for each site, improving the efficiency of fertiliser application, which
could reduce cultivation costs. Tekinet al. (2011) found
the spatial variability of iron (Fe), manganese (Mn), copper (Cu) and zinc (Zn) to be related to the properties of the soil and the maize crop. The spatial heterogeneity of the studied variables was influenced by the difference in soil texture throughout the area under study. Valladares
et al. (2009) found a high positive spatial correlation
between the Cu and Zn content of soils in the State of São Paulo, as well as a relationship between content and land use, where higher levels were found in areas of vineyards compared to native soils.
Consequently, the aims of this study are to determine and map the micronutrient content (Cu, Fe, Mn and Zn) of soils in the interior of the State of Ceará; to evaluate soil attributes possibly related to micronutrients; to evaluate, by ordinary kriging, the spatial dependence of the micronutrient content; and to verify the spatial distribution of the micronutrient content.
MATERIAL AND METHODS
The study area is located in the central region of the State of Ceará, in the basin of the River Banabuiú, between 5°21’and 5°53’ S and 39°18’ and 39°51’ W. It has a hot tropical semi-arid climate with low rainfall. The total area is around 149,000 hectares, and includes part of the districts of Pedra Branca, Senador Pompeu, Mombaça
and Piquet Carneiro (Figure 1) (AQUINO et al., 2016).
Land use is distributed as follows: urban area (1%), agriculture - predominantly maize (8%), pasture (26%) and riparian and caatinga vegetation (64%) (GUIMARÃES; VALLADARES; MARTINS, 2016).
Figure 1 - Location of the study area and sampling points of the soils in the central region of Ceará
The study was based on research into morphological characterisation and pedological classification in soil profiles of the study area, presented
by Aquino et al. (2016) and Valladares (2014). The
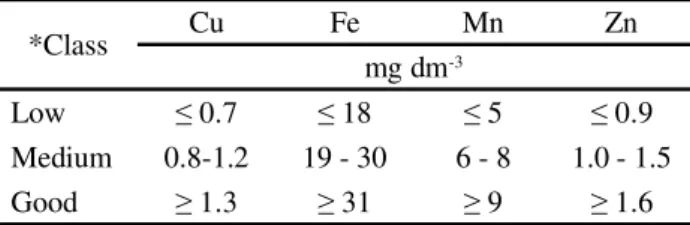
Table 1 - Classes for the interpretation of micronutrient
availability extracted by the Mehlich-1 method
*Adapted fromAlvarezet al. (1999)
(3.1%), Haplic Planosols (2.3%) and other soils, that as major components comprise less than 2% of the study area.
Points of interest were identified using a morphometric image, formed by a false colour composition including terrain altimetry, slope and curvature. Samples were collected for physical and chemical analysis at a total of 49 points (Figure 1) in the surface and subsurface layers, at depths corresponding to the petrogenetic horizons. The
A horizon was considered for the surface samples, and
the B and E horizons (when present) for the subsurface
samples, or theC horizon for the Neosols.
The granulometric and chemical analyses were
carried out for pH (H2O), calcium (Ca+2), magnesium
(Mg +2), potassium (K+), sodium (Na+), sum of bases
(SB), aluminum (Al+3), cation exchange capacity (CEC)
at pH 7.0, percentage base saturation (V%), P, and organic carbon (OC) converted to organic matter (OM), as per Embrapa (2009). The micronutrients were extracted by
a solution of 0.05 mol L-1 HCl + 0.0125 mol L-1 H
2SO4 (Mehlich-1), as per Embrapa (2009), and quantified by atomic absorption spectrophotometry.
Micronutrient availability was evaluated following
the classification proposed by Alvarezet al. (1999) for the
State of Minas Gerais, adapted for three classes and using the same Mehlich-1 extractor (Table 1).
The micronutrient content was submitted to descriptive statistical analysis to determine the values for the minimum, mean, maximum, standard deviation and coefficient of variation. Pearson’s linear correlation analysis (<0.05) between the levels of Cu, Fe, Mn, and Zn and the chemical attributes and granulometry of the soil was applied using the ASSISTAT v 7.7 statistical software, (SILVA; AZEVEDO, 2016).
The semivariograms were adjusted using the GS plus v 7.0 software, (GAMMA DESIGN SOFTWARE, 2004), and interpolated using the ordinary kriging method, which estimates the values under conditions of non-bias
*Class Cu Fe Mn Zn
mg dm-3
Low ≤ 0.7 ≤ 18 ≤ 5 ≤ 0.9
Medium 0.8-1.2 19 - 30 6 - 8 1.0 - 1.5
Good ≥ 1.3 ≥ 31 ≥ 9 ≥ 1.6
and with minimum deviations from the estimated values,
i.e. with minimal variance (VIEIRAet al., 2002).
From the compiled data, a geo-referenced database was constructed containing all the necessary information for the proposed analyses. The spatial distribution maps
were plotted using ordinary kriging (VIEIRAet al., 2002)
with the aid of the ArcGIS Desktop v 10.2 geographic information software (ENVIRONMENTAL SYSTEMS RESEARCH INSTITUTE, 2014).
An analysis to detect discrepant values (Outlier
maximum/minimum) was carried out using Equation 1 to remove these values and prepare the maps, as described by Cahn, Hummel and Broer (1994).
Outlier max/min = X ± 4
σ
(1)where:
X = mean;
σ
= standard deviationThe degree of dependence (DD), which is the percentage proportion of the partial sill (C1) relative to the sill (C0 + C1) (Equation 2), was calculated considering weak dependence as <25%, moderate dependence from 26 to 75% and strong dependence >75%, as per Zimback (2001).
DD = (C1/(C1 + C0))*100 (2)
RESULTS AND DISCUSSION
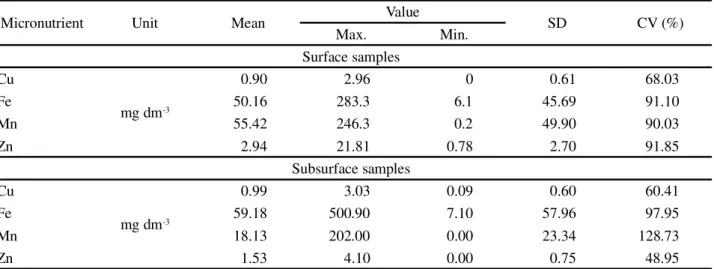
For each determination of the micronutrients under study, the coefficients of variation were high in the surface and subsurface layers (Table 2); this may be related to the diversity of lithology and relief. According to Valladares (2014), the study area is inserted in a domain characterised by great lithological complexity, with records of folding accompanied by metamorphism and the presence of basic rocks alternating with long erosive phases. Consequently, the soils classified in the area are characteristic of soil association, with great variations in their physical and chemical properties.
Micronutrient Unit Mean Value SD CV (%)
Max. Min.
Surface samples Cu
mg dm-3
0.90 2.96 0 0.61 68.03
Fe 50.16 283.3 6.1 45.69 91.10
Mn 55.42 246.3 0.2 49.90 90.03
Zn 2.94 21.81 0.78 2.70 91.85
Subsurface samples Cu
mg dm-3
0.99 3.03 0.09 0.60 60.41
Fe 59.18 500.90 7.10 57.96 97.95
Mn 18.13 202.00 0.00 23.34 128.73
Zn 1.53 4.10 0.00 0.75 48.95
Min. = Minimum; Max. = Maximum; SD = Standard deviation; CV = Coefficient of variation
Table 2 - Mean, maximum and minimum values for micronutrient content, standard deviation and coefficient of variation of soils sampled in the central region of Ceará
Mn and Zn showed the opposite behaviour to that found for Cu and Fe, with the highest values for mean, maximum and minimum content found in the surface layers (Table 2). Mn and Zn also occur in ferromagnesian minerals, as isomorphic substitutes of the Fe and Mg in the mineral structure (STEVENSON; COLE, 1999). However, the high bioavailability of these elements at the mean pH value determined in the soil samples
(pH = 6.0) (NOVAIS et al., 2007) may have favoured
the uptake and cycling of soil micronutrients by the plants, increasing their content in the surface layers
(GIONGO et al., 2011; LIMAet al., 2015; SHARMA
et al., 2013).
Morais, Oliveira and Maia (2014), analysing Zn and Mn in samples of the surface layer of soil under caatinga, found values similar to those presented in this study. In addition, Sobrado (2013) found concentrations in the leaves of native caatinga species that were close to or within the satisfactory level for Zn and Mn respectively, demonstrating the high adaptive capacity of the vegetation in maintaining the balance of micronutrient uptake for soil content, in the case of Zn below the critical level, and in the case of Mn at high levels.
On the other hand, since agriculture in the region uses applications restricted to macronutrients (AQUINO
et al., 2016), in the cultivated areas that were sampled,
impurities in NPK fertilisers and correctives become a secondary source of micronutrient input to the soils and of their concentration in the surface layers (CARVALHO; NASCIMENTO; BIONDI, 2012).
From the percentage distribution of micronutrients (Table 3) according to the classes for agricultural
interpretation adapted from Alvarez et al. (1999), it can
be seen that for Fe, Mn and Zn in the surface layers, the largest percentage of the data (66.67%, 90.33% and 90.33% respectively) was concentrated in the good class of
content (>31, >9 and >1.6 mg kg-1 Fe, Mn and Zn) (Table
1), i.e. suitable for the vast majority of crops. For the same sequence of elements, only 33.33%, 9.69% and 19.36% of the sampled soils had content classified as medium or low
(<30, <8 and <1.5 mg kg-1 Fe, Mn and Zn respectively)
(Table 1). However, Cu displayed the majority (75.27%)
of the levels classified as medium or low (<1.2 mg kg-1 Cu)
(Table 1), with only 24.76% of the content concentrated in
the good class (>1. 3 mg kg-1 Cu) (Table 1).
In the subsurface layers, the percentage distribution of micronutrients was similar to that in the surface layers, with smaller differences between the predominant class and the other classes. Except for Zn, which despite presenting the highest percentage
content determined in the sampled soils in the good
class (45.60%), the sum of the middle and low classes totalled 54.40%. According to Camargo (2006), this can be explained by the low mobility of Zn in the soil profile, even at pH values greater than 5.0.
As agronomic interests mainly consider the surface layers, where the larger part of the plant root system is concentrated, the soils of the central region of Ceará largely present a micronutrient content suitable for the majority of crops. In addition, the fertilisers and correctives marketed in the Northeast, represent an important source of micronutrients, which should not be
ignored in fertilisation programs (BIONDI et al., 2011;
Table 3 - Percentage distribution of micronutrients in the surface and subsurface layers of soils of the central region of the State of
Ceará
*Adapted fromAlvarezet al. (1999)
Class* Cu Fe Mn Zn
---%---Surface layers
Low 47.31 23.65 4.30 1.07
Medium 27.96 9.68 5.38 18.28
Good 24.73 66.67 90.32 80.65
Total 100 100 100 100
Subsurface layers
Low 40.00 13.60 32.80 16.00
Medium 27.20 16.80 7.20 38.40
Good 32.80 69.60 60.00 45.60
Total 100 100 100 100
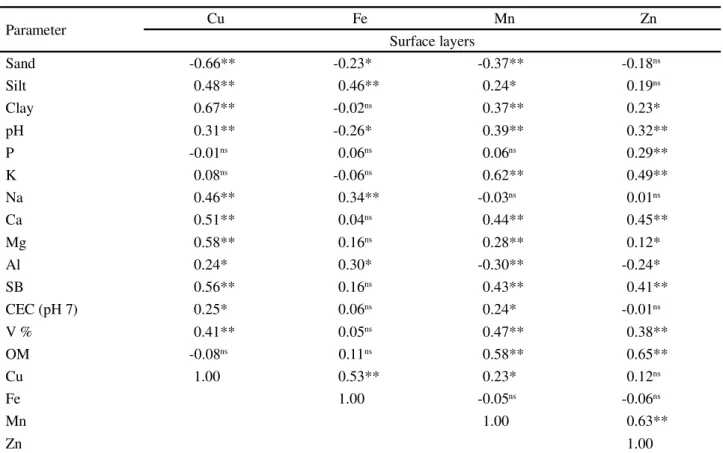
Table 4 - Pearson correlation between the micronutrients and soil attributes in the surface and subsurface layers of the central region of Ceará
Parameter Cu Fe Mn Zn
Surface layers
Sand -0.66** -0.23* -0.37** -0.18ns
Silt 0.48** 0.46** 0.24* 0.19ns
Clay 0.67** -0.02ns 0.37** 0.23*
pH 0.31** -0.26* 0.39** 0.32**
P -0.01ns 0.06ns 0.06ns 0.29**
K 0.08ns -0.06ns 0.62** 0.49**
Na 0.46** 0.34** -0.03ns 0.01ns
Ca 0.51** 0.04ns 0.44** 0.45**
Mg 0.58** 0.16ns 0.28** 0.12*
Al 0.24* 0.30* -0.30** -0.24*
SB 0.56** 0.16ns 0.43** 0.41**
CEC (pH 7) 0.25* 0.06ns 0.24* -0.01ns
V % 0.41** 0.05ns 0.47** 0.38**
OM -0.08ns 0.11ns 0.58** 0.65**
Cu 1.00 0.53** 0.23* 0.12ns
Fe 1.00 -0.05ns -0.06ns
Mn 1.00 0.63**
Zn 1.00
According to the Pearson correlations (Table 4), the micronutrients presented mostly significant positive coefficients with the soil attributes. The correlation analysis between the micronutrients
**, * e ns: significant at 1%, at 5% and not significant respectively
Subsurface layers
Sand -0.44** 0.26** -0.21* -0.02ns
Silt 0.33** 0.18ns 0.45** 0.22*
Clay 0.44** -0.23** 0.05ns -0.04ns
pH 0.47** 0.13ns 0.54** 0.48**
P 0.12ns -0.04ns 0.28** 0.38**
K -0.06ns -0.11ns 0.03ns 0.13ns
Na 0.05ns 0.24** 0.20* 0.10ns
Ca 0.51** 0.35** 0.51** 0.46**
Mg 0.52** 0.36** 0.45** 0.25**
Al -0.17ns -0.05ns -0.36** -0.23*
SB 0.54** 0.43** 0.53** 0.41**
CEC (pH 7) 0.31** 0.19* 0.47** 0.44**
V % 0.49** 0.16ns 0.55** 0.37**
OM 0.21** 0.24** 0.54** 0.43**
Cu 1.00 0.41ns 0.63** 0.51**
Fe 1.00 0.24** 0.49**
Mn 1.00 0.65**
Zn 1.00
Continuation Table 4
For Fe, Mn and Zn (Table 4), the highest correlation coefficients were determined between the micronutrients themselves and between the chemical attributes of the soil at both depths, when compared to the coefficients calculated for the physical attributes of the soil. Under the conditions of the study area, it can be inferred that the micronutrients are to a greater degree related to the chemical components of the soil than to the granulometry of the soil.
Cu presented a negative correlation with sand and a positive correlation with clay (Table 4). Furthermore, the micronutrient showed a non-significant correlation with OM in the surface layers. Clay and OM are the main components involved in Cu retention in the soil (CAMARGO, 2006). However, in the case of the study area, the climate is highly favourable to the decomposition of OM. These factors may have resulted in the non-significant correlation between Cu and OM, the positive correlation between Cu and clay, and the negative correlation with sand, a fraction with a restricted sorption complex for adsorbing the micronutrient, favouring
leaching of the Cu (NOVAISet al., 2007).
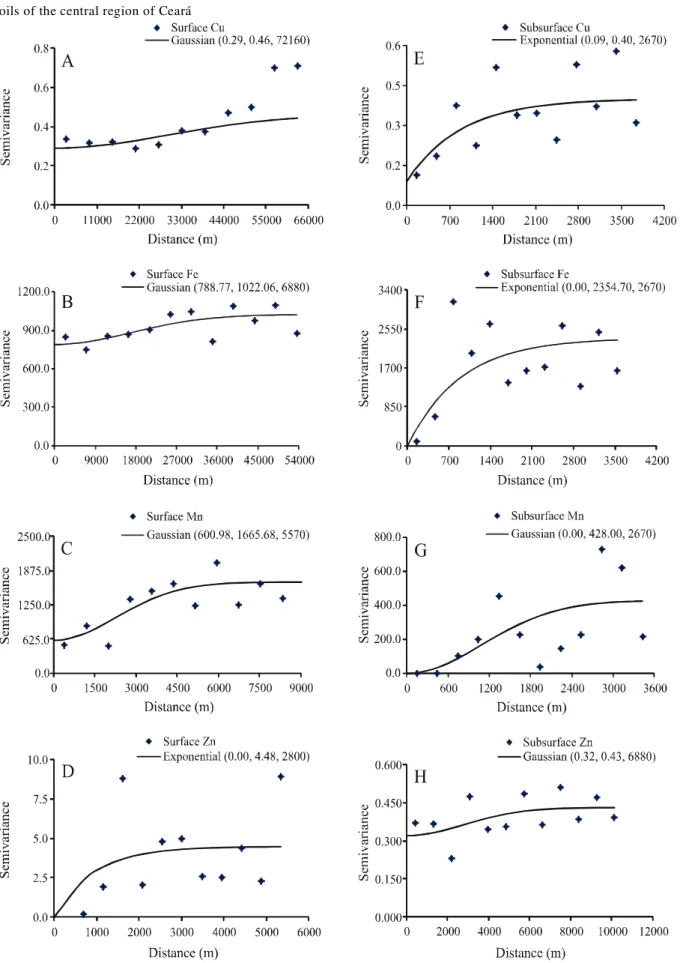
As shown above, the study area is very extensive, partially covering four municipal districts. Despite the
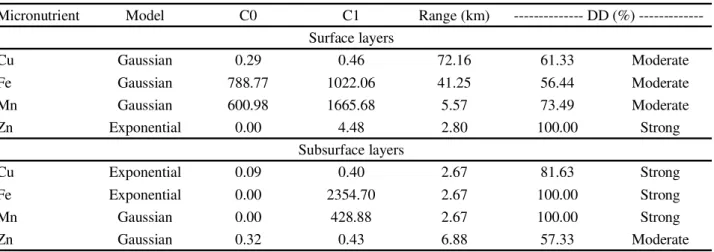
large distances between the collected samples, moderate and strong spatial dependencies were found (ZIMBACK, 2001), with a good fit of the semivariograms to the content of each micronutrient studied in the surface and subsurface layers (Table 5 and Figure 2).
The semivariograms were adjusted by the Gaussian model for Cu, Fe and Mn in the surface layers, and Mn and Zn in the subsurface layers and by the exponential model for Zn in the surface layers, and Cu and Fe in the subsurface layers. The range was higher for the Cu and Fe content in the surface horizons (41.25 and 72.16 km respectively), demonstrating the spatial dependence of these micronutrients even over great distances. However, the range was ten times smaller for Cu and Fe in the subsurface horizons and for Mn and Zn at both depths, showing that spatial dependence is significant, but occurs over smaller distances (Table 5).
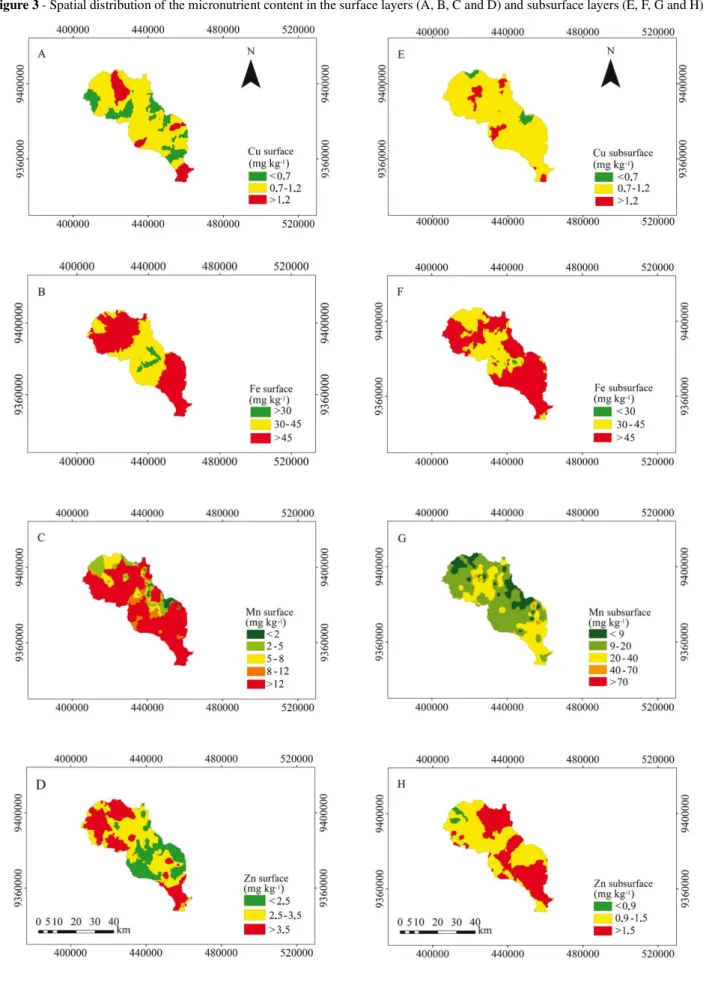
Comparing the maps in Figure 3, which show
Micronutrient Model C0 C1 Range (km) - DD (%) ---Surface layers
Cu Gaussian 0.29 0.46 72.16 61.33 Moderate
Fe Gaussian 788.77 1022.06 41.25 56.44 Moderate
Mn Gaussian 600.98 1665.68 5.57 73.49 Moderate
Zn Exponential 0.00 4.48 2.80 100.00 Strong
Subsurface layers
Cu Exponential 0.09 0.40 2.67 81.63 Strong
Fe Exponential 0.00 2354.70 2.67 100.00 Strong
Mn Gaussian 0.00 428.88 2.67 100.00 Strong
Zn Gaussian 0.32 0.43 6.88 57.33 Moderate
Table 5 - Models of semivariograms adjusted for the attributes in the surface and subsurface layers of soils in the central region of Ceará
C0: nugget effect; C1: sill; GD: degree of spatial dependence
the highest concentrations are found in the subsurface layers (COMPANHIA DE PESQUISA DE RECURSOS MINERAIS, 2014, STEVENSON; COLE, 1999).
The spatial distribution of Mn and Zn at both depths is quite different, indicating the surface enrichment of these elements by such natural processes as nutrient
cycling (GIONGOet al., 2011; LIMAet al., 2015; MELO
et al., 2016; MLAMBO; NYATHI, 2008). The greater
correlation between the Mn and Zn content with the soil OM in the surface horizons (Table 4), and the high levels of these two micronutrients in the surface layers, can be explained by the surface horizons of the soil containing more OM.
CONCLUSIONS
1. The highest values for the mean, maximum and minimum levels of Cu and Fe are found in the subsurface layers, while for Mn and Zn, they are found in the surface layers;
2. The Fe, Mn and Zn content in the surface layers of the majority of soils are suitable for agricultural production, while the Cu content is classified as medium to low; 3. The micronutrients displayed significant positive
correlations, the majority with the soil attributes or with each other;
4. Cu, Fe, Mn and Zn show medium to strong spatial dependence in the surface and subsurface layers; 5. The determined ranges are greater for the Cu and Fe
content in the surface horizons (41.25 and 72.16 km respectively), and around ten times smaller for Cu and Fe in the subsurface horizons and for Mn and Zn at both depths.
ACKNOWLEDGEMENTS
The authors wish to thank Petrobrás for their financial support of this study. The authors would also like to thank Capes for the masters scholarship, and CNPq for the research productivity grant (UFPI).
REFERENCES
ALVAREZ V., V. H. et al. Interpretação dos resultados das análises de solos.In: Comissão de fertilidade do solo do Estado de Minas Gerais.Recomendações para o uso de corretivos e fertilizantes em Minas Gerais: 5ª aproximação. Viçosa, MG, 1999. p. 25-32.
AQUINO, R. P. deet al. Análise da vulnerabilidade natural e do risco de degradação no alto curso do rio Banabuiú-CE.Revista Brasileira de Geografia Física, v. 9, n. 2, p. 601-613, 2016. BIONDI, C. M. et al. Teores de Fe, Mn, Zn, Cu, Ni e Co em solos de referência de Pernambuco.Revista Brasileira de Ciência do Solo, v. 35, n. 3, p. 1057-1066, 2011.
CAHN, M. D.; HUMMEL, J. W.; BROER, B. H. Spatial analysis of soil fertility for site-specific crop management.Soil Science Society of America Journal, v. 58, n. 4, p. 1240-1248, 1994. CAMARGO, O. A. de.Reações e interações de micronutrientes no solo. 2006. Disponível em: <http://www.infobibos.com/
Artigos/2006_3/Micronutrientes/Index.htm>. Acesso em: 21 jun. 2016.
CARVALHO, V. G. B.; NASCIMENTO, C. W. A.; BIONDI, C. M. Potencial de fertilizantes e corretivos no aporte de micronutrientes ao solo.Revista Brasileira de Ciência do Solo, v. 36, n. 3, p. 931-938, 2012.
CHAVES, L. H. G.; FARIAS, C. H. de A. Variabilidade espacial de cobre e manganês em Argissolo sob cultivo de cana-de-açúcar.
COMPANHIA DE PESQUISA DE RECURSOS MINERAIS (BRASIL). Mapa geodiversidade do estado do Ceará. Fortaleza: CPRM - Serviço Geológico do Brasil, 2014. Disponível em: http://www.cprm.gov.br/publique/media/geodiversidade_ceara. pdf. Acesso em: 03 jun. 2016.
EMPRESA BRASILEIRA DE PESQUISA AGROPECUÁRIA.
Manual de análises químicas de solos, plantas e fertilizantes. 2. ed. Brasília: Embrapa Informação Tecnológica, 2009. 627 p. ENVIRONMENTAL SYSTEMS RESEARCH INSTITUTE.
ArcGIS Desktop: release 10.2. Redlands, Califórnia, USA:
ESRI, 2014.
GAMMA DESIGN SOFTWARE. Geoestatistics for the environmental sciences. Version 7.0. Michigan, 2004. 1 CD-ROM. GIONGO, V. et al. Decomposição e liberação de nutrientes de coquetéis vegetais para utilização no semiárido brasileiro.
Revista Ciência Agronômica, v. 42, n. 3, p. 611-618, 2011.
GUIMARÃES, C. C. B.; VALLADARES, G. S.; MARTINS, C. M. Uso da terra e declividade no sertão central do Ceará, Brasil.
Revista Nordestina de Biologia, v. 24, n. 1, p. 3-18, 2016. LADO, L. R.; HENGL, T.; REUTER, H. I. Heavy metals in European soils: a geostatistical analysis of the FOREGS Geochemical database. Geoderma, v. 148, n. 2, p. 189-199, 2008.
LIMA, R. P. et al. Aporte e decomposição da serapilheira na Caatinga no sul do Piauí.Floresta e Ambiente, v. 2, n. 1, p.
42-49, 2015.
MELO, A. A. B.et al.Spatial distribution of organic carbon and humic substances in irrigated soils under different managements systems in a semi-arid zone in Ceará, Brazil.Semina: Ciências Agrárias, v. 37, n. 4, p. 1845-1856, 2016.
MLAMBO, D; NYATHI, P. Litterfall and nutrient return in a semi-arid southern African savanna woodland dominated by Colophospermum mopane.Plant Ecology, v. 196, n. 1, p.
101-110, 2008.
MORAIS, E. R. C.; OLIVEIRA, A. A. S.; MAIA, C. E. Qualidade do solo cultivado com banana irrigada e sua relação com áreas de caatinga. Revista Brasileira de Engenharia Agrícola e Ambiental, v. 18, n. 9, p. 887-891, 2014.
NOVAIS, R. F.et al.Fertilidade do Solo. 1. ed. Viçosa, MG:
Sociedade Brasileira de Ciência do Solo, 2007, 1017 p.
PIERANGELI, M. A. P. et al. Teores de As, Pb, Cd e Hg e fertilidade de solos da região do alto Guaporé, sudoeste do Estado de Mato Grosso.Acta Amazonica, v. 39, n. 1, p. 61-70, 2009.
RYAN, J.et al.Micronutrient constraints to crop production in the middle east-west Asia region: significance, research, and manegement.Advances in Agronomy, v. 122, p. 1-84, 2013.
SHARMA, A. et al. Zinc: an indispensable micronutrient.
Physiology and Molecular Biology of Plants, v. 19, n. 1, p. 11-20, 2013.
SILVA, F. A. S.; AZEVEDO, C. A. V. The Assistat Software Version 7.7 and its use in the analysis of experimental data.African Journal of Agricultural Research, v. 11, n. 39, p. 3733-3740, 2016. SOBRADO, M. A. Soil and leaf micronutrient composition in contrasting habitats in podzolized sands of the Amazon region.
American Journal of Plant Sciences, v. 4, n. 10, p. 1918-1923,
2013.
STEVENSON, F. J.; COLE, M. A. Cycles of soil: carbon,
nitrogen, phosphorus, sulfur, micronutrients. 2. ed. NewYork: Wiley-Interscience, 1999. 448 p.
TEKIN, A. B.et al. Spatial structure of available micronutrient contents and their relationships with other soil characteristics and corn yield.Fresenius Environmental Bulletin, v. 20, n. 3,
p. 783-792, 2011.
VALLADARES, G. S. et al. Variabilidade espacial e disponibilidade de cobre e zinco em solos de vinhedos e adjacências.Bragantia, v. 68, n. 3, p. 733-742, 2009.
VALLADARES, G. S. Levantamento pedológico de reconhecimento de alta intensidade dos solos e aptidão agrícola do sertão central do Ceará. 2014. 134 f. Relatório técnico,
2014.
VIEIRA, S. R. et al. Handbook for geostatistical analysis of variability in soil and meteorological parameters. In: ALVAREZ, V. H.et al. (Ed.).Tópicos em ciência do solo.
Viçosa, MG: Sociedade Brasileira de Ciência do Solo, 2002. v. 2, p. 1-45.
ZIMBACK, C. R. L.Análise espacial de atributos químicos de solos para fins de mapeamento da fertilidade. 2001. 114 f. Tese (Livre Docência) - Faculdade de Ciências Agronômicas, Universidade Estadual Paulista, Botucatu, 2001.