T
o m a t o c r o p p i n g h a s b e e n highlighted, over the years, as one of the most important agricultural activities in Brazil. In 2012, over 69.000 hectares of tomato were cultivated in Brazil. Beyond that, only the seed market reached R$ 124 million (ABCSEM, 2014). In addition, tomato cropping has an amazing importance on social sphere, using, basically, manual managements and in the feeding sphere, presenting great nutritional components (Alvarenga, 2013).The tomato presents a huge fruit
diversity, which makes it to be classified in commercial groups: Cherry, Grape, Santa Cruz, Italian, Round, Saladette and Industrial (Alvarenga, 2013). Among these, cherry tomatoes present small fruits and a sweeter taste in relation to the other groups. These minitomatoes are quite new on the supermarkets, but have one of the greatest potential for expansion, for presenting different flavors and colors and for its practicality (Maciel et al., 2016). Being the cultivation meticulous, the cherry cropping demands a high initial cost
and a skilled labor (Alvarenga, 2013). Nevertheless, the activity is a good option for new investors due to its high added value (Abrahão et al., 2014).
Since the main cherry tomatoes are produced from hybrid seeds (Maciel et al., 2016), breeding strategies consist in exploiting heterosis to detect important agronomic characteristics, as productivity, plagues and disease resistance and precocity. Being the heterotic effect pronounced, there is a need of genetic divergence between parents; the higher the difference
MACIEL, GM; FINZI, RR; CARVALHO, FJ; MARQUEZ, GR; CLEMENTE, AA. 2018. Agronomic performance and genetic dissimilarity among cherry tomato genotypes. Horticultura Brasileira 36: 167-172. http://dx.doi.org/10.1590/S0102-053620180203
Agronomic performance and genetic dissimilarity among cherry tomato
genotypes
Gabriel M Maciel; Rafael R Finzi; Fábio J Carvalho; Guilherme R Marquez; Andressa A Clemente
Universidade Federal de Uberlândia (UFU), Monte Carmelo-MG, Brazil; gabrielmaciel@ufu.br; rafaelfinzi@hotmail.com; fabiojanoni@ ufu.br; grepeza@gmail.com; andressalves50@gmail.com
ABSTRACT
The genotypes evaluation in a germplasm bank is essential to determine their commercial or usefulness, as potential parents, in a breeding program. We aimed to detect the genetic diversity of 42 tomato genotypes of cherry type, belonging to the germplasm bank of the Federal University of Uberlândia and, also evaluate their behavior. The experiment was conducted in a greenhouse in randomized block design with 42 treatments and two replications. Ten quantitative traits of agronomic importance were evaluated. The genetic divergence was obtained by multivariate analysis, using the Mahalanobis distance with different clustering methods (UPGMA and Tocher). The hybrids performance was compared by Scott-Knott (p= 0.05) and Dunnett’s test (p= 0.05). UPGMA and Tocher grouped the genotypes similarly, representing genetic divergence satisfactorily. The genotypes UFU 29, UFU 21 and UFU 07 were more productive, earlier and also divergent from the pre-commercial treatment (UFU 200), being able to be used as potential parents.
Keywords: Solanum lycopersicum, variability, grape tomato.
RESUMO
Desempenho agronômico e dissimilaridade genética entre genótipos de tomate cereja
A avaliação de genótipos em um banco de germoplasma é essencial para determinar seu potencial comercial ou sua utilidade como potenciais genitores em um programa de melhoramento. As-sim, o objetivo do trabalho foi verificar a divergência genética e o comportamento per se de 42 genótipos de tomate cereja pertencentes ao banco de germoplasma de tomateiro da Universidade Federal de Uberlândia. O experimento foi conduzido em casa de vegetação no delineamento experimental de blocos casualizados, com 42 tratamen-tos e duas repetições. Foram avaliados dez caracteres quantitativos de importância agronômica. A divergência genética foi obtida por meio de análises multivariadas utilizando-se a distância generalizada de Mahalanobis, empregando-se diferentes métodos de agrupamento (UPGMA e Tocher). O desempenho dos híbridos foi comparado pelos testes Scott-Knott (p= 0,05) e Dunnett (p= 0,05). Os métodos UPGMA e Tocher agruparam os genótipos de forma semelhante, sendo satisfatórios para representar a divergência genética. Os genó -tipos UFU 29, UFU 21 e UFU 07 foram mais produtivos, precoces e também divergentes à testemunha UFU 200, podendo ser utilizados como possíveis genitores.
Palavras-chave: Solanum lycopersicum, variabilidade, tomate do tipo grape.
between the alleles, greater the heterosis
effect (Borém & Miranda, 2009).
So, the variability between parents can be estimated using measures of genetic dissimilarity, highlighting the generalized distance of Mahalanobis that considers the residual variances and covariances existing between quantitative characters (Cruz et al., 2012).Tocher and UPGMA methods are constantly used to check this divergence on tomato cropping (Gonçalves et al., 2008; Mattedi et al., 2014; Araújo et al., 2016).
Due to the market expansion of cherry tomato seeds and the increasing search for new hybrids, new studies are necessary to develop good parents or genotypes. We aimed to verify the genetic diversity and behavior of cherry tomato genotypes and, using that, select potential parents to foster a future cherry tomato breeding programs.
MATERIAL AND METHODS
The experiment was conducted on the vegetable’s experimental station of Federal University of Uberlândia (UFU), located in Monte Carmelo-MG (18º42’43”S, 47º29’56”W, 873 m altitude). Seedlings were produced in polystyrene trays, with 128 cells, filled with commercial substrate of coconut fiber, on January 20th. Seedlings were
transplanted, 31 days after sowing, into five liter pots, filled with the same substrate used to produce seedlings. Each experimental plot consisted of two pots, arranged in sequence and spaced 0.1 m apart, having three plants per pot, totalizing 252 plants in the greenhouse, equivalent to 1.72 plants m-2. The
greenhouse measures 7x21 m and it’s ceiling 4.0 m. The greenhouse was covered with transparent polyethylene film of 150 micron, additivated against ultraviolet rays and side curtains of white and anti-aphid screen.
Genotypes consisted of 41 cherry tomatoes from germplasm bank of UFU. These materials are characterized by grape fruits of indeterminate growth habit. The pre-commercial genotype UFU 200 was used as check treatment due to its good acceptance by producers,
having indeterminate growth habit and late maturation.
Cultural traits were realized as soon as needed and according to recommendation for tomato cropping on greenhouses (Alvarenga, 2013). Plants were conducted with only one stem, using ribbons in order to upright them. When the plants reached two meters height, the apical meristems of them were cut, stopping their growth and accelerating the ripening of fruits.
D u r i n g t h e e x p e r i m e n t , p e s t and diseases were monitored and, if necessary, chemical control was performed. Plants were irrigated daily, in three or four times, according to plant’s necessity. After transplant, between the first and eighth week, commercial nutrients were provided, by fertirrigation, in the proportion of 1.0; 1.2; 1.0 of NPK. After the ninth week, the system was changed to 1.0; 0.7; 2.0 of NPK. During flowering, a leaf fertilization with calcium and boron was done, once a week, aiming to increase the number and size of flowers. Other essential nutrients were not supplied, due to be already in acceptable concentrations in the used substrate. Mature fruits were harvested weekly, during the period from April 20th to June 08th.
T h e e v a l u a t e d a g r o n o m i c characteristics were: Average fruit weight [(g) ratio between total mass of each plot and number of fruits harvested in each one]; Productivity [(kg plant-1) ratio between harvested
fruit weight and number of plants on each plot]; Number of fruits per plant (fruits plant-1); Stem diameter [(mm)
measured in the region between the third and fourth inflorescence]; Length of internode [(cm), measured on the region between all nodes, starting on the first bifurcation and finishing on the last leaf]; Total soluble solids [(0Brix)
average value of five fruits that were harvested in each plant, on the 110th day
after sowing, with the aid of a digital refractometer (Atago PAL-1 3810)]; Total leaf chlorophyll during flowering and fruiting [(ICC), Falkerdo index of total chlorophyll, sum of chlorophyll a with chlorophyll b, measured on a leaf surface, at 59 and 90 days after sowing,
respectively, 0.02 m away from the edge and 0.05 m away from the center, with the aid of a digital chlorophyllometer (Clorofilog, CFL 1030 Falker)]; Fruit diameter [(mm) ratio between five fruits harvested in each plot, on 110 DAS]; Precocity index [(%) ratio between sum of mass of all harvested fruits, from the first two harvests, multiplied by 100].
The experimental design was of randomized complete block design, with 42 treatments and two replications. Data were submitted to analyze of variance, by the F test (p= 0.05). Averages were compared in two different ways: using Scott-Knott test (p= 0.05) and Dunnett test (p= 0.05), in order to compare the performance of genotypes with each other and, individually with the check treatment, respectively. After that, multivariate analyzes were done, aiming to determinate the genetic dissimilarity between the genotypes, getting with this, a dissimilarity matrix produced by the generalized distance of Mahalanobis
.
Genetic diversity was represented by a dendrogram obtained by hierarquic method of Unweighted Pair-Group Method Using Arithmetic Averages (UPGMA) and by Tocher method. Grouping validation by UPGMA method was obtained by the coefenetic coefficient of correlation (CCC), calculated by the Mantel test (1967). The relative contribution of the quantitative characters was calculated according to Singh criterion (1981). All data were analysed using software GENES v. 2015.5.0 (Cruz, 2013).
RESULTS AND DISCUSSION
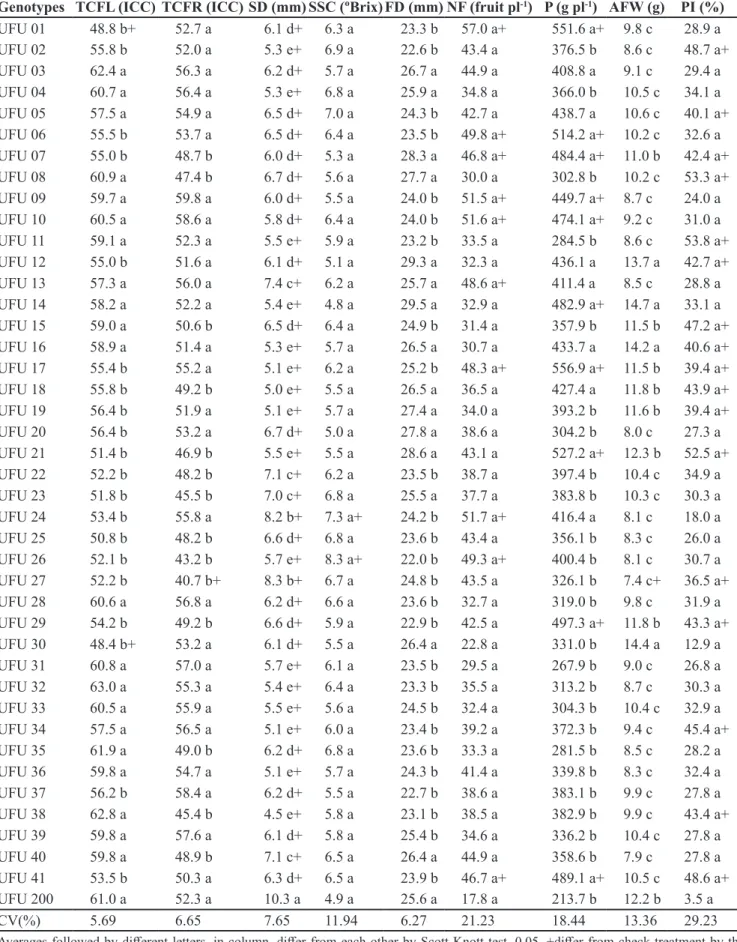
Table 1. Averages of total chlorophyll content, during flowering (TCFL) and fruiting (TCFR), stem diameter (SD), soluble solids content
(SSC), fruit diameter (FD), number of fruits (NF), productivity (P), average fruit weight (AFW) and precocity index (PI), in 42 cherry tomato genotypes. Monte Carmelo, UFU, 2016.
Genotypes TCFL (ICC) TCFR (ICC) SD (mm) SSC (ºBrix) FD (mm) NF (fruit pl-1) P (g pl-1) AFW (g) PI (%)
UFU 01 48.8 b+ 52.7 a 6.1 d+ 6.3 a 23.3 b 57.0 a+ 551.6 a+ 9.8 c 28.9 a
UFU 02 55.8 b 52.0 a 5.3 e+ 6.9 a 22.6 b 43.4 a 376.5 b 8.6 c 48.7 a+
UFU 03 62.4 a 56.3 a 6.2 d+ 5.7 a 26.7 a 44.9 a 408.8 a 9.1 c 29.4 a
UFU 04 60.7 a 56.4 a 5.3 e+ 6.8 a 25.9 a 34.8 a 366.0 b 10.5 c 34.1 a
UFU 05 57.5 a 54.9 a 6.5 d+ 7.0 a 24.3 b 42.7 a 438.7 a 10.6 c 40.1 a+
UFU 06 55.5 b 53.7 a 6.5 d+ 6.4 a 23.5 b 49.8 a+ 514.2 a+ 10.2 c 32.6 a
UFU 07 55.0 b 48.7 b 6.0 d+ 5.3 a 28.3 a 46.8 a+ 484.4 a+ 11.0 b 42.4 a+
UFU 08 60.9 a 47.4 b 6.7 d+ 5.6 a 27.7 a 30.0 a 302.8 b 10.2 c 53.3 a+
UFU 09 59.7 a 59.8 a 6.0 d+ 5.5 a 24.0 b 51.5 a+ 449.7 a+ 8.7 c 24.0 a
UFU 10 60.5 a 58.6 a 5.8 d+ 6.4 a 24.0 b 51.6 a+ 474.1 a+ 9.2 c 31.0 a
UFU 11 59.1 a 52.3 a 5.5 e+ 5.9 a 23.2 b 33.5 a 284.5 b 8.6 c 53.8 a+
UFU 12 55.0 b 51.6 a 6.1 d+ 5.1 a 29.3 a 32.3 a 436.1 a 13.7 a 42.7 a+
UFU 13 57.3 a 56.0 a 7.4 c+ 6.2 a 25.7 a 48.6 a+ 411.4 a 8.5 c 28.8 a
UFU 14 58.2 a 52.2 a 5.4 e+ 4.8 a 29.5 a 32.9 a 482.9 a+ 14.7 a 33.1 a
UFU 15 59.0 a 50.6 b 6.5 d+ 6.4 a 24.9 b 31.4 a 357.9 b 11.5 b 47.2 a+
UFU 16 58.9 a 51.4 a 5.3 e+ 5.7 a 26.5 a 30.7 a 433.7 a 14.2 a 40.6 a+
UFU 17 55.4 b 55.2 a 5.1 e+ 6.2 a 25.2 b 48.3 a+ 556.9 a+ 11.5 b 39.4 a+
UFU 18 55.8 b 49.2 b 5.0 e+ 5.5 a 26.5 a 36.5 a 427.4 a 11.8 b 43.9 a+
UFU 19 56.4 b 51.9 a 5.1 e+ 5.7 a 27.4 a 34.0 a 393.2 b 11.6 b 39.4 a+
UFU 20 56.4 b 53.2 a 6.7 d+ 5.0 a 27.8 a 38.6 a 304.2 b 8.0 c 27.3 a
UFU 21 51.4 b 46.9 b 5.5 e+ 5.5 a 28.6 a 43.1 a 527.2 a+ 12.3 b 52.5 a+
UFU 22 52.2 b 48.2 b 7.1 c+ 6.2 a 23.5 b 38.7 a 397.4 b 10.4 c 34.9 a
UFU 23 51.8 b 45.5 b 7.0 c+ 6.8 a 25.5 a 37.7 a 383.8 b 10.3 c 30.3 a
UFU 24 53.4 b 55.8 a 8.2 b+ 7.3 a+ 24.2 b 51.7 a+ 416.4 a 8.1 c 18.0 a
UFU 25 50.8 b 48.2 b 6.6 d+ 6.8 a 23.6 b 43.4 a 356.1 b 8.3 c 26.0 a
UFU 26 52.1 b 43.2 b 5.7 e+ 8.3 a+ 22.0 b 49.3 a+ 400.4 b 8.1 c 30.7 a
UFU 27 52.2 b 40.7 b+ 8.3 b+ 6.7 a 24.8 b 43.5 a 326.1 b 7.4 c+ 36.5 a+
UFU 28 60.6 a 56.8 a 6.2 d+ 6.6 a 23.6 b 32.7 a 319.0 b 9.8 c 31.9 a
UFU 29 54.2 b 49.2 b 6.6 d+ 5.9 a 22.9 b 42.5 a 497.3 a+ 11.8 b 43.3 a+
UFU 30 48.4 b+ 53.2 a 6.1 d+ 5.5 a 26.4 a 22.8 a 331.0 b 14.4 a 12.9 a
UFU 31 60.8 a 57.0 a 5.7 e+ 6.1 a 23.5 b 29.5 a 267.9 b 9.0 c 26.8 a
UFU 32 63.0 a 55.3 a 5.4 e+ 6.4 a 23.3 b 35.5 a 313.2 b 8.7 c 30.3 a
UFU 33 60.5 a 55.9 a 5.5 e+ 5.6 a 24.5 b 32.4 a 304.3 b 10.4 c 32.9 a
UFU 34 57.5 a 56.5 a 5.1 e+ 6.0 a 23.4 b 39.2 a 372.3 b 9.4 c 45.4 a+
UFU 35 61.9 a 49.0 b 6.2 d+ 6.8 a 23.6 b 33.3 a 281.5 b 8.5 c 28.2 a
UFU 36 59.8 a 54.7 a 5.1 e+ 5.7 a 24.3 b 41.4 a 339.8 b 8.3 c 32.4 a
UFU 37 56.2 b 58.4 a 6.2 d+ 5.5 a 22.7 b 38.6 a 383.1 b 9.9 c 27.8 a
UFU 38 62.8 a 45.4 b 4.5 e+ 5.8 a 23.1 b 38.5 a 382.9 b 9.9 c 43.4 a+
UFU 39 59.8 a 57.6 a 6.1 d+ 5.8 a 25.4 b 34.6 a 336.2 b 10.4 c 27.8 a
UFU 40 59.8 a 48.9 b 7.1 c+ 6.5 a 26.4 a 44.9 a 358.6 b 7.9 c 27.8 a
UFU 41 53.5 b 50.3 a 6.3 d+ 6.5 a 23.9 b 46.7 a+ 489.1 a+ 10.5 c 48.6 a+
UFU 200 61.0 a 52.3 a 10.3 a 4.9 a 25.6 a 17.8 a 213.7 b 12.2 b 3.5 a
CV(%) 5.69 6.65 7.65 11.94 6.27 21.23 18.44 13.36 29.23
difference was detected trough F test (p= 0.05).
Overall, total leaf chlorophyll during the flowering and fruiting, varied from 48.4 to 62.8 ICC and from 40.7 to 59.8 ICC, respectively; the stem diameter varied from 5.1 to 10.3 mm; fruit diameter from 22.6 to 29.3 mm; average fruit weight from 7.4 to 14.7 g and productivity from 213.7 to 556.9 g plant-1, an indicative of high diversity
among genotypes.
Among the 41 evaluated genotypes, ten (UFU 09, UFU 10, UFU 14, UFU 29, UFU 21, UFU 07, UFU 06, UFU 01, UFU 17 and UFU 41) presented two times productivity of the check cultivar (Dunnett test). These cultivars presented a variation of productivity from 449.7 to 556.9 g plant-1, similar
to the results found by Menezes et al. (2010), evaluating cherry tomatoes in the field. Among the 10 genotypes that highlighted for productivity, five (UFU 21, UFU 29, UFU 17, UFU 41 and UFU 07) were also the earliest, all presenting more than 39% of total yield (g plant-1) in the first and second
harvests, different from check treatment, which got only 3.5% of the total yield during the first two harvests. Precocity and high level of productivity are two of the main desired characteristics in a cherry tomato genotype.
Total soluble solids is an important feature of cherry tomato. The higher the soluble solids, the sweeter the fruit flavor, being the genotypes with high
0Brix the most chosen by the consumers
(Schwarzer et al., 2013; Maciel et al., 2015). On this sense, only genotypes
UFU 26 and UFU 24 highlighted, presenting 41 and 33% more 0Brix,
respectively, than check treatment (Dunnett, 5% probability) (Table 1). The other genotypes did not differ for this characteristic. The genetic potential can affect soluble solids content of fresh tomato (Garcia & Barret, 2006), industrial tomato (Schwarz et al., 2013) and also of cherry tomatoes (Maciel et al., 2015), which demonstrates that the two genotypes that highlighted for soluble solids have an excellent potential.
It is possible to affirm that the chlorophyll content on the leaves predicts, on an indirect form, the nutritional level of nitrogen in plants, since 70% of N are in chloroplasts, participating in the synthesis and structure of chlorophyll molecules (Wood et al., 1993). The genotypes UFU 16, UFU 13, UFU 14, UFU 10, UFU 09, UFU 05 and UFU 03 highlighted, showing high chlorophyll content on the leaves, during the flowering and fruiting, allied with high productivity (between 408.8 and 482.9 g plant-1). The
genotypes UFU 39, UFU 36, UFU 34, UFU 33, UFU 31, UFU 32, UFU 28, UFU 11 and UFU 04, also showed high chlorophyll content, but on the other hand, they presented low productivity (between 284.5 and 372.3 g plant-1)
(Scott-Knott test, 5% probability). Even so, the results corroborate with Ferreira et al. (2006), that also proved a relation between chlorophyll content and tomato productivity.
In addition to comparing individual performing, the separation of genotypes
into different groups, using dissimilarity measures, helps the breeders to select good progenitors (Araujo et al., 2016). The genetic dissimilarity measures by the generalized distance of Mahalanobis , of the 42 cherry tomato genotypes, vary between 2.08 (UFU 18 and UFU 19) and 242.4 (UFU 38 and UFU 200), an indicative of high genetic diversity.
T h e f o r m a t i o n o f g r o u p s , represented by a dendrogram, using the UPGMA method (Figure 1), showed a correlation coefficient of 0.85, significative for a t test (p<0.01). So, it is possible to affirm that the dendogram reproduced, in a satisfactory way, the information contained in the matrix and, consequently, in the formation of groups. Grouping separation was done by delimitation of a cut line of 50%, established in the place of an abrupt change on the dendogram ramification (Cruz et al., 2012). With this cut, the genotypes formed four distinct groups, being group I composed of 93% of the cherry tomato genotypes, group II formed of the genotype UFU 30, III of the genotype UFU 27 and the fourth group was formed by the check treatment (UFU 200).
Analyzing the group formation by the method of Tocher, it was possible to see that it also separates genotypes into four different groups (Table 2). According to Gonçalves et al. (2008) and Araujo et al. (2016), UPGMA method is efficient on the formation of groups as well as Tocher method (Mattedi et al., 2014).
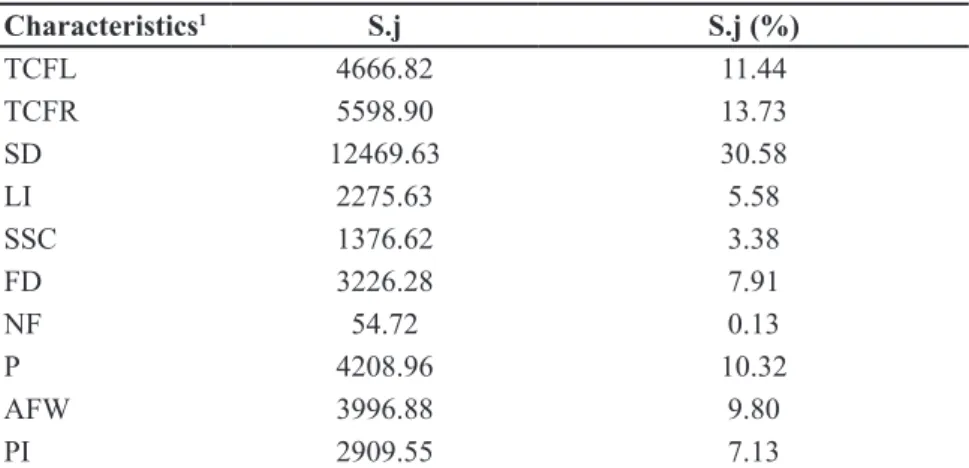
Genotypes UFU 30, UFU 27 and UFU 200 can be used as progenitors, due to their divergence in relation to the others. Genotypes UFU 27 and UFU 200 highlighted for stem diameter, showed the highest values (8.3 and 10.3 mm, respectively), a fact that may justify their separation into different groups. On the other hand, UFU 30 presented the highest average fruit weight (14.4 g). This hypothesis is confirmed by the relative contribution of characters (Table 3). Stem diameter was responsible for the highest relative contribution of the genotypes divergence, with 31% of the total variability. Chlorophyll content on leaves was also relevant and sum to the values of average fruit
Table 2. Grouping representation obtained by the optimization of Tocher, based on Mahalanobis distance, estimated from ten characteristics, evaluated on all 42 tomato genotypes. Monte Carmelo, UFU, 2016.
Groups Genotypes
I
UFU 18, UFU 19, UFU 17, UFU 16, UFU 05, UFU 39, UFU 06, UFU 10, UFU 36, UFU 09, UFU 03, UFU 04, UFU 28, UFU 32, UFU 34, UFU 37, UFU 31, UFU 11, UFU 02, UFU 41, UFU 33, UFU 15, UFU
35, UFU 38, UFU 12, UFU 20, UFU 01, UFU 29, UFU 13, UFU 07, UFU 08, UFU 40, UFU 21, UFU 14, UFU 22, UFU 25, UFU 23, UFU
26, UFU 24
II UFU 30
III UFU 27
weight, productivity and stem diameter influenced 76% of the genetic diversity. On the other hand, number of fruits contributed with only 0.1%, being, therefore, the variable selected for discarding, according to Singh (1981). In other tomato groups, the number of fruits is one of the most important characters in the contribution of genetic diversity (Araújo et al., 2016). These informations help the breeder to choose which evaluation is important to be done in a breeding program, reducing time and efforts.
In order to select good progenitors, breeders explore commercial and
pre-commercial cultivars, with agronomic characters of interest. The divergence of the check treatment (UFU 200), in relation to others, represents a possibility and viability of it to be used in a breeding program of cherry tomato. Therefore, when crossing genotypes that have a good agronomic behavior, as UFU 21, UFU 29 and UFU 07 with UFU 200, it would be possible to obtain hybrids with better characteristics, like soluble solids content, productivity and precocity and, consequently, with high commercial potential.
I n g e n e r a l , t h e m e t h o d s o f multivariate analyzes (UPGMA and
Tocher), that were used to estimated the genetic dissimilarity, were similar and satisfactory, being important tools to find good progenitors. The univariate analyzes, by the Scott-Knott test, did not allow an explicit visualization of divergent groups, which makes the association of uni and multivariate techniques an important strategy in order to determine genetic variability between cherry tomato genotypes (Araújo et al., 2016).
It is possible to affirm that genotypes UFU 41, UFU 29, UFU 21, UFU 17 and UFU 07 are more productive, early and also genetically divergent from the commercial access, making them possible genitors.
REFERENCES
ABRAHÃO, C; VILLAS BÔAS, RL; BULL, LT. 2014. Relação K:Ca:Mg na solução nutritiva para a produção de minitomate cultivado em substrato. Irriga 19: 214-224.
ALVARENGA, MAR. 2013.Tomate, Produção em campo, casa de vegetação e hidroponia. Lavras:UFLA. 455p.
ARAUJO, JC; TELHADO, SFP; SAKAI, RH; LEDO, CAS; MELO, PCT. 2016. Univariate
and multivariate procedures for agronomic evaluation of organically grown tomato cultivars. Horticultura Brasileira 34: 374-380. ASSOCIAÇÃO BRASILEIRA DE COMÉRCIO DE SEMENTES E MUDAS – ABCSEM. 2014. Dados do setor de pesquisa de mercado de sementes de hortaliças. Available at <http:// www.abcsem.com.br/dadosdosegmento.php> Accessed September 22, 2016.
BORÉM, A; MIRANDA, GV. 2009. Melhoramento de plantas. Viçosa: UFV. 449p.
CRUZ, CD. 2013. GENES: A software package for analysis in experimental statistics and quantitative genetics. Acta Scientiarum 35: 271-276.
CRUZ, CD; REGAZZI, AJ; CARNEIRO, PCS.
2012. Modelos biométricos aplicados ao melhoramento genético. Viçosa: UFV. 514p. FERREIRA, MMM; FERREIRA, GB; FONTES,
PCR; DANTAS, JP. 2006. Índice spad e teor de clorofila no limbo foliar do tomateiro em função de doses de nitrogênio e da adubação
orgânica, em duas épocas de cultivo. Revista Ceres 53: 83-92.
GARCIA, E; BARRETT, DM. 2006. Assessing lycopene content in California processing tomatoes. Journal of Food Processing and Preservation 30: 56-70.
GONÇALVES, LSA; RODRIGUES, R; SUDRÉ,
CP; BENTO, CS; MOULIN, MM; ARAÚJO, ML; DAHER, RF; PEREIRA, TNS; PEREIRA, MG. 2008. Divergência genética
Table 3. Relative contribution of ten agronomic characters, on the genetic diversity of 42 cherry tomato genotypes, according to Singh (1981). Monte Carmelo, UFU, 2016.
Characteristics1 S.j S.j (%)
TCFL 4666.82 11.44
TCFR 5598.90 13.73
SD 12469.63 30.58
LI 2275.63 5.58
SSC 1376.62 3.38
FD 3226.28 7.91
NF 54.72 0.13
P 4208.96 10.32
AFW 3996.88 9.80
PI 2909.55 7.13
¹TCFL and TCFR= Total chlorophyll during flowering and fruiting, respectively; SD= stem diameter; LI= lenght of internodes; SSC= soluble solids contente; FD= fruit diameter; NF= number of fruits; P= productivity; AFW= average fruit weight and PI= precocity index.
em tomate estimada por marcadores RAPD em
comparação com descritores multicategóricos. Horticultura Brasileira 26: 364-370.
M A C I E L , G M ; F E R N A N D E S , M A R ; HILLEBRAND, V; AZEVEDO, BNR. 2015.
Influência da época de colheita no teor de
sólidos solúveis em frutos de minitomate. Scientia Plena 11: 1-6.
MACIEL, GM; FERNANDES, MAR; MELO,
OD; OLIVEIRA, CS. 2016. Potencial agronômico de híbridos de minitomate
com hábito de crescimento determinado e indeterminado. Horticultura Brasileira 34: 144-148.
MANTEL, N. 1967. The detection of disease clustering and a generalized regression approach. Cancer Research 27: 209-220.
MATTEDI, AP; GUIMARÃES, MA; NICK, C; SILVA, DJH; PUIATTI, M; CARNEIRO, PCS. 2014. Genetic divergence of tomato
subsamples. Revista Ceres 61: 70-76.
MENEZES, JBC; COSTA, CA; SAMPAIO,
RA; CATÃO, HCM; GUILHERME, DO; MARTINEZ, RAS. 2012. Fruit production and
classification of four cherry tomato genotypes
under an organic cropping system. IDESIA 30: 29-35.
SCHWARZ, K; RESENDE, JTV; PRECZENHAK,
AP; PAULA, JT; FARIA, MV; DIAS, DM.
2013. Desempenho agronômico e qualidade
físico-química de híbridos de tomateiro em
cultivo rasteiro. Horticultura Brasileira 31: 410-418.
SINGH, D. 1981. The relative importance of
characters affecting genetic divergence. The Indian Journal of Genetic and Plant Breeding 41: 237-245.