__________________________________
1 Doutorando em Engenharia Agrícola, Departamento de Engenharia Agrícola, Universidade Federal de Viçosa, Viçosa - MG, Fone:
(0XX31) 3899-1926, [email protected].
2 Profa. Associada, Departamento de Engenharia Agrícola, Universidade Federal de Viçosa, Viçosa-MG, [email protected].
3 Prof. Adjunto, Centro de Ciências Biológicas e da Natureza, Universidade Federal do Acre, Rio Branco - AC, [email protected]. 4 Prof. Associado, Departamento de Estatística, Universidade Federal de Viçosa, Viçosa - MG, [email protected].
5 Bolsista de Iniciação Científica do CNPq, Departamento de Engenharia Agrícola, Universidade Federal de Viçosa, Viçosa - MG,
Recebido pelo Conselho Editorial em: 24-11-2010 Aprovado pelo Conselho Editorial em: 22-8-2011
ROMENIQUE DA S. FREITAS1, LÊDA R. DA. FARONI2, ADALBERTO H. SOUSA3,
PAULO R. CECON4, MARCELA S. CARVALHO5
ABSTRACT: This study aimed to evaluate the quality of beans (Phaseolus vulgaris L.) stored with different moisture contents under hermetic conditions. Beans with 12.3%, 15.7%, and 17.8% moisture content were used in the experiment. They were packed in bag type silos (3 kg), PET bottles (1.5 L), and glass containers (3 L), covered with organza fabric(control), and stored at 25 °C and 70±5% relative humidity, for 120 days. The evaluated characteristics included moisture content, apparent density, electrical conductivity, germination percentage, cooking time, and bean classification, every 30 days. Except for the electrical conductivity and cooking time, the other characteristics were kept for 120 days in the stored product with moisture contents of 12.3% and 15.7% in hermetic conditions. Beans with 17.8% of the moisture content, electrical conductivity and cooking time increased, and apparent density and germination were reduced. Beans stored in the control, with any of the moisture contents, showed high quality loss during the long storage. It was concluded that it is possible to storage beans with moisture contents of 12.3% and 15.7%, with quality, for until 120 days, in hermetic conditions.
KEYWORDS: Phaseolus vulgaris L., modified atmosphere, bag silo, PET bottles.
QUALIDADE DE FEIJÃO ARMAZENADO EM CONDIÇÕES HERMÉTICAS
RESUMO: Este trabalho teve por objetivo avaliar a qualidade de feijão (Phaseolus vulgaris L.), armazenado com diferentes teores de água, sob condições herméticas. Feijão com teores de água de 12,3%, 15,7% e 17,8% foram acondicionados em silos tipo bolsa (3 kg), garrafas pet (1,5 L) e recipientes de vidro (3 L), cobertos com organza (controle) e armazenados à temperatura de 25 °C e umidade relativa de 70±5%, por 120 dias. Avaliaram-se o teor de água, a massa específica aparente, a condutividade elétrica, a porcentagem de germinação, o tempo de cocção e a classificação do feijão, a cada 30 dias. À exceção da condutividade elétrica e do tempo de cocção, as demais características foram mantidas por 120 dias no material armazenado com teores de água de 12,3% e 15,7%, em condições herméticas. No produto armazenado com 17,8%, ocorreu aumento no teor de água, condutividade elétrica e tempo de cocção, e redução na massa específica aparente e na germinação. No controle, independentemente do teor de água, o material apresentou acentuada perda de qualidade ao longo do armazenamento. Concluiu-se que é possível armazenar feijão com teores de água de 12,3% e 15,7%, com qualidade, por até 120 dias, em condições herméticas.
INTRODUCTION
Beans are a widespread leguminous plant throughout the world, and occupy a cultivation area of approximately 12.5 million hectares (FAO, 2006). Brazil is the largest producer and consumer of beans, with an estimated production of 3.4 million tons for the 2010/2011 season (CONAB, 2010). This legume is no longer a subsistence farming culture, and is becoming a highly technical culture, with the adoption of new farming techniques. However, the storage is usually done improperly (FARONI et al., 2006).
The storage in hermetic environment is one of the most important alternatives to conventional storage of agricultural products. In this storage system, the material quality is ensured by modifying the atmosphere, by the conversion of oxygen to carbon dioxide resulted from respiration of the components of the storage ecosystem: the product, insects and microorganisms (FARONI et al., 2009). The system restricts gas exchanges between the ambient atmosphere and intergranular. With this, avoids a variation in moisture content, prevents pest infestation, and reduces the metabolic activity of the grains (RUPOLLO et al., 2006).
In areas where technified farming is practiced, hermetic storage has been used as a means of preserving the quality of products. Countries such as Australia, Brazil and Argentina have adopted the system of hermetic storage in bag type silo. The technique consists of waterproof storage bags, hermetically sealed, and made of polyethylene. The bags have one white outside wall, which reflects 20% of the sunlight, and one black inner wall, which keeps the material in the dark, thus slowing the darkening of the integument. They also avoid the occurrence of changes in moisture content of the product, by avoiding the contact between them and the external air humidity (DARBY & CADDICK, 2007).
The storage of grains in recycled or reused containers which allows the seal has been used by small producers, as a safe storage. In Brazil, the agricultural products of these farmers are typically stored during the off season in PET bottles. In addition to ensuring the tightness, the bottles have the advantage of allowing the farmer to store the product in separate units, preventing one contaminated unit of jeopardizing the rest of the product (QUEZADA et al., 2006).
Although the known advantages of hermetic storage of agricultural products, little is known about the ideal moisture content for safe storage of beans under hermetic conditions. The bean is usually stored with moisture content higher than recommended for safe storage, and this factor is one of the major causes of material quality loss. The high moisture content favors the higher temperature of the mass and the attack of insects and fungi (FARONI & SILVA, 2008).
Given the above, this study aimed to evaluate the quality of beans (Phaseolus vulgaris L.), stored with different moisture contents under hermetic conditions.
MATERIAL AND METHODS
The experiment was conducted by the Division of Pre-Processing and Storage of Agricultural Products, Department of Agricultural Engineering, Federal University of Viçosa (UFV). It was used bean (Phaseolus vulgaris L.) of the red group, cultivar 'vermelhinho', with moisture content of 12.3%, 15.7% and 17.8%.
Moisture content: to determine the moisture content of the beans, it was used the oven method at a temperature of 103 ± 1 °C, for 72 hours, with three replicates, as recommended by the ASAE (2004).
Apparent density: the determination of apparent density was made with the aid of a hectoliter scale, with a capacity of a quart of liter (BRASIL, 2009). Electrical conductivity: the electrical conductivity of the solution containing beans was measured using the "System of Glass" or "Conductivity Mass" (VIEIRA et al., 2001). Germination percentage: the standard germination test was done in accordance with the Rules for Seed Analysis (BRASIL, 2009).
Cooking time: the cooking time of beans was determined using the Mattson cooker apparatus. The determination of cooking time was based on the methodology adopted by RESENDE et al. (2008). The beans samples were previously soaked in distilled water for 16 hours at a temperature of 25 °C. After this period, it was selected the whole grains and with the shell attached to the cotyledons, which were placed in the cradle board with a pin on each of them. The device was placed in a metal container with distilled water in a boiling state, kept at constant volume. The bean was considered cooked when the rod went through, and the cooking time of the sample recorded when the 13th rod penetrated the material.
Bean classification: bean classification was performed by a specialized technician of the Agricultural Institute of Minas Gerais (IMA), according to Instruction N. 12, of March 28th of 2008, of the Ministry of Agriculture (BRASIL, 2008).
Experimental Design
It was used a completely randomized split-plot design with three repetitions. The plots were represented by the conditions of storage (bag type silo, PET bottles and control) and the subplots of five storage periods (0; 30; 60; 90 and 120 days) for each moisture content.
The data of moisture content, apparent density, electrical conductivity, germination percentage and cooking time were subjected to analysis of variance by SAEG software, version 9.0 (SAEG, 2005). For significant interactions, we performed the unfolding of the data. From the values obtained, analysis of time-dependent regression was made, by SigmaPlot software, version 10.0 (SPSS, 2006). To the classification data, descriptive statistics were used.
RESULTS AND DISCUSSION Moisture content
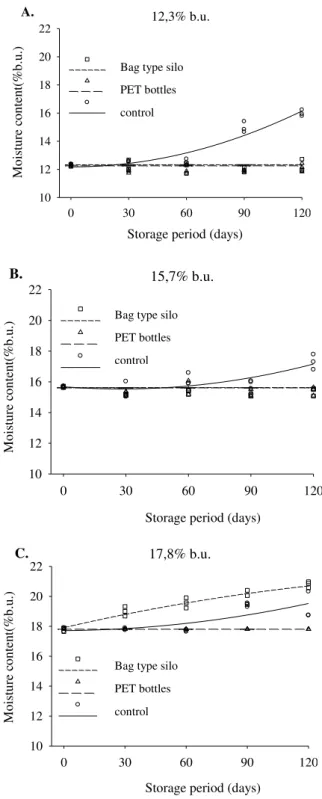
The results of the beans moisture content during storage are presented in Figure 1 and Table 1. Regression models were adjusted only for the characteristics that varied significantly with storage time. The characteristics that showed no significant variation are represented by their average values. The moisture content of the material stored in bag type silos and PET bottles kept constant throughout the storage period, when they were stored with 12.3% and 15.7%, but increased in the control. In beans stored with 17.8%, only the moisture content of the material in PET bottles did not change during storage.
The moisture content of the beans varied significantly among storage systems when stored with 12.3%, 15.7% and 17.8% (F2,6=194,42; P<0,0001; F2,6=22,64; P=0,002 and F2,6=14,30; P<0,0001). It was observed throughout the storage that levels of moisture contents of the stored product in the control tended to be higher than the levels of water from those stored under hermetic conditions (Figures 1A, 1B), except for beans stored with 17.8%. In these, the moisture content of the material stored in the control and in the bag type silos tended to be larger than those in PET bottles (Figure 1C).
intense attack of the bruchidae Acanthoscelides obtectus (Say) (Coleoptera: Bruchidae) and fungi in beans stored in the control, for the different moisture contents. They also observed the presence of fungi in the stored densities with 17.8% in bag type silos, in the last three periods of evaluation, which is to justify the results.
The increase in moisture content of the material in the control can still be justified by its respiratory activity, which although is less intense than that of microorganisms and insects, intensifies as they have higher moisture contents. The water produced during the beans respiratory process increase the moisture content of the product which, therefore, favors the fast development of microorganisms (OLIVEIRA et al. 2007; RESENDE et al., 2008, ALENCAR et al., 2009).
12,3% b.u.
Período de armazenamento (dias)
0 30 60 90 120
Teo r d e ág ua ( % b .u .) 10 12 14 16 18 20 22 Silo bolsa Garrafa pet Controle A. 15,7% b.u.
Período de armazenamento (dias)
0 30 60 90 120
Teor d
e águ
a (% b
.u .) 10 12 14 16 18 20 22 Silo bolsa Garrafa pet Controle B. 17,8% b.u.
Período de armazenamento (dias)
0 30 60 90 120
10 12 14 16 18 20 22 Silo bolsa Garrafa pet Controle C. Teo r d e ág ua (% b .u .)
FIGURE 1. Final moisture content of beans stored with initial moisture content of 12.3% (A), 15.7% (B) and 17.8% (C), in bag type silo, PET bottles and control.
M oistu re c on ten t(% b. u. ) M oistu re c on ten t(% b. u. ) M oistu re c on ten t(% b. u. )
Storage period (days)
Storage period (days)
Storage period (days)
Bag type silo
PET bottles
control Bag type silo
PET bottles
control Bag type silo
PET bottles
TABLE 1. Mathematical models used to represent the variation in moisture content, apparent density, electrical conductivity, germination percentage and cooking time of beans during storage, and average values of the features which did not vary significantly throughout the storage, in each storage system.
Variable Moisture content (% b.u.)
Storage Ajusted equations g.l.error F P R2
Moisture content 12.3 Silo bag ŷ=12.33 - - - -
PET bottle ŷ=12.25 - - - -
Control ŷ=12.28-0.0003x+0.0003x2 12 66.70 <0.0001 0.92
15.7 Silo bag ŷ=15.34 - - - -
PET bottle ŷ=15.44 - - - -
Control ŷ=15.68-0.0105x +0.0002x2 12 12.27 0.0013 0.67
17.8 Silo bag ŷ=17.91+0.0316x-0.0001x2 12 65.12 <0.0001 0.92
PET bottle ŷ=17.80 - - - -
Control ŷ=17.71+0.0011x+0.0001x2 12 9.65 0.0032 0.62
Apparent Density 12.3 Silo bag ŷ=780.1461-0.2026x+0.0012x2 12 19.26 0.0002 0.76
PET bottle ŷ=780.4074-0.1845x+ 0.0010x2 12 22.26 <0.0001 0.79
Control ŷ=779.4883-0.1433x-0.0017x2 12 69.49 <0.0001 0.92
15.7 Silo bag ŷ= 765.62 - - - -
PET bottle ŷ=760.54 - - - -
Control ŷ=759.9385+0.1405x-0.0028x2 12 4.06 0.0451 0.40
17.8 Silo bag ŷ=775.9782-0.1834x-0.0001x2 12 13.58 0.0008 0.69
PET bottle ŷ=773.06 - - - -
Control ŷ=774.6325+0.1254x-0.0043x2 12 16.05 0.0004 0.73
Electrical Conductivity
12.3 Silo bag ŷ=75.07+0.0007x2 13 26.71 0.0002 0.67
PET bottle ŷ=75.33+0.0007x2 13 46.58 <0.0001 0.78
Control ŷ=72.36+0.0015x2 13 53.41 <0.0001 0.80
15.7 Silo bag ŷ=74.95+0.0013x2 13 85.44 <0.0001 0.87
PET bottle ŷ=74.20+0.0014x2 13 60.88 <0.0001 0.82
Control ŷ=75.97+0.0014x2 13 34.49 <0.0001 0.73
17.8 Silo bag ŷ=72.07+0.0072x2 13 76.33 <0.0001 0.85
PET bottle ŷ=74.46+0.0036x2 13 45.66 <0.0001 0.78
Control ŷ=74.52+0.0028x2 13 290.87 <0.0001 0.96
Germination
Percentage 12.3 Silo bag PET bottle ŷŷ=99.17 =99.13 - - - - - - - - Control ŷ=100.54-0.0010x2 13 40.43 <0.0001 0.76
15.7 Silo bag ŷ=99.03 - - - -
PET bottle ŷ=99.70 - - - -
Control ŷ=100.84-0.0007x2 13 20.70 0.0005 0.61
17.8 Silo bag ŷ=101.09-0.0049x2 13 159.34 <0.0001 0.92
PET bottle ŷ=100.42-0.0010x2 13 30.31 0.0001 0.70
Control ŷ=101.63-0.0021x2 13 39.28 <0.0001 0.75
Cooking Time 12.3 Silo bag ŷ=27.2 - - - -
PET bottle ŷ=24.27+0.0005x2 13 14.29 0.0023 0.52
Control ŷ=25.66+0.0009x2 13 40.45 <0.0001 0.76
15.7 Silo bag ŷ=34.31+0.0015x2 13 96.32 <0.0001 0.88
PET bottle ŷ=35.91+0.0018x2 13 117.83 <0.0001 0.90
Control ŷ=36.30+0.0021x2 13 67.88 <0.0001 0.84
17.8 Silo bag ŷ=44.07+0.0058x2 13 673.88 <0.0001 0.98
PET bottle ŷ=40.97+0.0048x2 13 545.64 <0.0001 0.98
Control ŷ=43.28+0.0033x2 13 22.04 0.0004 0.63
Apparent density
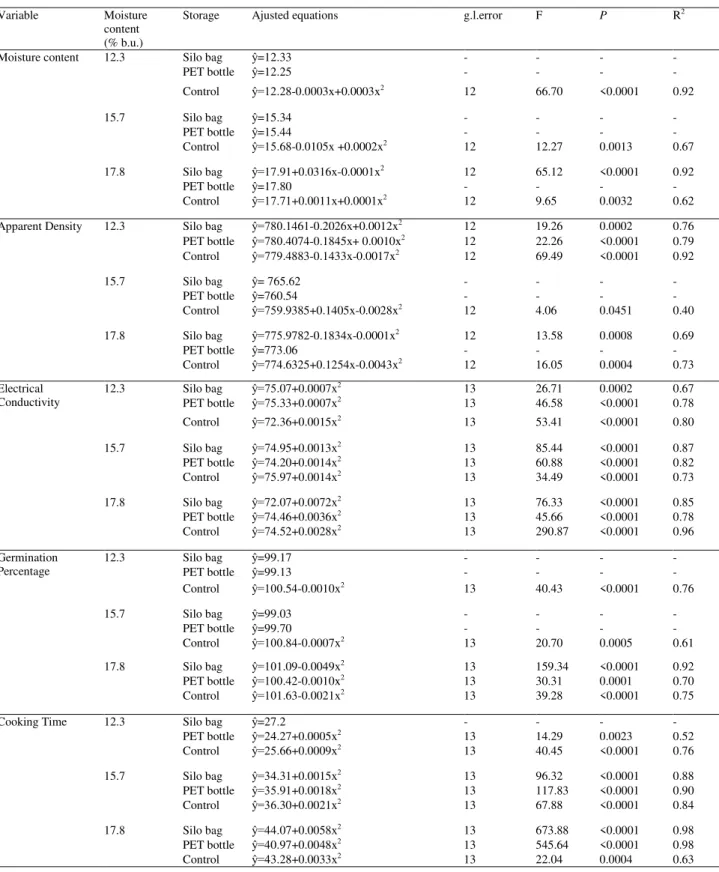
storage. However, there was a reduction in apparent density with these two levels of water in the control.
The results for apparent density varied significantly between the conditions in the stored grain with 12.3%, 15.7% and 17.8% (F2,6=158,38; P<0,0001; F2,6=11,06; P=0,0004 e F2,6=12,93; P=0,0002). It was observed, during storage, that the apparent density of the beans stored in the control was smaller than the apparent density of those stored in hermetic conditions (Figures 2A, 2B). However, when stored with 17.8% of moisture, the apparent density of the material stored in bag type silo also reduced, being less than those stored in PET bottles and larger than the product stored in the control (Figure 2C).
The decrease in the density value is usually associated with an increase in moisture content, insect attack and invasion by fungi (FARONI & SILVA, 2008). The losses registered in the apparent density of the stored beans with 17.8% of moisture, in bag type silos, may be associated with increased moisture content, favored by the presence of fungi, which was observed from 60 days of storage.
Regarding the material in the control, the reduction in density may be justified by the presence of insect-pest A. obtectus. Both the adult and the larvae of A. obtectus are feed by grains of beans, causing a reduction of dry matter and, consequently, the product density (FARONI & SILVA, 2008; RESENDE et al., 2008).
Electrical conductivity
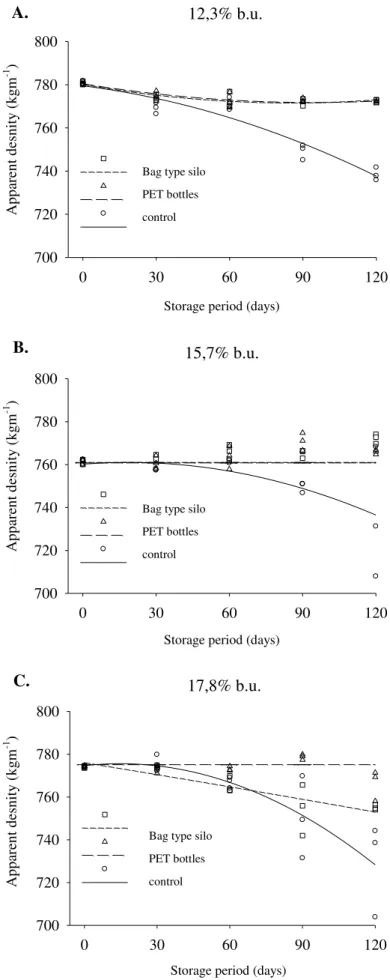
The results of the electrical conductivity of the solution containing the beans during storage are presented in Figure 3 and Table 1. The electrical conductivity of the solution increased with storage time in the stored material with 12.3%, 15.7% and 17.8% of moisture, in the three systems. However, there was significant variation between the systems of storage for beans stored with 17.8% (F2,6=104,26; P<0,0001).
In these, the electrical conductivity of the solution containing the material stored in bag type silos was greater than the electrical conductivity of the solution containing the beans in PET bottles and in the control. The increase in electrical conductivity was higher in the product with 17.8% of moisture (Figures 3A, 3B, 3C), indicating that there was more electrolyte leaching for beans stored with this moisture content.
The electrical conductivity is influenced by a number of factors, among which are the initial moisture content (VIEIRA et al., 2002), the presence of physical damages in the material (SILVA et al., 2008) and storage conditions (VIEIRA et al., 2001). The increase in electrical conductivity of beans stored with 17.8% of moisture in bag type silo may be associated with increased moisture content and the high incidence of fungi, observed throughout the storage.
12,3% b.u.
Período de armazenamento (dias)
0 30 60 90 120
Massa esp ecí fica ap arente (k g m -3) 700 720 740 760 780 800 Silo bolsa Garrafa pet Controle A. 15,7% b.u.
Período de armazenamento (dias)
0 30 60 90 120
Mas sa esp ecífica ap aren te (k g m -3) 700 720 740 760 780 800 Silo bolsa Garrafa pet Controle B. 17,8% b.u.
Período de armazenamento (dias)
0 30 60 90 120
Massa esp ec ífica ap arente (k g m -3) 700 720 740 760 780 800 Silo bolsa Garrafa pet Controle C.
FIGURE 2. Apparent density of stored beans with moisture content of 12.3% (A), 15.7% (B) and 17.8% (C), in bag type silo, PET bottles and control.
Storage period (days)
Storage period (days)
Storage period (days)
Bag type silo
PET bottles
control
Bag type silo
PET bottles
control
Bag type silo
12,3% b.u.
Período de armazenamento (dias)
0 30 60 90 120
Co nd utiv id ad e elétrica ( S cm
-1 g -1) 60 90 120 150 180 210 Silo bolsa Garrafa pet Controle A. 15,7% b.u.
Período de armazenamento (dias)
0 30 60 90 120
Con
du
tivid
ade elétrica (
S cm
-1 g -1 ) 60 90 120 150 180 210 Silo bolsa Garrafa pet Controle B. 17,8% b.u.
Período de armazenamento (dias)
0 30 60 90 120
60 90 120 150 180 210 Silo bolsa Garrafa pet Controle C. Co nd utivid ade elétric a ( S cm
-1 g
-1 )
FIGURE 3. Electrical conductivity of beans stored with moisture content of 12.3% (A), 15.7% (B) and 17.8% (C), in bag type silos, PET bottles and control.
Ele ct ri cal condu ct ivi ty (µ Scm -1 g -1 )
Bag type silo
PET bottles
control Bag type silo
PET bottles
control Bag type silo
PET bottles
control
Storage period (days)
Storage period (days)
Storage period (days)
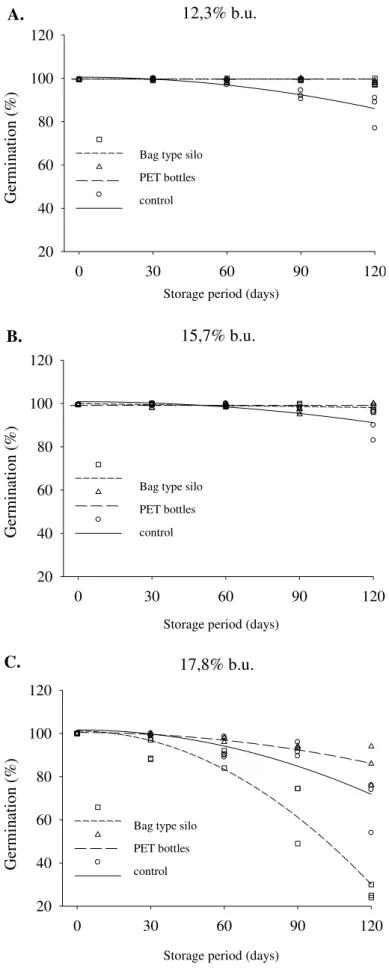
Germination percentage
Figure 4 and Table 1 shows the results for the germination of beans during storage. The germination percentages of the stored material with moisture content of 12.3% and 15.7% remained constant throughout the storage period, when the product was stored in bag type silos and PET bottles, however, reduced in the control. Those stored with 17.8% of moisture caused a reduction in germination percentage in the three storage conditions, this reduction being more pronounced in the material stored in bag type silos.
The germination percentage of beans varied significantly among storage systems when stored with 12.3%, 15.7% and 17.8% of moisture (F2,6=11,62; P=0,0003; F2,6=3,84; P=0,036 e F2,6=33,73; P<0,0001). In general, it was observed during storage that the germination percentages in material of the control tended to be lower than the germination percentage of beans stored under hermetic conditions (Figures 4A, 4B). Exception is made for the material stored with 17.8% of moisture; in these, the germination percentage of the product stored in bag type silos tended to be lower than the germination percentage of those in PET bottles and in the control (Figure 4C).
The germination capacity loss is common during storage. However, this process may be enhanced by the action of biotic factors such as fungi, insects and mites, as well as abiotic factors such as high moisture content and temperature of the mass (LOCHER & BUCHELI, 1998; CANEPPELE et al., 2003). In this study, it can be observed that the germination percentage decreased as the moisture content of the product increased (Figures 1, 5), which corroborates with this information. However, the decrease in germination percentage can also be associated with the losses recorded in the apparent density, given that the adjusted curves using regression models for these two variables showed the same tendency (Figures 2 and 5).
It was reported earlier that the increase in moisture content and decrease in apparent density of the material is associated to the action of biotic factors (fungi and insects), which indirectly affected the germination percentage. However, these organisms may also have directly affected the germination of the beans. Fungi and insects are reported in previous studies as being responsible for the reduction in physiological quality of the material, with consequent losses in their ability to germinate (CANEPPELE et al. 2003; ALEJANDRA PEREZ et al., 2007).
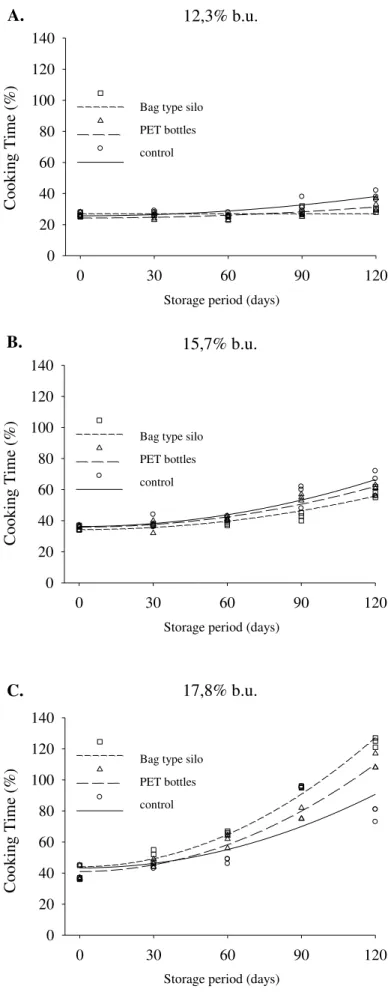
Cooking time
The beans cooking time increased throughout storage, with the three moisture contents in both storage systems, except the material stored with 12.3% of moisture, in bag type silos. In these, the cooking time remained constant, as shown in Figure 5. There was significant variation to the cooking time of storage systems for those with 12.3%, 15.7% and 17.8% of moisture (F2,6=28,06; P<0,0001; F2,6=12,66; P=0,0002 e F2,6=173,15; P<0,0001). It was observed that the beans cooking time stored with 12.3% and 15.7% of moisture was higher in the control (Figures 5A, 5B). In that stored with 17.8%, the cooking time was longer for the product stored in bag type silos and PET bottles (Figure 5C).
The results of the cooking time indicate that the beans cooking time is influenced by storage time and by the moisture content in which is stored. This is due to the appearing of the phenomenon hard-to-cook, or hardness of the cotyledons, which is accelerated by high humidity and prolonged storage (YOUSIF et al. 2002; AFFRIFAH & CHINNAN, 2006).
12,3% b.u.
Período de armazenamento (dias)
0 30 60 90 120
G
erm
in
ação
(%
)
20 40 60 80 100 120
Silo bolsa
Garrafa pet
Controle
A.
15,7% b.u.
Período de armazenamento (dias)
0 30 60 90 120
G
erm
in
ação
(%
)
20 40 60 80 100 120
Silo bolsa
Garrafa pet
Controle
B.
17,8% b.u.
Período de armazenamento (dias)
0 30 60 90 120
G
erm
in
açã
o (
%)
20 40 60 80 100 120
Silo bolsa
Garrafa pet
Controle
C.
FIGURE 4. Germination ppercentage of stored beans with moisture content of 12.3% (A), 15.7% (B) and 17.8% (C), in bag type silo, PET bottles and control.
Storage period (days)
Storage period (days) Storage period (days)
Bag type silo
PET bottles
control
Bag type silo
PET bottles
control Bag type silo
PET bottles
control
G
er
m
in
at
ion
(%
)
G
er
m
in
at
ion
(%
)
G
er
m
in
at
ion
(%
12,3% b.u.
Período de armazenamento (dias)
0 30 60 90 120
Tem po d e cocçã o ( m in. ) 0 20 40 60 80 100 120 140 Silo bolsa Garrafa pet Controle A. 15,7% b.u.
Período de armazenamento (dias)
0 30 60 90 120
Tem po d e co cçã o ( m in .) 0 20 40 60 80 100 120 140 Silo bolsa Garrafa pet Controle B. 17,8% b.u.
Período de armazenamento (dias)
0 30 60 90 120
Tem po d e co cçã o ( m in .) 0 20 40 60 80 100 120 140 Silo bolsa Garrafa pet Controle C.
FIGURE 5. Cooking time of beans stored with moisture content of 12.3% (A), 15.7% (B) and 17.8% (C), in bag type silo, PET bottles and control.
Storage period (days) Storage period (days) Storage period (days)
Bag type silo
PET bottles
control Bag type silo
PET bottles
control Bag type silo
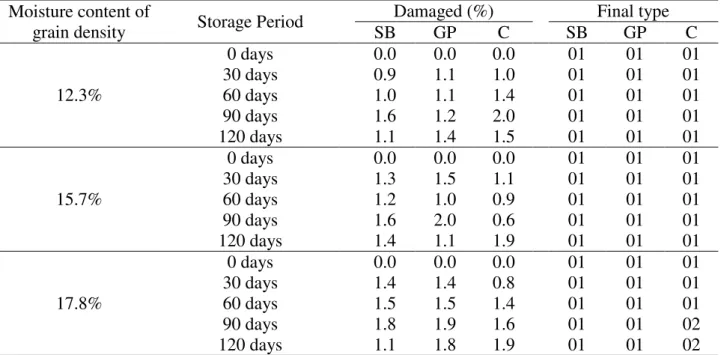
Bean classification
The percentage of damaged beans has increased over the storage, for those stored with the three levels of moisture content in the bag type silos, PET bottles and in the control (Table 2). However, the bean stored with the moisture content of 12.3% and 15.7% did not change the type throughout the storage at all storage conditions, as well as that one stored in the moisture content of 17.8 % in bag type silos and PET bottles. However, the bean stored in the control with this moisture content was classified as type two, in the last two evaluation periods. This result may have been influenced by the high moisture content of the product, fungi attack, and insect infestation observed during storage.
TABLE 2. Classification results of stored beans with moisture content of 12.3%, 15.7% and 17.8%, in bag type silo, PET bottles and control.
Moisture content of
grain density Storage Period
Damaged (%) Final type
SB GP C SB GP C
12.3%
0 days 0.0 0.0 0.0 01 01 01 30 days 0.9 1.1 1.0 01 01 01 60 days 1.0 1.1 1.4 01 01 01 90 days 1.6 1.2 2.0 01 01 01 120 days 1.1 1.4 1.5 01 01 01
15.7%
0 days 0.0 0.0 0.0 01 01 01 30 days 1.3 1.5 1.1 01 01 01 60 days 1.2 1.0 0.9 01 01 01 90 days 1.6 2.0 0.6 01 01 01 120 days 1.4 1.1 1.9 01 01 01
17.8%
0 days 0.0 0.0 0.0 01 01 01 30 days 1.4 1.4 0.8 01 01 01 60 days 1.5 1.5 1.4 01 01 01 90 days 1.8 1.9 1.6 01 01 02 120 days 1.1 1.8 1.9 01 01 02
* SB – SB – bag type silo, GP – PET bottle, and C – Control
CONCLUSIONS
The bean stored with moisture content of 12.3% and 15.7% in bag type silos and PET bottles kept its qualitative characteristics for up to 120 days. The quality of beans with moisture content of 17.8% was kept hermetically stored for a maximum of 60 days. The bean storage in bag type silos and PET bottles avoided the density loss, the deterioration of the cell membrane, the increase of moisture content and hardness of the beans. The storage in bag type silos and PET bottles is one viable alternative to preserving the quality of beans.
REFERENCES
AFFRIFAH, N.S.; CHINNAN, M.S. The effect of drying conditions on the development of the hard-to-cook defect in steam-treated cowpeas. International Journal of Food Science and Technology, Chester, v.41, n.8, p.867-877, 2006.
ALENCAR, E.R.; FARONI, L.R.D’A.; LACERDA FILHO, A.F.; PETERNELLI, L.A.; COSTA, A.R. Qualidade dos grãos de soja armazenados em diferentes condições. Revista Brasileira de Engenharia Agrícola e Ambiental, Campina Grande, v.13, n.5, p.606-613, 2009.
ASAE. AMERICAN SOCIETY OF AGRICULTURAL ENGINEERS. Moisture measurement - unground grain and seeds. In: __ ASAE Standards, St. Joseph: ASAE, 2004. 567 p.
BRASIL. Instrução Normativa nº 12, de 28.03.2008. Regulamento técnico do feijão. Diário Oficial da República Federativa do Brasil, Brasília, 31 mar. 2008.
BRASIL. Ministério da Agricultura, Pecuária e Abastecimento. Regras para análises de sementes. Brasília, 2009. 399 p.
CANEPPELE, M.A.B.; CANEPPELE, C.; LÁZZARI, F.A.; LÁZZARI, S.M.N. Correlation between the infestation level of Sitophilus zeamais Motschulsky, 1855 (Coleoptera, Curculionidae) and the quality factors of stored corn, Zea mays L. (Poaceae). Revista Brasileira de Entomologia, Curitiba, v.47, n.4, p.625-630, 2003.
COELHO, C.M.M.; BELLATO, C.M.; SANTOS, J.C.P.; ORTEGA, E.M.M.; TSAI, S.M. Effect of
phytate and storage conditions on the development of the ‘hard-to-cook’ phenomenon in common
beans. Journal of the Science of Food and Agriculture, London, v.87, n.7, p.1.237-1.243, 2007. COELHO, S.R.M.; PRUDENCIO, S.H.; NÓBREGA, L.H.P.; LEITE, C.F.R. Alterações no tempo de cozimento e textura dos grãos de feijão comum durante o armazenamento. Ciência e
Agrotecnologia, Lavras, v.33, n.2, p.539-544, 2009.
CONAB. COMPANHIA NACIONAL DE ABASTECIMENTO. Acompanhamento da safra brasileira. Disponível em: <http:// http://www.conab.gov.br/OlalaCMS/uploads/arquivos..pdf>. Acesso em: 13 out. 2010.
DARBY J.A.; CADDICK L.P. Review of grain harvest bag technology under Australian conditions. Canberra: CSIRO Entomology, 2007. 112 p.
FAO. Levantamento sistemático da produção agrícola. Disponível em:
<http://www.fao.br/indicadores/agopecuaria/ispa/default.shtrr>. Acesso em: 21 mar. 2006.
FARONI, L.R.D’A.; ALENCAR, E.R.; PAES, J.L.; COSTA A.R.; ROMA, R.C.C. Armazenamento
de soja em silos tipo bolsa. Engenharia Agrícola, Jaboticabal, v.29, n.1, p.91-100, 2009. FARONI, L.R.D’A.; CORDEIRO, I.C.; ALENCAR, E.R.; ROZADO, A.F.; ALVES, W.M. Influência do conteúdo de umidade de colheita e temperatura de secagem na qualidade do feijão. Revista Brasileira de Engenharia Agrícola e Ambiental, Campina Grande, v.10, n.1, p.148-154, 2006.
FARONI, L.R.D’A.; SILVA, J.S. Manejo de pragas no ecossistema de grãos armazenados. In:
SILVA, J.S. (Ed.). Secagem e armazenagem de produtos agrícolas. Viçosa: Aprenda Fácil, 2008. p.371-406.
LOCHER, R.; BUCHELI, P. Comparison of soluble sugar degradation in soybean seed under simulated tropical storage conditions. Crop Science, Madison, v.38, n.5, p.1229-1235, 1998. OLIVEIRA, F.A.; KHATCHATOURIAN, O.A.; BIHAIN, A. Estado térmico de produtos
armazenados em silos com sistema de aeração: estudo teórico e experimental. Engenharia Agrícola, Jaboticabal, v.27, n.1, p.247-258, 2007.
QUEZADA, M.Y.; MORENO, J.; VÁZQUEZ, M.E.; MENDOZA, M.; MÉNDEZ-ALBORES, A.; MORENO-MARTÍINEZ, E. Hermetic storage system preventing the proliferation of Prostephanus truncatus Horn and storage fungi in maize with different moisture contents. Postharvest Biology and Technology, Amsterdam, v.39, n.3, p.321-326, 2006.
RESENDE, O.; CORRÊA, P.C.; FARONI, L.R.D’A.; CECON, P.R. Avaliação da qualidade
RIBEIRO, N.D.; POERSCH, N.L.; ROSA, S.S. Períodos de semeadura e condições de
armazenamento na qualidade de cozimento de grãos de feijão. Ciência Rural, Santa Maria, v.38, n.4, p.936-941, 2008.
RUPOLLO, G.; GUTKOSKI, L.C.; MARTINS, I.R.; ELIAS, M.C. Efeito da umidade e do período de armazenamento hermético na contaminação natural por fungos e a produção de micotoxinas em grãos de aveia. Ciências Agrotécnicas, Lavras, v.30, n.1, p.118-125, 2006.
SAEG. Sistema para Análises Estatísticas, Versão 9.0. Viçosa: Fundação Arthur Bernardes, 2005. SILVA, M.A.D.; VIEIRA, R.D.; SANTOS, J.M. Influência do envelhecimento acelerado na
anatomia da testa de sementes de soja, cv. monsoy 84001. Revista Brasileira de Sementes, v.30, n.2, p.91-99, 2008.
SPSS. Sigma Plot user’s guide, Version 10.0. Chicago: SPSS, 2006.
VIEIRA, R.D.; PENARIOL, A.L.; PERECIN, D.; PANOBIANCO, M. Condutividade elétrica e teor de água inicial das sementes de soja. Pesquisa Agropecuária Brasileira, Brasília, v.37, n.9, p.1333-1338, 2002.
VIEIRA, R.D.; TEKRONY, D.M.; EGLI, D.B.; RUCKER, M. Electrical conductivity of soybean seeds after storage in several environments. Seed Science and Technology, Zurich, v.29, n.3, p.599-608, 2001.