SPATIAL DISTRIBUTION OF FIREWOOD PRODUCTION IN NORTHEASTERN
BRAZIL (1994-2013)
1Luiz Moreira Coelho Junior2*, Kalyne de Lourdes da Costa Martins3, Pablo Aurélio Lacerda de Almeida
Pinto4 and Magno Vamberto Batista da Silva5
1 Received on 17.01.2018 accepted for publication on 03.05.2018.
2 Universidade Federal da Paraíba, Departamento de Engenharia de Energias Renováveis, João Pessoa, PB - Brasil. E-mail:
<luiz@cear.ufpb.br>.
3 Universidade Federal da Paraíba, Mestre em Energias Renováveis, João Pessoa, PB - Brasil. E-mail: <kalyne_lourdes@hotmail.com>. 4 Universidade Federal de Pernambuco, Departamento de Administração, Recife, PE - Brasil. E-mail: <pabloaurelioap@hotmail.com>. 5 Universidade Federal da Paraíba, Departamento de Economia, João Pessoa, PB - Brasil. E-mail: <magnovbs@gmail.com>.
*Corresponding author.
ABSTRACT – This paper analyzed the effects of the spatial distribution of the firewood gross production value (GPV) of northeast Brazil through an exploratory approach using spatial data for the period from 1994 to 2013. Identification of spatial clusters in firewood production through the spatial weighting matrices of 2 nearest neighbors and “queen” and “rook” contiguity matrices were used. Based on the analyses, the following can be concluded: there is a positive autocorrelation for firewood GPV; the high-high spatial cluster was formed predominantly in the Bahia region; the high-high spatial cluster, which considers the weight matrix per area, was composed of the Ceará and Pernambuco mesoregions; the low-low spatial cluster consisted of the Sergipe and Alagoas mesoregions; and the low-low cluster, which considers the weight matrix per area, was formed by the Sergipe, Alagoas and Piauí regions.
Keywords: Forest economics; Biomass; Exploratory analysis of spatial data
DISTRIBUIÇÃO ESPACIAL DA PRODUÇÃO DE LENHA NO NORDESTE
BRASILEIRO (1994-2013)
RESUMO – Este artigo analisou os efeitos da distribuição espacial do Valor Bruto de Produção da lenha no Nordeste por meio da abordagem exploratória de dados espaciais, no período de 1994 a 2013. Identificou clusters espaciais na produção de lenha por meio das matrizes de ponderação espacial de 2 vizinhos mais próximos e a de contiguidade, convenções “rainha” e “torre”. A partir das análises, concluiu-se que: há autocorrelação positiva no VBP da lenha; O cluster espacial do tipo alto-alto foi formado, predominantemente pela região baiana; O cluster espacial do tipo alto-alto, considerando a matriz de ponderação Per Área, foi composto por mesorregiões do Ceará e Pernambuco; O cluster espacial do tipo baixo-baixo foi constituído por mesorregiões de Sergipe e Alagoas; e o cluster do tipo baixo-baixo, considerando a matriz de ponderação Per Área, foi formado pelas regiões de Sergipe, Alagoas e Piauí.
1. INTRODUCTION
From the earliest days, forest resources have been used as a source of energy for welfare. Firewood was the first source of energy used for heating and cooking food. Currently, its use is related to the availability of forests, economic competition with other energy sources, the level of development of the region and environmental issues (Brito, 2007).
With the development of mankind, there has been an increase in energy consumption, primarily of fossil fuels. The intense use of these fuels induced the CO2
concentration increase in the atmosphere. This promoted climate changes and increased dependence on international oil markets, which are politically sensitive. These consequences have stimulated research on alternative energy sources, such as biomass (Perrin et al., 2008).
Biomass is biological matter that is either dead or alive and can come from animals or plants. Currently, biomass is widely used as an energy source for several regions of the world. In Brazil, the forest biomass (biodegradable portion of forestry products and services) has only a slight contribution to energy production. The following are the fuels that are used: sugarcane bagasse, ethanol, black liquor and firewood, where the latter is used in wood industries (Silveira et al., 2008; Eisenbies et al., 2009). Wood can be used directly as solid fuel, transformed into synthetic fuel or used as raw material for various industries. The possibility of exploitation and/or forest planting in most countries, which would reduce the dependence on foreign energy, is seen as a positive attribute of wood (Moreira, 2011). In Brazil, the wood used for energy purposes is primarily transformed into charcoal (carbonization) to meet the steel industry demands and for direct consumption (combustion). This use may be domestic (in rural areas) and industrial. The following are the firewood-consuming industries: cement, chemical, food and beverage, pulp and paper and ceramics. Among this group, the food and beverage industry and the ceramic industry represent more than 60% of the consumption (Vale et al., 2002).
In the Brazilian Northeast, firewood production meets local or sub-regional demands; the red ceramic companies stand out, consuming approximately 8 million cubic meters of firewood per year. Space is an important factor in firewood production because it is linked to
inequalities observed between locations. Such inequalities favor the emergence of economic agglomerations and thus define spatial patterns. The geographic distribution of the supply of this product depends on consumers that offer convenient prices for producers. Therefore, firewood demands generate supplier “basins” around the consumption centers. These centers expand their acquisition radii until the product price at the origin, along with the transport costs, reach the limit of the consumer’s ability to pay. This relationship determines the spatial pattern of firewood supply in the Brazilian Northeast (Riegelhaupt et al., 2010; Travassos and Souza, 2014; Coelho Junior et al., 2018).
The classical econometric models do not incorporate enough theoretical elements to explain spatial problems. The conventional estimation techniques (linear regression) are premised on the fact that the random error terms have zero mean, unit variance and are not correlated. To overcome this limitation, spatial econometrics account for the effects caused by spatial autocorrelation and spatial heterogeneity (Anselin, 2003; Almeida, 2012; Lincaru et al., 2016).
Spatial autocorrelation concerns the existence of a positive or negative correlation between the distance between points and the similarity in values measured for a variable (Legendre, 1993). Spatial autocorrelation is an important factor to be considered in studies related to firewood extraction in northeastern Brazil because of the differences in the availability of vegetation between regions. The political-administrative area boundaries are different from vegetation areas, and an area explored from one region may be accounted for in another region, which would generate measurement errors (Nunes et al., 2016; Khuc et al., 2018). One study Reis and Guzmán (1993) estimated an econometric deforestation model of the Brazilian Amazon using cross-section data at the municipal level. This article improved the studies from another paper Reis and Margulis (1991) in three aspects: the theoretical specifications of the model, in the database and of the regression analysis, which considered the spatial autocorrelation phenomenon. Thus, the results enabled better diagnosis and treatment of the problems derived from the omission of variables, measurement errors and poor specification.
production (spatial clusters), observe the existence of spatial regimes and verify atypical observations (outliers and leverage points). Thus, this article analyzed the effects of the spatial distribution of the firewood gross production value of northeast Brazil through an exploratory approach using spatial data for the period from 1994 to 2013.
2. MATERIALS AND METHODS 2.1. Data
The data used were the firewood gross production value (GPV) from extraction in the northeastern mesoregions of Brazil for the years of 1994 and 2013. This information was collected from the Automatic Recovery System (Sistema de Recuperação Automática - SIDRA) of the Brazilian Institute of Geography and Statistics (Instituto Brasileiro de Geografia e Estatística - IBGE). The northeastern mesoregion areas (km²) obtained from the IBGE were used. The GPV per area (GPV/km2)
values were measured to ensure that there was no influence from the mesoregion territorial dimensions. The values were adjusted by the IGP-DI (Base 2012 = 100). 2.2. Exploratory Spatial Data Analysis
Exploratory spatial data analysis (ESDA) addresses the effects of spatial dependence and spatial heterogeneity. This methodology can describe spatial distribution (spatial clusters); it checks for existing spatial regimes or other reasons for spatial instability (nonstationarity) and identifies atypical observations (outliers and leverage points) (Perobelli et al., 2007).
Spatial autocorrelation indicates that the value of a particular variable in a region i is related to the value of this variable in the neighboring regions j. To check the degree of spatial interaction, one must specify a spatial weight matrix (W). The geographical connection criterion of the distance-based spatial weight matrix is determined through the contiguity and/or geographical distance according to a given metric. One of the matrices used in the literature is the matrix of k-nearest neighbors,
wij (k).. Formally, this type of matrix is given by the following expression:
where, dij= distance between regions i and jdi (k) = cutoff distance for region i to have exactly k
neighbors. The adoption of the matrix of k-nearest neighbors ensures that there are no “islands”, i.e., regions that do not have neighbors. Moreover, this type of matrix combats the imbalance of connectivity because all regions have the same number of neighbors (Almeida, 2012).
According to Anselin (2003), another commonly used matrix is the binary spatial weights matrix based on contiguity. The contiguity matrix is symmetric and aims to identify the neighboring regions at each observation i of the set of n observations of the sample. In a binary matrix, if two regions are considered neighbors, a unit value is assigned in the matrix; otherwise, a null value is applied. Therefore, the contiguity relationship in the spatial weight matrix (W) is given by the equation below:
The contiguity matrix can have three conventions: queen, rook and bishop. The most used convention in the literature is queen, where in addition to the borders with an extent other than zero, the vertices are considered contiguous. In the “rook” convention, only the physical borders with a non-zero extent between the regions are considered. In the “bishop” convention, only the vertices are considered (Almeida, 2012).
The binary contiguity matrix does not guarantee the connectivity balance because there may be regions with more neighbors than other regions. However, this type of matrix enables the definition of higher order contiguities. The first-order matrix is formed by the direct neighbors of the regions. The second-order matrix is composed of neighbors of the neighbors of the regions. In addition, one can construct third-order matrices and so on (Anselin, 2003).
2.3 Indicators of Spatial Autocorrelation
The Moran’s statistic or Moran’s I statistic is a global spatial correlation indicator and is used as a way to obtain an overview of the spatial interrelation of the regions without providing the regional structure of the autocorrelation. From Cliff and Ord (1981), Moran’s I statistic is expressed as follows:
where, n = number of regions;Z = vector of n
observations for year t of the variable of interest in the form of deviation from the mean; W = spatial weight matrix; and S0 = a scalar equal to the sum of all the
elements of w.
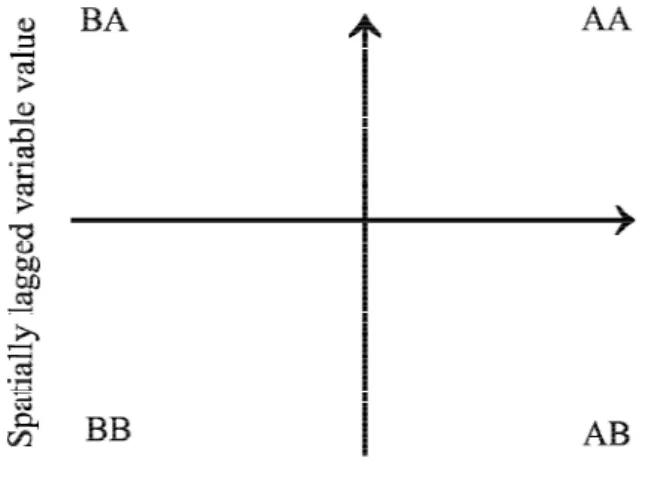
The interpretation of Global Moran’s I is as follows: when the value is positive, there is a positive correlation, and the high (low) values of the variable are surrounded by values also high (low). If the value is negative, high (low) values are surrounded by low (high) values. Additionally, if Moran’s I value is equal to zero, there is no spatial dependence for the case under analysis. Figure 1 shows the Moran scatter plot. This diagram is an ESDA tool that facilitates the interpretation of Moran’s I coefficient and reflects the spatial structure by considering neighborhood scales and trends (Almeida, 2012).
According to Capucho (2010), the scatter plot has four quadrants that represent different types of spatial linear associations: high (AA), low-low (BB), high-low (AB) and high-low-high (BA). The points, which represent the regions, located in quadrants AA and BB indicate that the regions have high and/or low values of the variable of interest. These locations are surrounded by regions that are also of high and/or low values. The regions located in quadrants BA and AB represent a group with low/high values of the variable of interest surrounded by regions with high/low values.
The local indicator of spatial association (LISA), unlike Moran’s I and according to Neves (2000), produces a specific value for each object to allow the identification
of clusters, outliers and more than one spatial regime.
One of the most used LISA’s is called the local Moran’s I index, which can be expressed as follows:Ii=Zi.WZi/
2 where, I
i = local index for object i; Zi=deviation
value of object i; WZi = mean value of the deviations of neighboring objects of i; and 2 variance of the
distribution of deviation values.
3. RESULTS
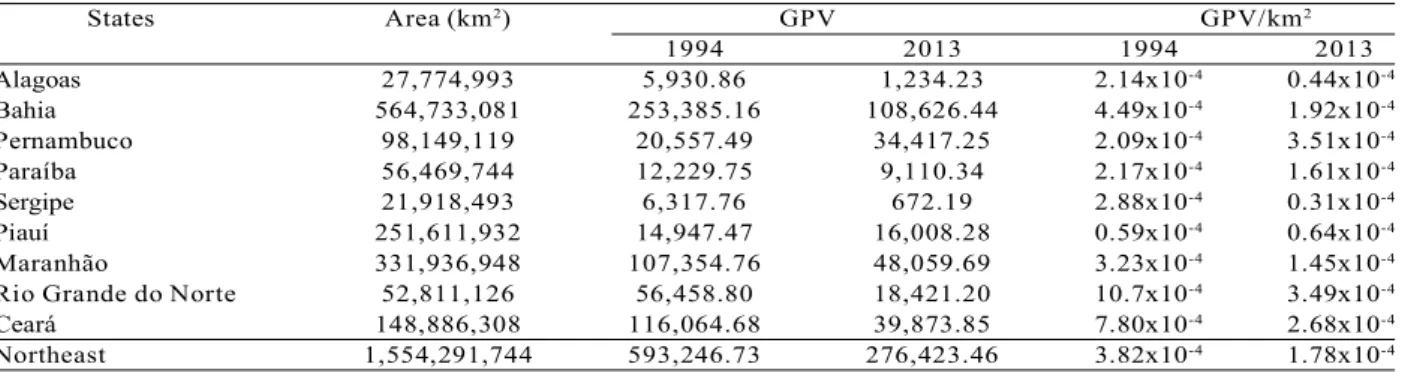
Table 1 shows the actual GPV and the actual GPV per area (GPV/Km2) of firewood extraction in northeastern
Brazil and in their respective states for the years of 1994 and 2013 (IGP-DI Base 2012 = 100).
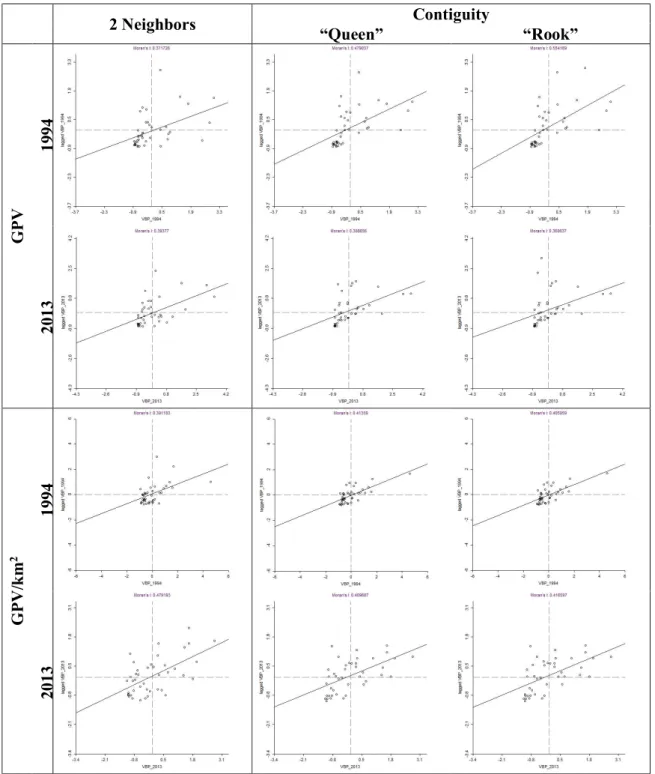
To test the existence of spatial dependence in the firewood production in the mesoregions of the Brazilian Northeast, the global and local spatial autocorrelation indicators were calculated. Figure 2 shows the Moran scatter plots in the mesoregions of the Brazilian Northeast, both for the nearest-neighbor matrix and for the contiguity matrix (“queen” and “rook” conventions) in 1994 and 2013.
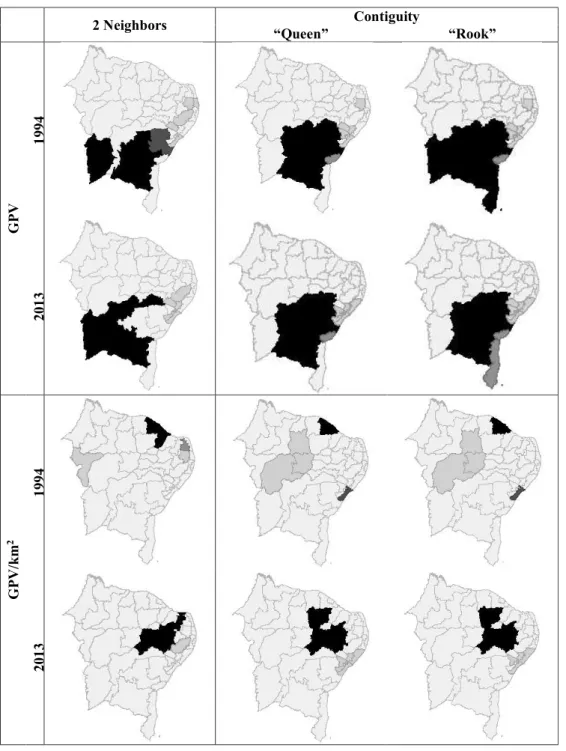
Figure 3 refers to the LISA statistics and shows four types of local spatial autocorrelations for the firewood GPV: high-high (black), low-low (light gray), low-high (medium gray) and high-low (dark gray). The LISA statistics were obtained for 42 mesoregions and are statistically significant at the 5% level. The white areas indicate the mesoregions with no significant LISA.
4. DISCUSSION
In the analyzed period (Table 1), there was an average decrease of 3.94% p.a. in the firewood GPV in the Brazilian Northeast as well as per area. Among other factors, the decrease is related to government actions aimed at combating desertification. According to the Sustainable Industrial Production Center (Centro de Produção Industrial Sustentável - CEPIS), the Brazilian Northeast has a desertification level similar to that of African countries. According to Uhlig et al. (2008), the intensive firewood demand by certain industries, such as ceramics and lime kilns, as well as agricultural expansion exert pressure on the remaining forest resources. In addition to monitoring by environmental agencies, the
Figure 1 – Moran scatter plot.
Figura 1 – Diagrama de Dispersão de Moran.
1, , ,
t
n
2
0 1
ij i j
i j
n i i
w z z
n
I
S
z
States Area (km2) GPV GPV/km2
1994 2013 1994 2013
Alagoas 27,774,993 5,930.86 1,234.23 2.14x10⁻⁴ 0.44x10⁻⁴
Bahia 564,733,081 253,385.16 108,626.44 4.49x10⁻⁴ 1.92x10⁻⁴
Pernambuco 98,149,119 20,557.49 34,417.25 2.09x10⁻⁴ 3.51x10⁻⁴
Paraíba 56,469,744 12,229.75 9,110.34 2.17x10⁻⁴ 1.61x10⁻⁴
Sergipe 21,918,493 6,317.76 672.19 2.88x10⁻⁴ 0.31x10⁻⁴
Piauí 251,611,932 14,947.47 16,008.28 0.59x10⁻⁴ 0.64x10⁻⁴
Maranhão 331,936,948 107,354.76 48,059.69 3.23x10⁻⁴ 1.45x10⁻⁴
Rio Grande do Norte 52,811,126 56,458.80 18,421.20 10.7x10⁻⁴ 3.49x10⁻⁴
Ceará 148,886,308 116,064.68 39,873.85 7.80x10⁻⁴ 2.68x10⁻⁴
Northeast 1,554,291,744 593,246.73 276,423.46 3.82x10⁻⁴ 1.78x10⁻⁴
Source: Own elaboration based on data from the IBGE (2016).
Table 1 – Actual gross production value (GPV) and actual gross production value (GPV/km2) per area of firewood extraction
(R$ 1,000.00) in the Brazilian northeastern states, for the period from 1994 to 2013 (IGP-DI Base 2012 = 100).
Tabela 1 – Valor Bruto de Produção Real e Valor Bruto de Produção Real per área do Extrativismo Vegetal da Lenha (R$ 1.000,00), nos estados nordeste brasileiro, para o período de 1994 a 2013 (IGP-DI Base 2012 = 100).
replacement of firewood by liquefied petroleum gas (LPG) has contributed in reducing extraction (IBGE, 2010).
Regarding the states, the relative variation rates of the firewood extraction GPV between 1994 and 2013 were as follows: Pernambuco (2.75% p.a.), Piauí (0.36% p.a.), Paraíba (-1.54% p.a.), Maranhão (-4.14% p.a.), Bahia (-4.36% p.a.), Ceará (-5.47% p.a.), Rio Grande do Norte (-5.72% p.a.), Alagoas (-7.93% p.a.) and Sergipe (-11.12% p.a.). The average participation of the states in the Brazilian Northeast in firewood extraction GPV were as follows: Bahia (41.00%), Maranhão (17.74%), Ceará (16.99%), Rio Grande do Norte (8.09%), Pernambuco (7.96%), Piauí (4.16%), Paraíba (2.68%), Sergipe (0.65%) and Alagoas (0.72%).
Although Bahia has a greater participation in firewood extraction GPV of the Brazilian Northeast, it is noted that in 1994, Rio Grande do Norte, due to the demand from the red ceramics industry, and in 2013, Pernambuco, due to the presence of the plaster industry, were the states with the highest GPV/km2. In 1994, the
states with the highest firewood GPV were as follows: Rio Grande do Norte (10.7x10⁻⁴), Ceará (7.80x10⁻⁴) and
Bahia (4.49x10⁻⁴). In 2013, the states with the highest
GPV were the following: Pernambuco (3.51x10⁻⁴), Rio
Grande do Norte (3.49x10⁻⁴) and Ceará (2.68x10⁻⁴).
To test the existence of spatial dependence in the firewood production in the mesoregions of the Brazilian Northeast, the global and local spatial autocorrelation indicators were calculated (Figure 2). For the nearest-neighbor matrix, the spatial weights used were 2. The
global Moran’s I values were positive, indicating the presence of a positive spatial autocorrelation. From the moment the amount of nearest neighbors increased, the global Moran’s I value decreased, reducing the spatial autocorrelation. This result is due to the increase in distance that decreases the spatial effects. Outliers (distant points) from the global spatial pattern (located in quadrants AB and/or BA) and leverage points (located in quadrants AA and/or BB) were also observed.
The matrix with two nearest neighbors for the firewood GPV showed the following values for the global Moran’s I coefficient: 0.371726 (1994) and 0.39377 (2013). In 1994, the South Center Bahia, Vale São Francisco of Bahia and Extreme Western Bahia mesoregions were the leverage points with a strong influence on the central trend located in quadrant AA. East Maranhão (located in quadrant AB) was an outlier, i.e., a point that does not follow the same spatial dependence process as the others. In 2013, the leverage points were found to be the North Center Bahia and the South Center Bahia mesoregions.
Source: Own elaboration based on data obtained through Geoda software.
Figure 2 – Moran scatter plot for the mesoregions of the Brazilian Northeast for the nearest-neighbor matrix and the contiguity matrix (“queen” and “rook” conventions) in 1994 and 2013.
Figura 2 – Diagrama de Dispersão de Moran para as mesorregiões no Nordeste, para a matriz de vizinhos mais próximos e matriz de contiguidade (convenções “rainha” e “torre”), nos anos de 1994 e 2013.
2 Neighbors
“Queen”
Contiguity
“Rook”
G
PV
19
94
20
13
G
PV
/k
m
2
19
94
201
Source: Own elaboration based on data obtained from Geoda software.
Legend: High-High High-Low Low-High Low-Low Not significant
Figure 3 – Cluster maps of firewood GPV of the Brazilian Northeast mesoregions for the nearest-neighbor matrix and contiguity matrix in 1994 and 2013.
Figura 3 – Mapas de Clusters do VBP da lenha das mesorregiões do nordeste brasileiro para a matriz de vizinhos mais próximos e de contiguidade, nos anos de 1994 e 2013.
2 Neighbors “Queen” Contiguity “Rook”
G
PV
19
94
20
13
G
PV
/k
m
2
19
94
20
Still, with the use of the two nearest neighbors matrix, considering the GPV/km2 (per area), the global
Moran’s I coefficient values were positive and greater than that observed in the two-nearest-neighbor matrix that did not consider the per area values. This indicates that this variable better captures the spatial dependence pattern in firewood production. The values were as follows: 0.391183 (1994) and 0.479193 (2013). In 1994, the mesoregion that had a strong influence on the central trend and was in quadrant AA was the metropolitan Fortaleza region. This can be explained by the urban expansion that has occurred rapidly in the metropolitan Fortaleza region in recent decades. In addition to vegetation removal, other forms of land use and occupation promoted deforestation, such as firewood extraction for energy purposes (Batista, 2010).
In 2013, the Pernambuco Hinterland, West Rio Grande do Norte and São Francisco of Pernambuco were identified as leverage points (quadrant AA). This result is due to the local productive arrangement (LPA) of the Araripe Plaster Center, which is responsible for 94% of the national production of plaster. The firewood from the Caatinga is the primary energy source of the plaster industry because the costs are lower compared with that of other energy sources, such as fuel oil, gas and electricity (Silva, 2008/2009).
Regarding the matrix with four neighbors, the global Moran’s I coefficient values were found to be 0.297889 (1994) and 0.296717 (2013). In 1994, the mesoregion identified as a leverage point (quadrant AA) was South Center Bahia. East Maranhão and Vale São Franciscano of Bahia showed high values surrounded by a low-value point and thus are considered outliers. In 2013, South Center Bahia and North Center Bahia were found to be leverage points. Outliers were not observed in 2013.
Regarding the “queen” contiguity matrix, Moran’s I values were 0.479037 (1994) and 0.388656 (2013). In 1994, the mesoregions that showed a strong influence on the central trend and were located in quadrant AA were South Central Bahia, Vale São Franciscano of Bahia, East Maranhão and Extreme West Bahia. In 2013, South Center Bahia and North Center Bahia were identified as leverage points.
The “queen” contiguity matrix (considering GPV per area) also showed positive values for global Moran’s I coefficients: 0.41359 (1994) and 0.409687 (2013). It was
noted that unlike the “queen” contiguity matrix (not considering GPV per area), the leverage points were not predominantly located in the Bahia region. In 1994, only the metropolitan Fortaleza mesoregion showed a strong influence on the central trend, identifying itself as a leverage point (quadrant AA). In 2013, two leverage points were observed: West Rio Grande do Norte and Pernambuco Hinterland.
The “rook” contiguity matrix showed the following values for the spatial autocorrelation index: 0.554169 (1994) and 0.360637 (2013). In 1994, five mesoregions were identified as leverage points (located in quadrant AA): South Center Bahia, Vale São Franciscano of Bahia, South Bahia, Extreme West Bahia and East Maranhão. In 2013, only two leverage points were noted (located in quadrant AA): South Center Bahia and North Center Bahia. South Bahia was identified as an outlier located in quadrant BA.
In the “rook” contiguity matrix (per area), the spatial autocorrelation index values were 0.405959 (1994) and 0.416597 (2013). Similar to the “queen” contiguity matrix (per area), only one leverage point was found (located in quadrant AA) in 1994, metropolitan Fortaleza. In 2013, the same leverage points were observed as those found for the “queen” contiguity matrix (per area): Pernambuco Hinterland and West Rio Grande do Norte. The LISA statistics (Figure 3) were obtained for 42 mesoregions and are statistically significant at the 5% level. The white areas indicate the mesoregions with no significant LISA.
The low-low spatial cluster in the Sergipe region is due to inexistent commercial firewood plantations, and the ceramics production is ensured through the wood acquired from the state of Bahia (Aragão et al., 2008).
In the two-neighbor matrix (per area), in 1994, a spatial cluster of the high-high type was found, which was formed by three mesoregions: North Ceará, metropolitan Fortaleza and Jaguaribe. A low-low cluster was also observed, composed by South Maranhão. In 2013, the high-high cluster was formed by five mesoregions: Pernambuco São Francisco, Pernambuco Hinterland, South Ceará, Paraíba Hinterland and Central Rio Grande do Norte. The Pernambuco Agreste composed the low-low cluster. That is, compared with the two-neighbor matrix (not considering per area), the spatial clusters showed changes in their composition.
For the “queen” convention, in 1994, it was found that five mesoregions formed the high-high type cluster: Extreme West Bahia, Vale São Franciscano of Bahia, North Center Bahia, South Center Bahia and Northeast Bahia. East Sergipe, Sergipe Hinterland, Alagoas Hinterland, Alagoas Agreste and Paraíba Agreste formed the low-low spatial cluster. Another spatial cluster was observed (low-high) that was composed of metropolitan Salvador. In 2013, five mesoregions formed the high-high spatial cluster: Vale São Franciscano of Bahia, North Center Bahia, South Center Bahia, Northeast Bahia and Pernambuco São Francisco. The low-low spatial cluster was composed of the following mesoregions: Sergipe Agreste, East Sergipe, East Alagoas, Alagoas Agreste, Alagoas Hinterland and Sergipe Hinterland. Metropolitan Salvador, as in 1994, composed the low-high type spatial cluster.
In 1994, the “queen” contiguity matrix (per area) showed a high-high spatial cluster composed of two mesoregions: North Ceará and metropolitan Fortaleza. Another spatial cluster was also observed (low-low), formed by Southwest Piauí, Southeast Piauí and North Center Piauí. In 2013, the high-high type spatial cluster was formed by five mesoregions: Ceará Hinterlands, Paraíba Hinterland, South Ceará, Pernambuco Hinterland and Pernambuco São Francisco. Sergipe Hinterland, East Sergipe, East Alagoas and Alagoas Agreste formed the low-low spatial cluster.
In 1994, the “rook” contiguity matrix showed the following mesoregions for the high-high cluster: Extreme West Bahia, Vale São Franciscano of Bahia, North Center Bahia, Northeast Bahia, South Center Bahia and South Bahia. Metropolitan Salvador composed the low-high
type spatial cluster. The low-low spatial cluster was formed by East Sergipe, Sergipe Hinterland, Alagoas Hinterland, Alagoas Agreste and Paraíba Agreste. For 2013, the high-high cluster of the “rook” matrix was composed of five mesoregions: South Center Bahia, Vale São Franciscano of Bahia, North Center Bahia, Northeast Bahia and Pernambuco São Francisco. The low-low cluster had the following composition: Sergipe Hinterland, Sergipe Agreste, East Sergipe, East Alagoas and Alagoas Agreste. Another spatial cluster was found (low-high) that was formed by South Bahia and metropolitan Salvador. In the “rook” contiguity matrix (per area), it was observed that the spatial clusters (high-high and low-low) were composed of the same mesoregions verified for the “queen” contiguity matrix for 1994 and 2013.
5. CONCLUSION
According to the analyzes carried out, it is concluded that:
In the period between 1994 and 2013, in the Northeast there was a reduction of the VBP of firewood of 3.94% a.a. and Bahia had the largest participation, averaging 41% of the total. In terms of higher VBP Per Area were the states of Rio Grande do Norte in 1994 and Pernambuco in 2013. The I of Moran Global evidenced the presence of VBP spatial autocorrelation of wood from mesoregions of the Northeast and from the matrices of spatial weights with 2 nearest neighbors, the region was predominantly Bahia and in VBP Per Area were Ceará and Pernambuco. By means of the matrices of contiguity, conventions “queen” and “tower”, the same results were obtained.
The LISA statistic provided robustness to the Moran Global I for the VBP firewood from the northeastern mesoregions. The high-high space cluster from the spatial weights matrices with 2 closest neighbors was Bahia, and in terms per Area were Ceará and Pernambuco. The matrices of contiguity achieved similar results. The low-low cluster from the spatial-weighted matrices with 2 closest neighbors showed Sergipe, Alagoas, Pernambuco and Paraíba, and per area the same states were identified with the exception of Paraíba. For the matrices of contiguity were Sergipe and Alagoas and per area was added Piauí.
6. ACKNOWLEDGMENTS
The authors acknowledge the support of the National Council for Scientific and Technological Development – Brazil (Project No. 454830 / 2014-9).
7. REFERENCES
Almeida E. Econometria espacial aplicada. Campinas: Alínea; 2012.
Anselin L. Spatial externalities, spatial multipliers, and spatial econometrics. International Regional Science Review. 2003;26(2):153-66.
Aragão FM, Gomes LJ, Nogueira M, Ribeiro GT. Caracterização do consumo de lenha pela atividade cerâmica, nos municípios de Itabaiana, Itabaianinha e Umbaúba-SE. Revista Científica Eletrônica de Engenharia Florestal. 2008;7(12):1-16.
Batista CT. A mineração de agregados na Região Metropolitana de Fortaleza: Impactos Ambientais e Conflitos de uso e Ocupação do
Solo[dissertação]. Fortaleza: Universidade Federal do Ceará; 2010.
Brito JO. O uso energético da madeira. Estudos Avançados. 2007;21(59)185-193.
Capucho TO. Produção leiteira no Paraná: um estudo considerando os efeitos espaciais
[dissertação]. Maringá: Universidade Estadual de Maringá; 2010.
Cliff AD, Ord JK. Spatial processes: models and applications. London: Taylor & Francis; 1981.
Eisenbies MH, Vance ED, Aust WM, Seiler JR. Intensive utilization of harvest residues in southern pine plantations: quantities available and implications for nutrient budgets and
sustainable site productivity. Bioenergy Research. 2009;2:90-8.
Coelho Junior LM,·Martins KLC, Carvalho M. Carbon footprint associated with firewood consumption in northeast Brazil: An analysis by the IPCC 2013 GWP 100y Criterion. Waste and Biomass Valorization, published online 30 March 2018.
Lincaru C. Peri-urban Areas and Land Use Structure in Romania at LAU2 Level: An
Exploratory Spatial Data Analysis. Procedia Environmental Sciences. 2016;32:124-37.
Henriques Jr MF. Potencial de financiamento de eficiência energética nos setores de cerâmica e gesso no Nordeste. Banco Interamericano de Desenvolvimento. 2013. [acessado em: 15 de out. de 2015]. Disponível em: https://publications.iadb.org/handle/11319/ 3671?locale-attribute=pt.
Instituto Brasileiro de Geografia e Estatística – IBGE. Produção da extração vegetal e da silvicultura. Rio de Janeiro: 2016. v.25
Khuc QV, Tran BQ, Meyfroidtc P, Paschke MW. Drivers of deforestation and forest degradation in Vietnam: An exploratory analysis at the national level. Forest Policy and Economics. 2018;90:128-41.
Legendre P. Spatial autocorrelation: trouble or new paradigm? Ecology. 1993;74(6):1659-73.
Moreira JMMAP. Potencial e participação das florestas na matriz energética. Pesquisa Florestal Brasileira. 2011;31(68):363-72.
Neves MC. Análise exploratória espacial de dados sócio-econômicos de São Paulo. Embrapa Meio Ambiente e Instituto Nacional de Pesquisa Espacial; 2000. [acessado em: 04 de nov. de 2014]. Disponível em: http://www.dpi.inpe.br/gilberto/ papers/marcos_gisbrasil2000.pdf.
Nunes AN, Lourenço L, Castro Meira AC. Exploring spatial patterns and drivers of forest fires in Portugal (1980–2014). Science of the Total Environment. 2016;573:1190-202.
Perrin R, Vogel K, Schmer M, Mitchell R. Farm-scale production cost of switchgrass for biomass. Bioenergy Research. 2008;1:91-7.
Perobelli FS, Almeida ES, Alvin MIS, Ferreira PGC. Análise espacial do setor agrícola brasileiro (1991-2003): uma análise espacial. Nova Economia. 2007;17(1):65-91.
Reis EJ, Guzmán RM. Um modelo ecométrico do desflorestamento da Amazônia. Pesquisa e Planejamento Econômico. 1993;23(1):33-64.
jungle-clearing. In: Dorrnbush R, Poterba J, editores. Global warming: the economic policy responses. Cambrigde: MIT; 1991. p. 335-75.
Riegelhaupt EM, Pareyn FGC. A questão energética. In: Gariglio MA, Sampaio EVSB, Cestaro LA, Kageyama PY, organizadores. Uso sustentável e conservação dos recursos florestais da caatinga. Brasília, DF: Serviço Florestal
Brasileiro; 2010. p.65-75.
Silva JAA. Potencialidades de florestas energéticas de Eucalyptus no pólo gesseiro do Araripe-Pernambuco. Anais da Academia Pernambucana de Ciência Agronômica. 2008-2009;5-6:301-19.
Silveira P, Koehler HS, Sanqueta CR, Arce JE. O
Estado da Arte na estimativa de biomassa e carbono em formações florestais. Revista Floresta. 2008;38(1):185-206.
Travassos IS, Souza BI. Os negócios da lenha: indústria, desmatamento e desertificação no Cariri paraibano. Revista Espaço e Tempo.
2014;18(2):329-40.
Uhlig A, Goldemberg J, Coelho ST. O uso de carvão vegetal na indústria siderúrgica brasileira e o impacto sobre as mudanças climáticas. Revista Brasileira de Energia. 2008;14(2):67-85
Vale AT, Brasil MAM, Leão AL. Quantificação e caracterização energética da madeira e casca de espécies do cerrado. Ciência Florestal.