António Afonso & Mina Kazemi
Euro area sovereign yields and the
power of QE
WP12/2017/DE/UECE _________________________________________________________ Department of EconomicsW
ORKINGP
APERS ISSN 2183-1815Euro area sovereign yields and the power of QE
*
António Afonso
$, Mina Kazemi
#2017
Abstract
We assess the determinants of long-term sovereign yield spreads using a panel of 10 Euro area countries over the period 1999.01–2016.07 notably regarding the ECB (standard and non-standard) quantitative easing measures. Our findings indicate that the international risk, the bid-ask spread and real effective exchange rate increased the 10-year sovereign bond yield spreads. Moreover, quantitative easing, notably Longer-term Refinancing Operations (LTROs), Targeted LTROs and the Securities Market Program decreased the yield spreads. JEL: C23, E52, G10
Keywords: sovereign bonds, non-conventional monetary policy, panel data
* The opinions expressed herein are those of the authors and do not necessarily reflect those of the authors’
employers.
$ ISEG/ULisboa –Universidade de Lisboa, Department of Economics; UECE – Research Unit on Complexity
and Economics, R. Miguel Lupi 20, 1249-078 Lisbon, Portugal. UECE is supported by the Fundacão para a Ciência e a Tecnologia. Email: [email protected].
1. Introduction
After the 2010-11 sovereign debt crisis in the EMU and the significant increase of the spreads on 10-year sovereign bond yields, there was also an increase in the credit risk premium for periphery countries. The existing literature has confirmed that both international and country-specific risk factors such as liquidity or default risk premium, have significant impact on bond yield differentials, but little evidence is available regarding the role of the ECB securities’ purchases.
In fact, several studies have found that sovereign bond yield spreads are driven by international risk factors (e.g. Codogno et al. 2003, Geyer et al. (2004), Pozzi and Wolswijk (2008), Favero et al. (2010)). Regarding liquidity risk this was a key factor for yield differentials in the EMU countries mentioned notably by Gomez-Puig (2006) and Codogno et al. (2003), and De Santis (2012), Afonso et al. (2012), Constantini et al. (2014). Afonso, Arghyrou and Kontonikas (2014), by assessing the determinants of the government bond yield spreads for 10 euro area countries using monthly data for the period from January 1999 to December 2010 report also the role of the credit agencies.
In another strand of the literature, Aßmann and Boysen-Hogrefe (2012), Bernoth and
Erdogan (2012), D’Agostino and Ehrmann (2013), and Afonso and Jalles (2016), by
analysing the time-varying coefficient of the determinants of sovereign yield spreads also highlight the relevance of a volatility index, bid-ask spread, and debt-to-GDP ratio. There is also evidence that the relevance of the determinants can change over time. Several of those fundamentals such as general risk aversion and liquidity risks were not priced in the first years of the monetary union.
Therefore, we add to the literature by assessing also the role of some the ECB quantitative easing (QE) measures (standard and non-standard) for yield spreads using a panel of euro area countries over the period 1999.01–2016.07.
3. Methodology
We used a panel of 10 euro area countries namely Austria, Belgium, Finland, France, Greece, Ireland, Italy, the Netherlands, Portugal and Spain, over the period 1999.01-2016.07. We use the following specification for 10-year sovereign bond yield spreads against Germany:
ݏݎ݁ܽ݀௧ = ߙ + ߚଵݒ݅ݔ௧+ ߚଶܤܣܵ௧+ ߚଷܴܧܧܴ௧+ +ߚହܧݔ݁ܿݐ݁݀_ܦܾ݁ݐ௧+
ߚܧݔ݁ܿݐ݁݀_ܤ݈ܽܽ݊ܿ݁௧+ ߚܽݒ݁ݎܽ݃݁_ݎܽݐ݅݊݃௧+ ߚ଼ܽݒ݁ݎܽ݃݁_ݑݐ݈݇௧+ ߚଽܮܴܱܶ௧+
ߚଵܰ݁ݐ_ܮܴܱܶ௧+ ߚଵଵܵܯܲ௧+ ߚଵଶܥܤܲܲ1௧+ ߚଵଷܲܵܲܲ௧+ ߝ௧. (1)
We use the ݒ݅ݔ௧, Chicago Board of Exchange Volatility Index (VIX), as a proxy for
the international risk factor with higher (lower) values increasing (decreasing) bond spreads. ܤܣܵ௧ is the 10-year bond yield bid-ask spread, used as a measure of illiquidity. The higher
(lower) values of the bid-ask spread indicate a decrease (increase) in liquidity and increases (decreases) yield spreads. ܴܧܧܴ௧ is the real effective exchange rate and a positive (negative)
change appreciates (depreciates) the currency thus increasing (decreasing) yield spreads. ܧݔ݁ܿݐ݁݀_ܦܾ݁ݐ௧ denotes the expected government debt-to-GDP ratio against Germany, and
an increase indicates a higher risk so we expect the spreads to increase. ܧݔ݁ܿݐ݁݀_ܤ݈ܽܽ݊ܿ݁௧
denotes the expected government budget balance-to-GDP ratio against Germany, with an increase implying a decrease in yield spreads.
In addition to the baseline model we included the ܽݒ݁ݎܽ݃݁_ݎܽݐ݅݊݃௧ and the
ܽݒ݁ݎܽ݃݁_ݑݐ݈݇௧ (simple average of the three main credit ratings, Standard & Poor’s,
Moody’s and Fitch). In this case we followed Afonso et al. (2012) in transforming the rating scores into the linear scale.1
Finally, we have included standard and non-standard measures of the ECB, namely several open market operations. Hence, we used the Longer-term Refinancing Operations, which provide longer-term refinancing to the financial sector (Net-LTRO); Targeted Longer-term Refinancing Operations (TLTROs), which provide financing to credit institutions for periods up to four years, and Asset Purchase Program (APP), since 2008. On the other hand, the APP consists of three terminated and four ongoing programs. Due to the time span availability of data, since these are recent programs, we studied the effects of the two terminated programs namely, Securities Market Program (SMP), the first Covered Bond Purchase Program (CBPP1) and an ongoing program, Public Sector Purchase Program (PSPP).
4. Analysis
We have collected the data from various sources and Table A1 in the appendix reports data sources.
We estimated equation (1) via OLS and 2SLS and the results of the Hausman test confirms the use of a fixed effects model. Due to the natural correlation between the expected debt and budget balance, we do not include them in the same specification at the same time.
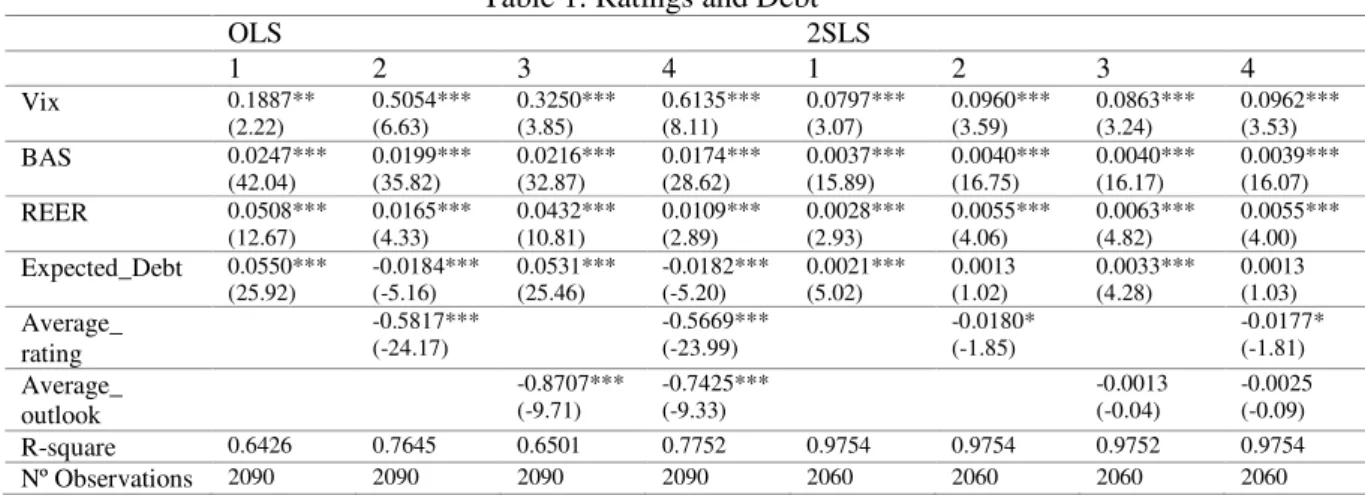
Table 1: Ratings and Debt
OLS 2SLS 1 2 3 4 1 2 3 4 Vix 0.1887** (2.22) 0.5054*** (6.63) 0.3250*** (3.85) 0.6135*** (8.11) 0.0797*** (3.07) 0.0960*** (3.59) 0.0863*** (3.24) 0.0962*** (3.53) BAS 0.0247*** (42.04) 0.0199*** (35.82) 0.0216*** (32.87) 0.0174*** (28.62) 0.0037*** (15.89) 0.0040*** (16.75) 0.0040*** (16.17) 0.0039*** (16.07) REER 0.0508*** (12.67) 0.0165*** (4.33) 0.0432*** (10.81) 0.0109*** (2.89) 0.0028*** (2.93) 0.0055*** (4.06) 0.0063*** (4.82) 0.0055*** (4.00) Expected_Debt 0.0550*** (25.92) -0.0184*** (-5.16) 0.0531*** (25.46) -0.0182*** (-5.20) 0.0021*** (5.02) 0.0013 (1.02) 0.0033*** (4.28) 0.0013 (1.03) Average_ rating -0.5817*** (-24.17) -0.5669*** (-23.99) -0.0180* (-1.85) -0.0177* (-1.81) Average_ outlook -0.8707*** (-9.71) -0.7425*** (-9.33) -0.0013 (-0.04) -0.0025 (-0.09) R-square 0.6426 0.7645 0.6501 0.7752 0.9754 0.9754 0.9752 0.9754 Nº Observations 2090 2090 2090 2090 2060 2060 2060 2060
Note: the asterisks ***, **, * indicate significance at 1, 5, 10% respectively. Fixed effects panel estimates. The instruments used in the 2SLS estimations are the second and third lags of the dependent variable and the first three lags of the independent variables.
The results of the baseline model in Table 1 show that all the coefficients are statistically significant and have the expected signs. Notably, the VIX, the bid-ask spread, expected debt differential, and REER, while the average rating has a significant negative effect on 10-year bond yield spreads.
In the next step, after adding the quantitative easing measures, we see that the LTROs have a significant negative impact on the 10-year bond yield spreads (Table 2). Moreover, Net-LTRO, which includes only the LTROs, and the SMP also have negative significant impacts on the spreads. On the other hand, we found negative but not significant results for the CBPP1 and PSPP (although the time span is shorter).
Table 2: QE and Debt (2SLS) 1 2 3 4 5 Vix 0.0906*** (3.34) 0.0912*** (3.45) 0.3356** (2.53) 0.1853* (1.86) 0.0391 (0.36) BAS 0.0040*** (16.92) 0.0040*** (16.92) 0.0044*** (8.89) 0.0042*** (9.61) 0.0147*** (4.71) REER 0.0064*** (4.93) 0.0063*** (4.84) 0.0178** (2.03) 0.0144** (1.98) 0.1045* (1.77) Expected_Debt 0.0032*** (4.14) 0.0029*** (3.75) 0.0003 (0.11) 0.0020 (0.81) 0.0199** (2.36) LTRO_growth -0.0016** (-2.44) NLTRO_growth -0.0016** (-2.36) SMP_growth -0.0080** (-2.11) CBPP1_growth -0.0070 (-1.38) PSPP_growth -0.0074 (-1.39) R-square 0.9752 0.9752 0.9681 0.9696 0.8853 Nº observations 2050 2050 690 790 110
Note: the asterisks ***, **, * indicate significance at 1, 5, 10% respectively. See Table 1.
In Table 3 we report the results with the expected budget balance. The estimation provides the correct coefficient signs for each exogenous variable, although the expected balance has no significant impact on the spreads. The LTRO, Net-LTRO and the SMP still have negative significant impacts on yield spreads.
Table 3: QE and budget balance (2SLS)
1 2 3 4 5 Vix 0.0634** (2.46) 0.0688*** (2.65) 0.0726*** (2.79) 0.3405*** (2.64) 0.1605* (1.69) BAS 0.0039*** (16.27) 0.0040*** (16.39) 0.0040*** (16.47) 0.0044*** (8.98) 0.0043*** (9.75) REER 0.0030*** (2.89) 0.0032*** (3.07) 0.0034*** (3.24) 0.0163** (2.08) 0.0107 (1.59) Expected_OB -0.0030 (-0.80) -0.0029 (-0.76) -0.0021 (-0.54) -0.0166 (-0.73) -0.0033 (-0.18) LTRO_growth -0.0018*** (-2.67) Net_LTRO_ growth -0.0020*** (-3.09) SMP_growth -0.0080** (-2.10) CBPP1_growth -0.0079 (-1.55) R-square 0.9749 0.9750 0.9750 0.9678 0.9689 Nº observations 2060 2050 2050 690 790
Note: the asterisks ***, **, * indicate significance at 1, 5, 10% respectively. See Table 1.
5. Conclusions
We have assessed the relevance of sovereign credit ratings and the ECB quantitative easing measures for yield spreads using a panel of 10 euro area countries over the period 1999.01–2016.07.
We find that the VIX, bid-ask spread and the real effective exchange rate increase 10-year sovereign bond yield spreads. We also found a significant positive impact of expected debt-to-GDP ratio against Germany on the sovereign yield spreads. We also concluded that the simple average of the ratings from the S&P, Moody’s and Fitch ratings are negatively affecting the sovereign bond yields.
Moreover, our results suggest that the ECB QE measures as Longer-term Refinancing Operations, Targeted Longer-term Refinancing Operations and the Securities Market Program have negatively affected 10-year sovereign yield spreads in the euro area. Hence, the power of the so-called non-conventional monetary policy in the euro area, via notably purchase programs, receives support in this regard.
References
Afonso, A., Arghyrou, M., Kontonikas, A. (2014) “Pricing sovereign bond risk in the EMU area: an empirical investigation”, International Journal of Finance and Economics, 19 (1), 49–56.
Afonso, A., Jalles, J. (2016). “Economic Volatility and Sovereign Yields' Determinants: A Time-Varying Approach”. ISEG Economics Department, WP 04/2016/DE/UECE.
Aßmann, C., Boysen-Hogrefe, J. (2012). “Determinants of government bond spreads in the euro area: in good times as in bad”. Empirica, 39 (3), 341-356.
Bernoth, K., Erdogan, B. (2012). “Sovereign bond yield spreads: A time-varying coefficient approach.” Journal of International Money and Finance, 31 (3), 639-656.
Codogno, L., Favero, C., Missale, A. (2003). “Yield spreads on EMU government bonds.”
Economic Policy, 18(37), 503-532.
Costantini, M., Fragetta, M., Melina, G. (2014). “Determinants of sovereign bond yield spreads in the EMU: An optimal currency area perspective”. European Economic Review,
70, 337-349.
D’Agostino, A., Ehrmann, M. (2014). “The pricing of G7 sovereign bond spreads–The times, they are a-changin”. Journal of Banking & Finance, 47, 155-176.
De Santis, R. (2012). “The Euro area sovereign debt crisis: safe haven, credit rating agencies and the spread of the fever from Greece, Ireland and Portugal”. ECB Working paper 1419. Favero, C., Pagano, M., Von Thadden, E. L. (2010). “How does liquidity affect government bond yields?”. Journal of Financial and Quantitative Analysis, 45, 107-134.
Geyer, A., Kossmeier, S., Pichler, S. (2004). “Measuring systematic risk in EMU government yield spreads”. Review of Finance, 8(2), 171-197.
Gomez-Puig, M. (2006). “Size matters for liquidity: Evidence from EMU sovereign yield spreads”. Economics Letters, 90(2), 156-162.
Pozzi, L., Wolswijk, G. (2008). “Have euro area government bond risk premia converged to their common state?” Discussion Papers 08-042/2, Tinbergen Institute.
Appendix
Variable Description Source
Bond_Spread_DEU_10y 10-year bond yield spread against German ECB/Own calculations Vix Chicago Board of Exchange Volatility Index Bloomberg
BAS 10 year bond yield bid_ask Spread Bloomberg and ECB REER Real Effective Exchange Rate, CPI based IFS
Expected_Debt Expected government debt against Germany, % of GDP EC Expected_OB Expected government budget balance against Germany, % of GDP EC
Rating_SP Credit rating S&P Standardandpoors Rating_M Credit rating Moody’s moodys
Rating_F Credit rating Fitch fitchratings Outlook_SP Credit Outlook S&P Standardandpoors Outlook_M Credit Outlook Moody’s moodys
Outlook_F Credit Outlook Fitch fitchratings LTRO Longer-term Refinancing Operation (includes TLTRO_l and
TLTRO_ll), Holdings, Euro billions
ECB
Net_LTRO Longer-term Refinancing Operation, Holdings, Euro billions ECB and own calculations TLTRO_l First Targeted Longer-term Refinancing Operation, Holdings, Euro
billions
ECB and own calculations TLTRO_ll Second Targeted Longer-term Refinancing Operation, Holdings,
Euro billions
ECB SMP Securities Market Programme, Holdings, Euro billions ECB CBPP1 Covered bond purchase programme 1, Holdings, Euro billions ECB PSPP Public Sector Purchase Programme, Holdings, Euro billions ECB