Text written for the book Scientific Knowledge and the Transgression of Boundaries
The use and influence of indicators in decisions about technology
innovation: Quantitative results from questionnaires in Portugal
Nuno Boavida
Karlsruhe Institute of Technology / ITAS and Universidade Nova de Lisboa / CESNova
Abstract
This work focuses on the role of indicators in technology innovation decisions in three knowledge-intensive groups: researchers in public institutions, leaders in research & development in industry and policy makers. The work presents quantitative results obtained from three questionnaires sent to these groups in Portugal.
The study suggests that indicators are instruments of technology innovation decision but their influence dependents on social context and the types of decisions. Results show that indicators were used by all groups, but were not significantly influential in technology innovation decisions. The group of researchers were more influenced by indicators than by their social relations, revealing a balance between an instrumental use, a symbolic use and no use at all of indicators. The group focused their decisions on the acquisition of products/technology, and identified its main influences in knowledge sources and users. The majority of the business and policy makers revealed that indicators were mostly used in a symbolic way, and were more influenced by social relations than by indicators. The business group focused its decision on the development of products/technology, and declared stronger influences from hierarchies and users in its decisions. The policy makers focused their decisions on the design of innovation policies, and were also stronger influenced by hierarchies and knowledge sources.
1. Introduction
There has been an increase in the production of quantified measures in most societies in the last century.1 The use of these measures can be observed in different human efforts, such as in companies,
administration of states, military works, scientific production, etc. (Porter 1995). There is a generalized consensus that these quantification efforts produce indicators useful to make coherent and enhanced human decisions. However, although considered a useful instrument to guide and improve decisions, indicators received comparatively less attention from researchers in understanding their relevance in decision-making. In policy contexts, a few studies revealed that they were ignored and limited.2 In innovation contexts, only a few works have provided evidences of their concrete use and
influence in decisions.3This paper reveals that, although indicators are described as instruments for
decision, their final influence in knowledge-intensive contexts is significantly dependent of the social context and the type of decision.
The paper addresses in a quantitative way the question on how knowledge-intensive groups involved in technology innovation make their decisions. It seeks to understand the possible discrepancy between the consensus about the usefulness of indicators, and the reality of their use and influence in a knowledge context. The work focuses on knowledge-intensive groups because they are the most prone to use quantified measures in their work. In fact, knowledge-intensive groups can use these measures more than other groups because, in their work, they have a facilitated access to knowledge, information and indicators. The paper studied the behaviour of knowledge-intensive groups that engaged in decisions related technology innovation, because these types of decisions were concrete, identifiable, knowledge-dependent and relevant from a socio-economic perspective. Three groups were analysed, namely: (1) a researchers group composed of public researchers, academics, and Research and Development (R&D) health personnel; (2) a business group composed by companies’ Research, Development and Innovation (R&D&I) personnel;4 and (3) policy makers related to
technology innovation. The research combined literature research, analysis of official documents, three questionnaires and interviews and is located in Portugal.
The work is divided in four parts: The first section discusses the influence of indicators under the context of technology innovation decisions. The second section describes the methodology used in the work, focusing in more detail on the construction of the samples. The third section presents
1See, for example, the prolific data-gathering work about the world economy of Angus Maddison (Maddison
2001; Maddison 2006).
2See Porter (1995); Gudmundsson and Sørensen (2012); C. Freeman (1995); Power (1997); Grupp and Schubert
(2010); Grupp and Mogee (2004).
3See Gudmundsson and Sørensen (2012); Fioramonti (2014); Boavida, Moniz, and Manuel Laranja (2013). 4In order to simplify the presentation of the data, researchers group will be briefly denominated as researchers,
quantitative results regarding whether indicators were used and the influence they had in technology decisions. It starts by distinguishing in a quantitative way the use from the real influence of indicators, analysing afterwards the influence of the social context and the type of technology decision. The last part discusses the conclusions presented in the former chapter, and elaborates on the next lines of research for this topic.
2. Technology innovation decisions and indicators
This part introduces the framework to study the presence of indicators in technology innovation contexts. After identifying the main knowledge gaps existent in the literature, it will be argued that the study needs to distinguish between the use from the real influence of indicators, to detect contextual influences and to identify the types of technology decision involved.
2.1 Decisions in innovation contexts
An innovation is commonly defined as a new idea, device or method. The result of an innovation is normally a technological product/service or the significant improvement of a product or a process. According to Utterback (1974), innovation is distinct from an invention or technical prototype, and refers to technology actually being used or applied for the first time. Innovation processes can be defined as a set of inventions and implementation of new ideas, which are developed by people, who engage in transactions with others over time within an institutional context, and who judge outcomes of their efforts and act accordingly (Van de Ven and Poole 1990). In addition, there are several types of innovations such as product, process, marketing and organization innovation. This work will focus only on technology innovations, which can include innovative products and processes. Technology innovation requires a previous technology decision easily identifiable determinant for its sucess, such as acquiring or developing products/technologies, buying intellectual property rights or designing innovation policies.
Decision making models are conceptual frameworks for understanding how decision makers process information and arrive at conclusions (Harren 1979). They can be defined as a simplified description of a psychological process in which one organizes information, deliberates among alternatives and makes a commitment to a course of action (Harren). Although there is not a model for technology decision, there is a significant number of different dimensions and models of general decision making in the scientific literature (see among others Scott and Bruce 1995; Hunt et al. 1989; Harren 1979; Swami 2013). Decision making is a multidisciplinary topic that spans across many disciplines such as philosophy, psychology, management, economics, engineering or mathematics, among others. It is therefore not surprising that most dimensions of the models are bounded to the fields/disciplines of research of the authors, such as health (Smith, Higgs, and Ellis 2008; Murray et al. 2007), education
(Galotti et al. 2006; Harren 1979), military (Thunholm 2004; Scott and Bruce 1995), psychology (Curseu and Schruijer 2012; Schwartz et al. 2002; Starcke and Brand 2012), economics (Simon 1959; Simon 1979; Menzel 2013), business (Jauch and Glueck 1988; Swami 2013; Schoemaker and Russo 1993; Sull and Eisenhardt 2012), etc.
Given the lack of a specific technology decision model, it is convenient to observe similar examples developed to frame decisions. In one example of an organizational study of decision making models with senior managers, Turpin and Marais (2004) described nine existing approaches to decision making: 1) rational, 2) bounded rationality, 3) incrementalist view, 4) organizational procedures view, 5) political view, 6) garbage-can model, 7) individual differences perspective, 8) naturalistic decision-making and 9) multiple perspective approach. Other studies were less abundant in the number of possible ways to decide. For example, in a military-oriented study Peter Thunholm (2004) reported on five decision making styles (independent not mutually exclusive): 1) rational, 2) intuitive, 3) dependent, 4) avoidant and 5) spontaneous.5 However, Thunholm supported the view that although the
rational and intuitive styles were unproblematic from a theoretical point of view, the intellectual foundations of the other styles were unclear. For example, his spontaneous style “might perhaps be viewed as a kind of high-speed intuitive decision making style” (934). Furthermore, the literature reveals that most models of decision propose, at least, a rational-analytic reasoning and an emotional-intuitive approach to explain the major considerations dominating the attention of an individual during the decision. Therefore, given the variety of approaches that can be considered in a decision model, there is a strong case to use a rational-analytic reasoning and an emotional-intuitive approach.
Several authors have argued, furthermore, about the existence of a third political-behavioural approach in the model in order to account for the impact of different stakeholders6 in the decision process (see
for example Linn, Man, and Bossink 2013; Jauch and Glueck 1988; Ilori and Irefin 1997; Dill 1975; Gray and Ariss 1985; Narayanan and Fahey 1982). According to Cray et al. (1991), political processes normally hidden are brought to the fore in strategic decisions that carry high stakes for those involved, affect the organizations in which decisions are taken and/or might have potential effects for large segments of society. To these authors the political aspect of decision making is very important, because a “bad” decision can be costly. In fact, an erroneous decision can cost a manager researcher or a politician his/her credibility, promotion, bonuses or even her/his job; backing a wrong alternative can cost a department/political faction its political future; and a serious error can accelerate the death of an organization, a department and even a political faction.
5The Swedish General Decision-making Style (GDMS) inventory was created based on a (Scott and Bruce 1995)
work, and validated with 1441 male military officers on career decision making and, later, with samples of students, engineers and technician on important decisions in general.
6The term stakeholders is here referred sensu lato as defined by Freeman and Reed (1983) which includes
In this work there is the need to find a decision model entailing three main requirements related to innovation. First, the model should be adequate to where most innovations occur: the business environment and the public research organizational setting. It has therefore to be coherent with the ways business innovators make decisions as well as public researchers. Second, innovation processes need to be analysed within a model that is compatible at all levels to the interactions between the three main actors: researchers, business innovators and in particular policy makers. The model should also be able to accommodate the way interactions between these actors occur at different levels: in the larger landscape context of socio-technical transitions, at the regime level where governments and policy makers play a decisive role, and at the firm level where individuals and organizations are determinant to innovation. Third and last, the model has to be able to encompass the strategic dimension of innovation to researchers (or inventors), firms, governments and society at large. According to Nutt and Wilson (2010), the term strategic decision making is often used to indicate important or key decisions made in organizations of all types. In this work the emphasis is on studying the decision making of a significant technology decision occurred in an innovation context. Technology innovation decisions are directly associated with new innovations, which emphasises the strategic nature of these decisions occurring in a firm or a research lab or an innovation policy.
Taking these aspects into consideration, it can be concluded that a possible suggestion of a model for technology decision would need to be based on strategic decision making and include not only a rational and emotional approach, but also a political one. In their strategic management studies, Jauch and Glueck (1988) framed three major decision making approaches rational, emotional and political. However, literature review suggests an adaptation to more specific labels for the styles that capture in detail these types of decision: 1) rational-analytical, 2) emotional-intuitive and 3) political-behavioural. The following figure captures the components of three possible strategic decision processes:
Source: Adaptation from Jauch and Glueck (1988:23) Figure 1 – Components of strategic decision making processes
The rational-analytical approach (1) to decision is based on the use of quantitative methods. The decision is the choice the actor makes in full awareness of all available and feasible alternatives, to maximize advantages (Jauch and Glueck 1988). In complex cases, it requires a close collaboration between the analysts and other potential users of the decision. It prescribes a rational, conscious, systematic and analytical approach.
According to Dean and Sharfman (1993), rationality is the extent to which the decision-making process reflects a desire to make the best decision possible under the circumstances. To these authors this intended rationality (or procedural rationality) is characterized by an attempt to collect the information necessary to form expectations about various alternatives, and the use of this information in the final decision. Therefore, it can be defined that rationality in strategic decision is the degree of involvement in collection of information relevant to the decision, and the reliance upon analysis of this information in making the choice. Furthermore, Kuhlmann, Shapira, and Smits (2010) supported the view that intended rationality will remain the innovation actors’ prevailing mode of guidance for learning and changing of perspectives. Indicators are instruments that can reveal the rational-analytical thinking dominating the individual’s attention during the decision.
Jauch and Glueck (1988) pointed out that there are three major criticisms to this theoretical approach: (a) the decision maker is not alone and is often a part of a multiparty decision situation; (b) decision makers are not rational enough, informed well enough or information can be too costly to consider all alternatives and consequences of the decision; and (c) decision makers have more goals than just the maximization of objectives. For example, they can be simply aiming to suffice their decision instead of finding the optimal solution. It should also be stressed that the objectives might change, which may also undermine the optimal solution.
The emotional-intuitive approach (2) in decision making is based on the habit or experience, gut feeling and instinct, and is guided by unconscious mental processes (Jauch and Glueck 1988). Many judgements are made by emotional-intuitive decision makers considering a number of alternatives and options. In fact, most decision makers prefer judgements that may lead to a better decision than analytical techniques. This is because judgments can include other factors or timings (not included in rational-analytical model) that lead to a better overall decision than simply holding what a quantitative model prescribes (Ilori and Irefin 1997).
This model has been criticised because: (a) it does not effectively use all tools available to decide; and (b) a rational model ensures that proper attention is given to consequences of decisions before significant mistakes are made (Jauch and Glueck 1988).7 Furthermore, (c) there is a lack of
scientific consensus to what intuition exactly means,8 which partially explains the option to name
7In this emotional-intuitive model, the use of indicators is rather limited because it is normally based on
qualitative methods.
8 Some researchers consider the scientific study of intuition impossible, seen as an esoteric phenomenon or just
this approach as emotional-intuitive rather than the authors’ intuitive-emotional. Other authors used only an emotional approach, which excludes an enriching part of the concept of intuition.9
The political-behavioural approach (3) in decision making highlights the pressure of different stakeholders and their impact in the decision process. Stakeholders during a decision can be suppliers, trade unions, owners, workers, government, other institutions (parliaments, committees, agencies, etc.), competitors, colleagues, experts, etc. The political-behavioural approach implies that there is a limited number of choices available, determined by the organization and institutional arrangements. In this approach decisions are made when several stakeholders agree that a solution was found, through adjustments and negotiations. This approach considers that the real decision makers must consider a variety of pressures from other people affected by their decisions and reflect whether the decision can be implemented politically (Narayanan and Fahey 1982; Ilori and Irefin 1997; Jauch and Glueck 1988). In fact, an organization has to interact with a variety of stakeholders holding different amounts of power that give an individual or an organization something and expects something in return. Naturally, the more power stakeholders have the more influence they will exert over decisions, because organizations are more dependent on them (Jauch and Glueck 1988). Therefore, decision makers meet stakeholders’ demands through political compromise, by mutual adjustments and merging competing demands to create a coalition of interests that will support the decision.
Decisions are made in a process of mutual influence that may involve actors with different, sometimes even opposing interests. In fact, strategic decisions are often made in a social process of interaction of different actors and groups of actors. In this train of thought, some authors stressed that, in reality, when decisions are made it is the product of social relations that matters, such as networking activities, different forms of social pressure, expression of values and norms, etc. According to Perri 6 (2002), decision makers use only a certain amount of knowledge when making a decision, and their judgments are rather dependent on where actors are socially situated and integrated. Perri supports the view that forces of social regulation and social integration exist and shape the individuals’ decisions. These forces can be used to explain how several social actors use information, behave and judge. The product of social relations acts upon individuals, both
on extensive learning from past experience, probably reflecting an automated expertise. In fact, the current technical conception of intuition implies that it arises from knowledge and experience. It also implies that intuition involves a form of information processing that might be more implicit than explicit, but which is not at all irrational.
9According to Emma Policastro (1999) intuition may be defined as a tacit form of knowledge that guides
decision making in a promising direction, which in the context of innovation leads to potentially creative results. Intuition is assumed to be especially important in tasks with high complexity, short time horizons, ill structured problems and involving moral evaluations (Linn, Man, and Bossink (2013). It involves the ability to quickly synthesize, integrate information and use of decision makers’ experience. To Policastro intuition seems to be most useful when there are high stakes, a high level of uncertainty, and pressure to make the right decision in a limited amount of time. In her perspective intuitions are not infallible, since they are like rough estimates, which necessarily entail some margin of error. In addition, research showed that there is not much knowledge about how intuition works, under which circumstances it may or may not be useful, or how to reduce its margin of error.
consciously and unconsciously, constraining and guiding them throughout their decision making. Therefore, the term social relations is here used broadly to refer to the multiple ways people are connected and influence one another (Hall and Lamont 2013). The term relates to all social activities that can influence a technology decision such as networking activities, hierarchical or peer pressures, marketing activities, values and norms, etc.
This approach has been criticized for implying that institutions play a real role in limiting the choices available to a decision maker. The approach implies that decision makers accept and recognize the power of stakeholders. However, decision makers might be pretending to negotiate, and will not accept mutual adjustments and real negotiations. Furthermore, the approach unrealistically implies that all decision makers previously considered whether the decision outcome might be implemented politically.
In figure 1 the possible interactions between the three different approaches are identified, since the three processes can occur in parallel. The rational-analytic and political-behavioural approaches can interact (4). In fact, a decision process can be simultaneously high/low in politics and high/low in rationality, because in some cases it can be rational to behave politically or political to behave rationally (Linn, Man, and Bossink 2013; Dean and Sharfman 1993). Furthermore, politics may frequently obstruct the flow of information, particularly at high-velocity environments where timely and accurate information is only shared amongst selected members of the group (Eisenhardt and Bourgeois 1988; Perri 6 2002). Therefore, political behaviour may hinder the rational assessment of a situation, since decision makers cannot consider the whole range of different alternatives (Linn, Man, and Bossink 2013). It is important to stress, however, that to the best of the available knowledge, the scientific literature does not provide sufficient empirical evidences regarding the other interrelations that can exist and are identified in figure 1. First, the depicted interaction (5) between rational-analytic and emotional-intuitive approaches is based on assumptions by researchers in the literature, who failed to provide rigorous empirical data, according to a review made by Linn, Man, and Bossink (2013). The interaction (6) between political behaviour and emotional-intuitive approaches are not known and according Linn, Man, and Bossink there are no empirical studies about this interrelation. Last, Linn, Man, and Bossink (2013) found that a process dominated by rationality and supported by intuition yield more effective political processes (7). However, the authors failed to back up their findings convincingly, which renders the interaction between the three approaches unconfirmed.
In sum, an analysis of the decision making literature reveals that most models of decision making propose at least a rational-analytic reasoning, and an emotional-intuitive approach to explain the main considerations dominating the attention of an individual during the decision. The proposed model to technology decision includes also a political-behavioural approach mostly because these decisions can also be understood as strategic decisions in innovation processes. The decision to use a predominant approach can be acknowledged through an inquire about the influence of indicators. With the
exception of the interaction between rational-analytic and political-behaviour approaches, the remaining interactions between approaches to decisions are not well understood.
2.2 The rise of indicators
An indicator can be defined as a numerical sign that shows what something is like or how a situation is changing. This specific sign of a phenomenon under study is commonly, though disputably,10 defined
within the boundaries of classic scientific disciplines, and assumed to be a scientifically objective measure beyond debate and a proxy of scientific knowledge. This work deals with indicators just as a quantified instruments available to help people decide about technology in innovation contexts, such as costs, technical characteristics, market share, R&D expenditures, carbon emissions, size of vehicles fleet, etc.
Indicators exist as a human effort to simplify the governance of the realm. They are inherently connected with the social need of quantification for public as well as for scientific purposes. Theodore Porter (1995, 74) argued that these quantification efforts were generally allied with the raise of the “spirit of rigor”. According to the author:
Strict quantification, through measurement, counting, and calculation, is among the most credible strategies for rendering nature or society objective. It has enjoyed widespread and growing authority in Europe and America for about two centuries. In natural science its reign began still earlier. It has also been strenuously opposed. This ideal of objectivity is a political as well as a scientific one. Objectivity means the rule of law, not of men. It implies the subordination of personal interests and prejudices to public standards. (Porter 1995, 75) The origins of indicators as modes of knowledge and governance can be traced back to the practices of business management at least since the fourteenth century, where quantification needs were crucial to conduct the Venetian trade with Cyprus (Maddison 2006). Later, the rise of the scientific mentality played an important role, since it included an insistence on objectivity, on the written word, on rigorous quantification, on transparency, etc. (Porter 1995). Furthermore, the creation of indicators is also associated with the need for governance, originated in the seventeenth century, when “the art of reasoning by figures on things relating to government” was called Political Arithmetic (Maddison 2001). After, indicators were used in connection with the raise of the modern nation-states in the beginning of the nineteenth century, and their need to govern objectively, impartially and transparently (Merry 2011). Most of the initial demands for indicators came from the need of engineers and technocrats enrolled in the development of an administrative culture in modern France, highly
10In fact, although commonly accepted, debates continue about the object measured by indicators such as
non-R&D innovation expenditure, SMEs introducing marketing/organisational innovations, innovative SMEs collaborating with others, etc.), as well as the nature of reality being measured. Furthermore, an indicator claims to objectivity has to be restrained to “knowledge produced in conformity with the prevailing standards of scientific practice as determined by the current judgements of the scientific community” in (Porter 1995, 216).
interested in management with considerable enthusiasm for the work on efficiency of Frederick Winslow Taylor, among others (Porter 1995).
In the 1930s a significant impulse to quantification was given with the growth of science in the USA and the culture of equidistance and impersonal objectivity in decision making. In America, important efforts of quantification were implemented with the systematic use of Intelligence Quotient11 tests to
classify students, opinion polls to quantify the public mood, elaborate statistical methodologies for licensing drugs, and even cost-benefit and risk analysis to assess public works (Porter 1995). Later in the 1950s, a significant stimulus was given to the need of objectivity and quantification with the US Corps of Engineers. The US Corps began concentrating their “failed engineers” in economic efforts around all district offices “where they were likely to do less harm” (186). At the same time, the US Corps began employing increasing numbers of economists and other social scientists that produced a takeover of economists and the emergence of cost-benefit analysis in modern economic studies. This type of analysis began with water projects and transport studies, but were later significantly disseminated with RAND’s12 military studies. Furthermore, Power (1997) and Porter (1995) suggested
that accountants and the rise of bureaucracy played also a significant role in the rise of quantification in most aspects of life, particularly during the twentieth century.
In the 1970s a "social movement of indicators" was born in reaction to the economic orientation of the above-mentioned quantification culture. These group of intellectuals, mostly social scientists, considered that the word “social” was restrictively defined and meant only “outside the realm of economics” (Sheldon and Parke 1975, 695). To them, science (or quantification) created a new sort of “philistines” encouraged by the relative ease of expressing quantities in dollars and, consequently, given an exaggerated importance in the interpretation of the realm (695). Therefore, these scientists argued for a change in conceptual frameworks, shifting the emphasis from economics to measures of social change, which included different subsystems in society like education, health, economics, etc. The arguments were centred on the controversy that resulted from an economic centred perspective, and mainly focused on what this new wave of indicators should measure.
The controversy eventually faded-out and the quantification rationale started to be applied to all parts of life, broadening its scope to almost every area of knowledge or human endeavour. Today, we can find this quantification rationale applied to global scales (Misuraca, Codagnone, and Rossel 2013; Maddison 2006) and even in our personal lives. For example, Robichaud, Durand, and Ouellet (2006) reported on the existence of indicators for personal quality of life, such as measures of verbal
11Intelligence Quotient, commonly known as IQ, is a score derived from standardized tests designed to assess
intelligence.
12According to Linstone (2008) the Rand Corporation is the most influential American think tank of the second
half of the 20th century. The company was established in 1946 to deal with useful applications labeled
“operations research”, which applied mathematics to problems such as interceptor vectoring and convoy protection. Presently, Rand is well accepted in decision making corridors of Washington, DC, and offers vast research and analysis to the U.S. armed forces. Rand is currently financed by the U.S. government and private foundations, corporations including the healthcare industry, universities and private individuals.
communication interaction, well-being, participation level in social activities or engagement in the community and integration in the community. This new quantification trend should not be interpreted as a conspiracy against the culture of qualitative reasoning, as some argued in social sciences circles. In fact, the production of an indicator reflects values that existed in society before their creation of moral, ethical, political, economic or financial nature. In fact, their significant expansion in recent years was based on an existent societal will, expressed for example by many influential organizations (e.g. OECD, ILO, UNDP, WHO, universities, etc.). Today, even a qualitative analysis of a large research question has to include an attempt to quantify as much as possible parts of the question. In fact, the present work aims to present quantified data on the influence of indicators in specific decisions, to complement further qualitative analysis.
2.3 Indicators in technology innovation decisions
As mentioned earlier, indicators have been introduced in social debates for a long time, embedded in a culture of objectivity. They are considered to be a useful instrument to guide and improve our collective and personal decisions. While indicators are ostensibly present in our collective rhetoric and apparently impact our day-to-day lives, comparatively fewer studies have been carried out addressing the relevance of indicators in management, research and policy, particularly in the context of innovation processes.
The extent to which indicators are used in decision making is largely unknown. Most literature aims to develop indicators, to analyze them or to evaluate them. Only a few authors have provided clues regarding the extent to which they are used to make a decision, and these qualitative studies were mostly restricted to policy making. In fact, Gudmundsson and Sørensen (2012) found evidences that indicators seem to play a very limited direct instrumental role in sustainable transport policy making. Furthermore, MacRae (1985) argued that the most frequent problem of indicators is their nonuse in policy making. The reasons for this disregard of indicators can be found in the lack of interest, information overload, lack of communication or even opposition to what is being measured .It seems, therefore, necessary to proceed in two directions: First, broaden the investigations to other areas of decision making to allow for comparisons with policy making. Second, determine the role of indicators in decision because no quantified information exists to provide an initial background for analysis. The study of indicators in technology innovation decisions will help characterize the social phenomena behind the technological innovation process. It will provide information about the main actors, indicators’ use and their real influence, the role of social context and the role the type of decisions have in the decision process.
2.3.1 Use and influence in the decision
There is the need to disentangle the use of indicators from their factual relevance in decision making, as suggested in the Gudmundsson and Sørensen (2012) study. In fact, determining the real influence of
indicators allows not only for an understanding of their importance in the decision process, but also to determine the dominant approach used in the decision. In turn, the investigation will provide clues on how knowledge is introduced in decisions and a deeper understanding of the social process of decision in technological innovation contexts.
Unfortunately, questions about the effective influence of indicators were seldom the object of research. The seminal work of Gudmundsson and Sørensen (2012) revealed that the use of indicators does not automatically mean influence on policies or processes in sustainable transport policy. In their study, indicators played a very limited direct instrumental role in the decision processes. Generalization is difficult, however, particularly because sectorial conditions might change significantly from transport policy to, for example, pharmaceutical policy where a significant amount of quantified data and objective information exists and is accessible. Therefore, there is also the need to broaden the scope of these sectorial and policy related findings to other decision making processes.
This work intends to contribute with findings providing evidences about the use and influence of indicators in the decision making process of knowledge-intensive innovation groups. It will be assumed that indicators are influential in technological innovation decisions of knowledge-intensive groups, because rationality-driven decisions are expected among those who participate in technology innovation without the least possible knowledge constraints.
The influence of indicators in policy contexts were categorized by Gudmundsson and Sørensen (2012) in four groups: instrumental, conceptual, process and symbolic. The authors considered first that an instrumental role of an indicator means that it had direct influence and was used directly as a tool to form a decision. Second, a conceptual role reveals that indicators contributed to shape knowledge or introduce new ideas, but were neither immediately used nor influential in decisions. Third, a process role means that an indicator used over time affects the way some aspect of policy making is conducted, regardless of what the indicator tells/reveals directly. Fourth and last, a symbolic role means that an indicator was used to justify decisions that have already been taken, or to give a rational appearance to the decisions. According to the authors, this role may still embody policy influence in terms of policy legitimacy or in terms of the balance of power.
However, these second and third categories present significant difficulties, probably because they were formulated to analyse a specific policy making case and not to examine technology innovation decisions. There are four main difficulties: First, there is significant difficulty in distinguishing conceptual from process role in two ways: (a) an indicator that contributes to shape knowledge or introduce new ideas (conceptual role), may also affect the way some aspects of how policy making is conducted (process role); (b) an indicator may be used over time (process role) and not used immediately nor be influential in decision (conceptual role). Second, a conceptual role probably does not exist in the practice of a technology decision maker. To her/him an indicator that contributed to
shape new knowledge and ideas produces inevitably changes the framework of decision,13 and consequently was influential in the decision. In other words, for a scientist, an engineer, a manager or a policy maker reflecting on the influence of an indicator in a technology decision, it is difficult to say that an indicator was not influential, if one admits it contributes to shape knowledge and introduce new ideas. Third, it is difficult to admit that an indicator influenced some aspect of the decision regardless of what it tells directly. Fourth and last, from the practical point of view, an indicator is an objective concept that is either present or not in a concrete technology decision. Indicators can hardly be a semi-part of a decision, through shaping knowledge or introducing new ideas used over time without being immediately used in a decision. Therefore, bearing these four difficulties in mind, it can be concluded that these two distinctions are not substantially interesting to technology innovation decisions.
In this work, only an instrumental role and a symbolic role will be used to understand the influence indicators have in technology decisions. It will only be considered that indicators can either play (1) an instrumental role, (2) a symbolic role and (3) no role at all in technology innovation decisions:
An instrumental role (1) means that indicators had direct influence and were used as a tool to make a technology decision. The instrumental influence of indicators in decision implies that a rational-analytical method was used, such as evidence-based analysis or operational research. In addition, this indicators’ role also suggests that a rational-analytical approach was applied solo or predominantly complemented with a political-behavioural or an emotional-intuitive approach. A symbolic role (2) means that indicators were used to justify decisions after they have been taken or to give a rational appearance to decisions. The symbolic role implies that no rational-analytic method was used predominantly to decide. This role shows that the predominant decision approach was political-behavioural, either solo or predominantly in interaction with a rational-analytic or an emotional-intuitive approach.
In this train of thought, it can be argued that quantification needs are mostly symbolic at policy level, where they can play a relative role. In fact, Perri 6 (2002) claimed that decision makers use a certain amount of knowledge when making a decision, and their judgments are dependent on where actors are socially situated and integrated. This view implies that the influence of indicators is determined by the social “cage” of the users, and that social relations act upon individuals constraining and guiding them both consciously and unconsciously in their decisions. However, the influence of these social relations can vary in different social groups, particularly in groups where the social “cage” can be less present, such as the researchers group. Therefore, to understand the role of indicators is necessary to inquire about the role of social relations in the decision.
Last, indicators played no role at all in the decisions (3) are associated to situations where information does not exist, is incomplete or ambiguous to be analysed, or even the consequences of the decisions are significantly unpredictable. These conditions have been associated to predominant emotional-intuitive approaches, such as judgements or gut feeling (Jauch and Glueck 1988). The absence of indicators also reveals a lack of rational-analytic tools14 or quantified measures in the
decision process. Therefore, the no role at all of indicators shows that an emotional-intuitive approach existed, either solo or in dominant interaction with a political-behavioural approach. It is important to consider that indicators used in technology decisions are very different from each other. The major difference can be found at the level of use in the innovation processes: First, policy makers make technology decisions that influence the innovation system mostly at the national level. For example, policy makers can use the indicator Business Enterprise Expenditure on R&D (million current PPP15$) to decide upon a policy to stimulate university-company R&D projects. Second,
business R&D&I personnel make technology decisions of a different sort. The type of indicators this group tends to use are mostly (but not only16) related with the market or company, because their
technology decisions tend to be connected to the development of new products or technologies. For example, their decision can use indicators related to innovation in a firm, such as the number of new products using their patented technology, or the costs of hiring a new researcher to develop a new technology. Third, (public) researchers, academics and R&D health personnel tend to make decisions also mostly at the product or technology level. For example, in a R&D project a researcher will focus on an indicator of the financial cost of a new DNA sequencer17 or microscope to enable her/his
research. Therefore, the type of indicators used to make technology decisions during innovation processes can vary significantly and is primarily related with the type of decision.
Within this diversity, however, linking indicators’ use to technology decisions can be useful for two reasons. First, indicators’ use, combined use or non-use detects their real influence in technology innovation decisions and uncovers other drivers or motivations such as the pressure of other groups. Second, the theoretical model previously suggested for technology decisions in innovation contexts can be tested by identifying the roles of indicators. An influential role of indicators in a decision reveals that a rational-analytic method was dominating the individual’s attention during the decision. A symbolic role of indicators (e.g. when social relations were considered more important than indicators) reveals that a political-behavioural method was dominating the decision. And an emotional
14(i) Rules of thumb - for example when the rule is if there is a 20% increase in profits we need to buy new
technology; (ii) Evidence-based analysis – for example when making cost-benefit analysis, weighting options, etc.; and (iii) Operations research – using mathematical models to explore quantified evidences. All three methods require some sort of quantification, which would mean having an indicator of something.
15 Purchasing Power Parities (national currency per dollar).
17 A Deoxyribonucleic acid (DNA) sequencer is a scientific instrument used to automate the DNA sequencing
process. A sequencer is used to automatically determine the order of the DNA’s four constituents: adenine, guanine, cytosine, and thymine.
approach was used when indicators were not used at all and social relations were not significantly relevant.
2.3.2 Types of technology innovation decisions
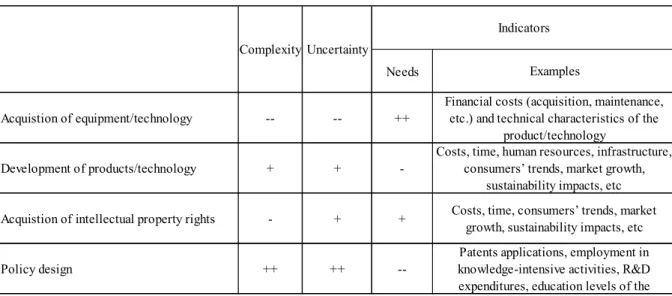
There are four types of technology decisions that can occur in innovation processes. In fact, in innovation contexts there can be, first, decisions about the acquisition of new equipment and/or technology. Second, innovations can also occur after decisions about the development of a new product and/or a technology. Third, innovations also can be the outcome of decisions about acquisition of intellectual property, which can involve buying patents, trademarks, industrial designs, geographical indications or copyrights. Fourth and last, there can be decisions about the design of policies which can produce effects in the innovation system and, consequently, in technology innovation.
Any decision is expected to contain elements of complexity and uncertainty. These two factors are central to technological innovation because: First, technological innovation is often associated with complexity18 (Chapman and Hyland 2004; Rycroft 2007; Waelbroeck 2003; Wonglimpiyarat 2005). In
the technology innovation context, complexity can be understood as components that integrated together cause difficulties in the transformation into successful products/processes (Wonglimpiyarat 2005). Complexity in innovation has been associated with experiences where information is incomplete, ambiguous and the consequences of actions are highly unpredictable (Aram and Noble 1999). In these contexts, complexity is contained in technologies, products, customer interfaces and organizational setups (Chapman and Hyland 2004). Second, technological innovation is also often associated with uncertainty (Böhle 2011; Jalonen and Lehtonen 2011; Fusari and Reati 2013; Meijer, Hekkert, and Koppenjan 2007; Dosi 1982; Nelson and Winter 1977; Carbonell and Rodríguez-Escudero 2009; Sainio, Ritala, and Hurmelinna-Laukkanen 2012). Uncertainty can be defined as the degree to which a number of alternatives are perceived with respect to the occurrence of an event and the relative probabilities of these alternatives (Rogers 2003). Innovation involves uncertainty in an essential way because “different people, and different organizations, will disagree as to where to place their R&D chips, and on when to make their bets” (Nelson and Winter 1977, 47). There are numerous types of uncertainty associated to the innovation processes although technological, market and regulatory uncertainties have an established status (Jalonen and Lehtonen 2011; Sainio, Ritala, and Hurmelinna-Laukkanen 2012).19 It can be concluded that uncertainty is a central element of the
technology innovation decisions.
18 According to the Oxford Dictionaries Online (2014) complexity means the state or quality of being intricate or
complicated.
19 But many more can be identified. For example, Carbonell and Rodríguez-Escudero (2009) considered only
two aspects of uncertainty: technology novelty and technological turbulence. In their study of innovation on biomass gasification projects in the Netherlands, Meijer, Hekkert, and Koppenjan (2007) reported that
Each type of decision presents different complexity and uncertainty levels. First, decisions about the acquisition of equipment/technology are less complex when compared with the three following types of decisions, because they involve primarily comparisons between products/technologies and immediate assessments of impacts in a technology innovation processes. Furthermore, the level of uncertainty associated with this type of decision is also rather low, since most buyers know what to expect from the acquisition of an equipment/technology. Second, decisions about the development of a product/technology are a complex when compared to the other types of technology innovation decisions (Chapman and Hyland 2004). They are often a complex strategic decision that require not only a decision about the product/technology that should be developed and why, but also knowledge on how to pursue with the development phase. Furthermore, this type of decision frequently involves a significant level of uncertainty mostly because there is no guarantee of success (Böhle 2011). In fact, a product or technology development occurs in contexts of changing circumstances that may render a technology less attractive or even obsolete, and where technological promises may never materialise (Kemp et al. 1998). Third, decisions about the acquisition of intellectual property rights are simpler and less uncertain when compared to the other three types of technology decisions. Although they may involve some strategic thinking, they are often based on the acquisition of knowledge about a workable solution to a problem, a product or a technology through an industrial patent, for example. Furthermore, the acquisition of propriety rights often carries less uncertainty than the development of a product/technology. In fact, the technological concept is already proven and accepted by patent offices, although the decision still carries the risks that a technology may become less attractive or obsolete and that the expectations may not materialize (Kemp et al. 1998), for example. Fourth and last, decisions about policy design are significantly complex and uncertain, because they involve concerns with the social and economic impact in a complex and uncertain target: the innovation system (see Smits, Merkerk, and Guston 2010; Kuhlmann, Shapira, and Smits 2010).
The use of indicators is negatively associated with complexity and uncertainty. Higher levels of complexity and uncertainty are expected to demand lower dependence on indicators. In fact, individuals facing the absence or ambiguous information tend to decide based on their experience, emotions and/or intuition rather than use rational-analytical approaches, as discussed earlier. Although uncertainty might motivate an individual to seek information, the “information about innovation is often sought from near-peers, especially information about their subjective evaluations of the innovation” (Rogers 2003, p.xix). To Rogers (2003), this information exchange about a new idea occurs through a convergence process involving interpersonal networks.
Each type of decisions requires different needs of indicators. First, decisions about acquisition of equipment/technology (comparatively low on complexity and uncertainty) are expected to involve considerations very dependent on specific indicators, such as financial costs (acquisition, maintenance,
technological, political and resource uncertainty are the most dominant sources of perceived uncertainty influencing entrepreneurial decision-making.
etc.) and technical characteristics of the product/technology. Second, decisions concerning the development of product/technology (comparatively high on complexity and uncertainty) are expected to be significantly independent from a broad type of indicators spread between costs, time, human resources, infrastructure, consumers’ trends, market growth, sustainability impacts, etc. Third, decisions about intellectual property (comparatively low on complexity and high on uncertainty) are expected to be independent from less indicators than the previous type of decision, such as costs, time, consumers’ trends, market growth, sustainability impacts, etc. Fourth, decisions related to policy design are expected to induce a significant independency from a broad range of indicators, such as patents applications, employment in knowledge-intensive activities, R&D expenditures, education levels of the workforce, etc.
The following table summarizes the relationship between types of technologies, complexity and uncertainty and use of indicators.
Table 1 – Relationship between types of technologies, complexity, uncertainty and use of indicators
Needs -- -- ++ + + -- + + ++ ++ --Policy design Complexity Uncertainty
Financial costs (acquisition, maintenance, etc.) and technical characteristics of the
product/technology
Costs, time, human resources, infrastructure, consumers’ trends, market growth,
sustainability impacts, etc Costs, time, consumers’ trends, market
growth, sustainability impacts, etc Patents applications, employment in knowledge-intensive activities, R&D expenditures, education levels of the
Examples Indicators
Acquistion of equipment/technology
Development of products/technology
Acquistion of intellectual property rights
Note: -- Very low; - Low; + High and ++ Very high.
The table reveals that the types of technology decisions are relevant to understand the role of indicators in technology innovation decisions. In fact, each type tends to require different needs for indicators. A decision about acquisition of equipment/technology is expected to have a very high need for a few indicators. A decision to develop of a product/technology suggests a low need from a broad type of indicators. A decision about the acquisition of intellectual property rights, however, may have a higher need of a reduced list of indicators than the previous one. And last, policy design suggests a very high need of a broad range of indicators.
In summary, there are four types of technology decisions that can occur in innovation processes: acquisition of new equipment and/or technology, development of a new product and/or a technology, acquisition of intellectual property, and policy design. Any decision is expected to contain different
elements of complexity and uncertainty. The use of indicators is negatively associated with complexity and uncertainty. Therefore, each type of decisions requires different needs of indicators.
To conclude, decision making processes are complex phenomena where several influences can occur. Decision processes depend not only of contextual influences but also from factors associated with the type of decision. A quantitative study of the role of indicators in decisions of technology innovation can help bridging the gap in knowledge about indicators’ presence in decision making. The work needs to distinguish between use from real influence, to detect other influences and to identify the types of technology decision involved.
3. Methodology
This research focuses on the initial technology decision which takes place after an idea occurs and the preliminary analysis of its benefits is carried out. This analysis can contain elements of political, knowledge or competitiveness reasoning, before a decision on how to proceed occurs. The focus on the initial decision can help understanding on how decisions are made in technology innovation processes. The term technology decision here relates to a decision related to technology made in the initial phase of an innovation processes, such as: (1) a decision to acquire equipment or a specific technology; (2) a decision to develop a product or a specific technology; (3) a decision to buy property rights; or (4) a decision related to the design of technology policies (programs, measures, actions, projects, etc.). These types of decisions can occur across all sectors, company or research centres sizes, levels in organizations, different cultures, etc.
The research undertaken in this work targets the three groups in an innovation system:
1. Researchers: a group composed of public researchers, academics, and R&D health personnel, hereafter named researchers;
2. Business Research, Development and Innovation (R&D&I) personnel: a group composed by team leaders of R&D&I departments in companies20, hereafter named business; and
3. Policy makers related to technology innovation: a group involved in technology decisions and the design of strategies that address the innovation system (Kuhlmann, Shapira, and Smits 2010). There are both common and specific reasons to target these three groups. The groups were commonly selected because: First, the groups are composed by individuals who (i) reported technology decisions recently (e.g. acquisition of equipment, development of products/technology, expenses for intellectual property or were involved in the design of innovation-related policies); (ii) have access to and use vast amounts of techno-scientific knowledge; (iii) normally have contact with indicators; and (iv) possess
20In order to simplify the presentation of the data, researchers group will be briefly denominated as researchers,
skills to deal with indicators. Second, the way these individuals use indicators captures the extent to which knowledge of facts were searched in order to decide. It also reveals to what extent this type of knowledge is applied in practical terms to make decisions. Therefore, research on the use of indicators in their decisions can contribute to the understanding of decision making and of knowledge management in innovation contexts. Third, these groups are closely linked with the innovation system and play important roles in its functioning. All of them deal with the production, management or dissemination of innovation. It is expected that this line of research could contribute to the understanding of interactions between technology innovation and society.
Furthermore, these three groups were individually targeted because:
1) Researchers can influence technology developments in different ways. First, they are involved in R&D projects that can lead to new technologies and innovations. Second, the group is involved with students before they reach decisive positions, and influence other researchers and other communities on possible technology options. Third, these individuals are frequently called to decide upon significant investments that influence directly or indirectly technology options, such as research programs and projects, setting up new laboratories, universities, hospitals, clinics and other specialized institutes, acquire powerful microscopes and diagnosis machines, etc. Fourth and last, this group informs and helps decision makers on technology choices. For example, they can assist in important public and private choices, such as the development of satellites, transport systems, other research-related facilities, the acquisition of submarines, supercomputers, helicopters and airplanes, the construction of highways, bridges and dams, etc.
2) Business R&D&I leaders are responsible for most choices regarding the development of new products or new technologies, and are frequently in charge of important strategic decisions inside the most innovative companies. In fact, they are most frequently found leading innovation departments of firms or in charge of R&D projects.
3) Policy makers related to technology innovation are involved in technology decisions and the design of strategies that address the innovation system (Kuhlmann, Shapira, and Smits 2010). Their policies can involve programs, projects, ideas, legislation and other regulatory frameworks that affect the development of technology innovations. These policy makers deal with policies and legislation designed, for example, to promote Science & Technology (S&T) graduates, support patenting efforts, backing export-oriented companies, etc.
Various methodologies were applied to ascertain the influence of indicators in technology innovation. As mentioned previously, the initial work combined literature research, analysis of official documents and (a) exploratory interviews. Afterwards, the work included (b) the design and deployment of three closed online questionnaires, which is the focus of the present work. The questionnaires were complemented with (c) seventeen semi-structured interviews. In addition, the work included (d) eight
in-depth interviews with experts conducted after the surveys (In this paper the interviews will be used only to contextualize quantified data). In closer details:
(a) The exploratory interviews were designed to prepare and calibrate the questionnaires and subsequent interviews. Twelve experts with sound knowledge and experience on the use of indicators and decision making were interviewed in Germany, Switzerland and Portugal, between October 2011 and January 2012.
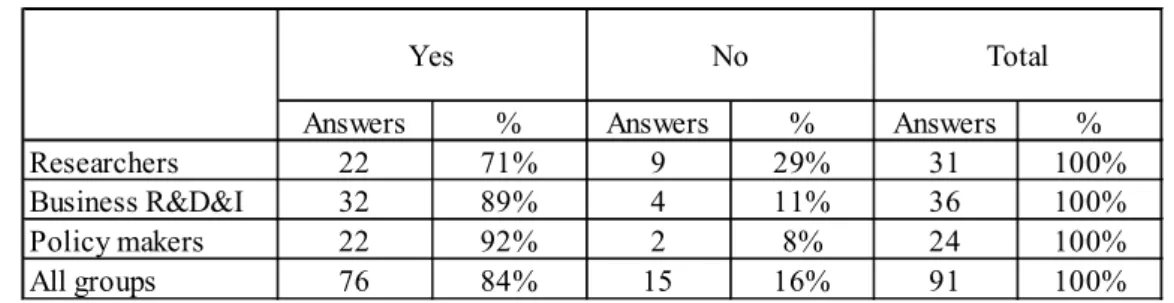
(b) The questionnaires addressed Portuguese representatives of the three groups under analysis, collecting ninety one valid answers from February 2012 to June 2013. The samples were composed only by individuals who were involved in consistent technology decisions and belonged to the mentioned groups. The samples were created using non-probability sampling methods (Saumure and Given 2008) in the following way:
- The business R&D&I and the researchers’ samples were selected using a purposive method - Criterion sampling (see Palys 2008) based on the 2010 National R&D Survey.21 The criteria
used required the existence of (1) scientific leaders of a R&D project in 2010 with significant expenditures in equipment (i.e. an expenditure with instruments, equipment or software equal or higher than 3000€ for researchers and 1500€ for business R&D&I personnel group), and to have (2) at least one PhD in the research team (Full-time equivalent). In this way, the criteria confirmed not only that a consistent technology decision was made in an concrete innovation context, but also that the research team had proper skills to conduct a sound R&D project. Therefore, the samples were significantly representative because they were only composed by scientists (or equivalents) who took a consistent technology decision in a reliable R&D environment. In this context, there were 57 leaders of R&D&I departments in companies in the National R&D Survey database, and 36 responses were received corresponding to a response rate of 63%.22 There were 78 researchers that met the criteria, and 31 responses were
received corresponding to a response rate of 40%.
- The sample of policy makers was created using snowball sampling (Morgan 2008), because there was no other sources to locate the members of this population and almost all members of knew each other. The initial set of research participants (serving as informants about potential participants) was significantly diverse, and was complemented with Google searches to avoid any possible bias. Two successive waves of snowballing assured a more representative sample (Schutt 2008). The final sample was composed by the vast majority of individuals directly
21The National R&D Survey (named IPCTN) is a reliable long-term survey that captures in detail data about any
existing R&D projects, researchers and companies involved in R&D in Portugal. The survey has also internationally comparable standards, is based on the Frascati Manual and is regularly checked by OECD, Eurostat and the National Institute of Statistics.
22The 2010 national R&D survey database detected 59 companies in the country that met the criteria. The
involved in innovation policy decisions in the period 2005-2011 in the country. The sample can be considered significantly representative, particularly given the reduced number of individuals involved in innovation policy at the time. In this context, there were 59 individuals listed as being involved in consistent technology decisions regarding innovation policy. Exactly 24 responses were received, which corresponds to a response rate of 41%.23
The response rates obtained for the three groups were considered significant for normal standards in social research, where they are traditionally lower (see Shih and Fan 2009; Baruch 1999). Furthermore, to account for effects on response rates (see Sauermann and Roach 2013; Fan and Yan 2010), there were three personalized email campaigns with three reminders each and personal contacts to sensitize individuals to answer, from February 2012 to mid-June 2013. The answers were not compulsory by law, there were no economic incentives to answer and the questionnaires were not part of the national statistical system. Only volunteers could reply to the questionnaires given the scientific nature of the surveys. In addition, the online answers did not allow establishing any relationship with specific individual technology decisions. Finally, the questionnaires were short (on average five minutes), identical (see bellow), with closed questions (with two exceptions for the policy makers group – see below) and always related to concrete technology options. The three questionnaires were similar. The difference between the questionnaires to researchers and business R&D&I group was small, and consisted in small adaptations of the text to the context of each innovation group. However, as mentioned before, there were two distinct features in the case of policy makers. These features were based on the need to assist in the assessment of the degree of use of indicators in the decision of policy makers. First, a pre-question was introduced to identify the position occupied during the technology policy decision. The options were Minister, Secretary of State, Political advisor to the Minister, Political advisor to the Secretary of State, Consultant; Director-General, Civil servant, Parliamentarian, City Mayor and Other position. Second, three questions were added to understand the level of knowledge about the indicators used in the policy decision: (i) “Please name the indicators used or recommended to make the decision”; (ii) “Did you use other type of information in the decision (e.g. studies, advices or sectorial information)?”; and (iii) “In case you used other type of information, please name indicators that were used”. All responses to the questionnaires were collected anonymously, with the exceptions of those that resulted from direct interviews. No significant differences were detected between online replies and direct answers.
(c) The twenty six semi-structured interviews were conducted to complement the data in the questionnaires. The majority of the interviews (13 interviews or 50%) targeted the policy makers, followed by researchers (7 interviews or 27%) and the business community (6 interviews or 23%).
23The two sampling technics allowed the identification of 65 policy makers but, after a significant number of
The emphasis on interviews to policy makers was justified by the sensitive nature of the information requested, and to avoid any suspicion of misuse of information. All interviews to the three groups were conducted using one guiding questionnaire, in a confidential way and lasted on average one hour. The use of the questionnaires as a tool to guide the interviews was a practical way to have similar answers across the three groups, to focus the interview on the critical questions, and to allow new questions arising during the conversation. In this paper the interviews will be used only to help contextualize quantified data.
(d) Last, the work also included four in-depth interviews to answer remaining questions with experts conducted after the surveys, during April 2012 to June 2013 in Portugal and Germany.
As mentioned previously, there were no records of quantitative research applied to the use and influence of indicators in the technology innovation literature. Therefore, research presented here focused on the quantification of the major characteristics of the use of influence of indicators by surveying only individuals directly involved in technology innovation. These efforts allowed the establishment of the initial background necessary to understand indicators’ reach (and rational-analytical decision making) in the context of technology innovation. Although beyond the scope of this paper, further qualitative research will complement the quantified results presented in the next section.
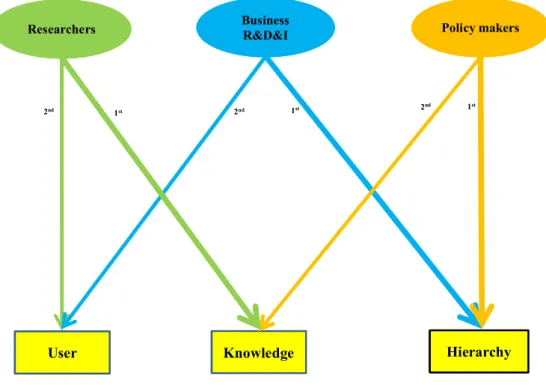
4. Results
This part presents results from a survey designed to understand the role of indicators in decisions of technology innovation. The quantification of their use and influence will establish the initial background of information necessary to understand indicators’ presence in technology innovation decisions. The work presented here constitutes a preliminary quantitative assessment necessary to further qualitative endeavours on the role of indicators in technology innovation decision. It will allow a deeper understanding of the extent to which indicators are present among those who can use indicators as freely as possible in technology innovation. It will also help understand the main type of thinking dominating the attention of these knowledge-intensive innovation groups during decisions. The following sub-chapters present results related to questions of the questionnaires above-mentioned. The first part addresses the use and influence of indicators in decision making, describing their presence in each group as an instrument of decision, and the weight or the real influence indicators have in the final decision. This distinction between the use and influence is relevant because it reveals the presence of indicators in the decision, and it shows their real contribution to the decision. After, it will allow categorizing indicators’ roles and it will help to detect the prominence of decision approaches. The second part refers to the context of the decision, by identifying the main external sources of influence in these decisions. As this question came first in the questionnaire than the