1
Social Impact Investing and its determining success
factors
Insights from a Social Impact Investor Perspective
Maastricht University
Faculty: School of Business and Economics Assignment: Master Thesis
Place, Date: Maastricht, December 19th, 2016
ID: 6031702
Study program: MSc International Business Specialization: Strategy and Innovation Supervisor: Dr. Wilko A. Letterie
Abstract
Creating social impact as a financial market has received some interest over the last few years. Yet, little academic research has been conducted to justify the excitement. This study aims to build on the current literature on social impact investment and explores the determining factors of success for investments. Instead of using the social enterprise point of view, as other studies before, it gives insights from the investor’s perspective. As investors forwardly are concerned about risk and return, the social impact creation and its influence on investment success is neglected in the study. For the empirical investigation, the paper uses a dataset of over 400 investment transactions made over the course of 2005 until 2013. In line with the hypothesis that a longer maturity could potentially hurt the investment success, the outcomes show that giving out investments for a longer period of time increases the return of investment while simultaneously increasing the change of capital write off.
Table of Contents
1 Introduction ... 1
2 Theory and hypotheses ... 3
2.1 Introduction to social impact investment ... 3
2.2 Theory of the determinants of social impact investment success ... 6
2.2.1 The learning curve ... 6
2.2.2 Investment characteristics ... 8
3 Data and methodology ... 10
3.1 Nature of research... 10
3.2 Data collection and sampling ... 10
3.2.1 Dependent variables ... 11
3.2.2 Independent variables ... 12
3.2.3 Control variables ... 13
3.3 Statistical Analysis ... 14
4 Analysis and results ... 15
4.1 Descriptive statistics ... 15
4.2. Regression ... 18
4.2.1 OLS regression of Return on Investment (ROI) ... 18
4.2.2 Logistic regression of no capital write off (SUCCESS) ... 19
5 Discussion ... 21
5.1 Return on Investment on social investments ... 21
5.2. Risk of social investments... 22
5.3 Practical Implications... 23
5.4 Limitations and future research ... 24
6 Conclusion ... 25
References ... 27
1
1 Introduction
“This is about moving profit-seeking capital into solving social problems,” “The shrinking state: should investors fill the gap?”
“UBS has become the first bank to make use of new UK tax reliefs for social impact investment that help to reduce poverty.”
- (Financial Times, 2015)
Those Financial Times headlines above talk about profit seeking in combination with solving social problems, they ask whether a socially shrinking state can be saved by investors, and they talk about tax reliefs for something called social impact investments. Those statements might have been illusionary a few years back but surround us more and more in recent times which makes it well worthwhile to take a closer look as to why profit, investors and a bank are suddenly related to terms such as social, impact and poverty reduction.
All around the world, financial markets are under public scrutiny. After the financial crisis and the exposed greed, the public demands to go beyond just profit. Grudgingly at first but with an increasing interest, the financial market pursues the integration of social factors into investment decisions1 (Daggers & Nicholls, 2016). Among those “beyond profit” fields is “Social Impact
Investment” (SII), a field that has its origins in the United Kingdom (UK) but has spread internationally after the UK hosted the Social Impact Investment Taskforce in the G8. The development of SII is further fueled by a common paradox that most of us will recognize. The public cries for social services to help overcome the consequences of a widening income gap. This goes hand in hand with the same population pressuring governments to cut spending to keep debt levels in check. This paradox trend helps to further grow the SII market (Hangl, 2014; Jackson, 2013; Nicholls & Tomkinson, 2013; Stoesz, 2014). Governments try to outsource social services to social enterprises, thereby cutting costs and, in the process, trying to satisfy their voters with lower debt levels and social service supply (Allen, 2009; Millar, 2012). Most social enterprises cannot finance themselves because they do not generate enough money to have access to the traditional financial market. Picking up on the financial needs of social enterprises, a formerly grudging financial market positions itself as social impact investor to supply the funds with new enthusiasm (Bugg-Levine & Emerson, 2011). SII comes with a new range of financial products sold to investors who then in turn give money to social enterprises that deliver social impact and promise financial return (Kingston &
1 The word “investment” is used to denote a financial transaction in this paper where the investee is expected
2 Bolton, 2004; Loder, Mulgan, Reeder, Aylott, & Shelupanov, 2011; Mulgan, Reeder, Aylott, & Bo'sher, 2010). However, in comparison to all the praise, the adoption process of SII proceeds only sluggishly. One reason for this is investors facing a lack of information on how to engage in SII successfully. Most conducted research analyzes SII from the point of view of the social enterprise and gives for example suggestions on how to become eligible to SII. To ensure a greater interest in SII from the investor’s side, risk and return profiles of social impact investments need to be studied further. Investors feel that they do not have enough experience judging a social enterprise business model or feel insecure with the characteristics of a SII transaction itself (Hebb, 2013). So far there has not been enough data available for a well rounded transaction decision. This increases uncertainty and drives costs of due diligence and transactions in general (Social Investment Research Council, 2015). The cost of capital for social ventures is, therefore, higher than for their for-profit counterparts in the “normal” financial market. The confidence of investors in the social impact investing market must be strengthened by developing a stronger understanding of SII to produce more financially successful transactions and, thereby, lowering the cost of capital for social enterprises. Therefore, the guiding research question is as follows:
Which factors influence the social investment transaction success?
This overall research question leads to the following sub-questions that this paper focuses on: (1) What is the influence of a learning curve on social investment transaction success?
(a) Does the number of social investment transactions carried out per year influence the successfulness?
(b) Are more recent social investment transactions more successful than the early ones? (2) How do transaction characteristics influence their success?
(a) How does the maturity of an investment influence its success?
(b) Does the credit total given out to the social enterprises influence the transaction success? Investors are still skeptical and suspicious of the investment readiness of social enterprises. Arguably, they do not qualify for any type of investment if they fail to attract mainstream capital. This paper helps in determining success factors for the SII market. To investigate the identified factors’ influence on social investment transactions, this paper first sheds light onto the definition of social investment and clarifies terminology. The development of the social investment market in the UK, main financial actors, their importance for social enterprises and financial market infrastructure are introduced. Further on, the paper draws upon theory of learning curve, agency theory and moral hazard to formulate hypotheses concerning the effect of recency, the number of transactions, transaction
3 maturity and credit total, respectively, on the success of social impact investment transactions. The paper then describes the data gathering process and explains the methods used in the empirical part. The data comes from both a published dataset and is complemented by further information that is researched individually. This lays the ground for section 4 which presents the outcomes of the statistical analysis. Based on this section, the paper then discusses the findings in depth, combining the theory with the statistically obtained knowledge. Practical implications are presented for investors, investees and policy makers to highlight how this study can help practitioners. Because it is the first time such evidence is invested empirically, a great emphasize is given to limitations of the study and towards directions for future research. A concluding section then summarizes the most intriguing findings of the study.
2 Theory and hypotheses
In the first part of this section, social impact investment is defined and its role for social enterprises in the UK. Especially because the market for financial investments is still underdeveloped and most concepts and financial products are still new, these sections are critical to the understanding of terms and reasoning used throughout the paper. In the second part of the section, a theoretical framework of factors is developed that are thought to influence the financial success of social impact investments.
2.1 Introduction to social impact investment
Giving a certain definition of SII, explaining investor behavior and analyzing SII infrastructure is a challenge as the boundaries of the field are blurry. This has several reasons including the recent emergence of the field, the lack of institutions, and the variation of application contexts. Stakeholders are geographically, culturally and economically dispersed, forming interest groups that independently from each other attempt to define boundaries. Furthermore, most literature is comprised of practice reports instead of academics where the focus does not lie on the definition of concepts and terms. So far, academic research focuses more on other “beyond profit” fields that the financial market discovered for itself such as social enterprise finance (Nicholls & Pharoah, 2008). Nevertheless, in recent years, a growing number of scholars shows interest in the field of SII (Höchstädter & Scheck, 2014) and Lyons and Kickul (2013) have openly called for more academics to enter the field in their article about the social enterprise financing landscape. Drawing on their findings, the paper introduces the terminology of SII, investor behavior, and SII infrastructure.
4 Terminology of social impact investment
A literature review of SII shows that there is no common and universal understanding of the terminology although several attempts seem to have been made (Daggers & Nicholls, 2016). For the purpose of this paper, SII is placed within the main field of “social finance”. This main field comprises a great variety of financial instruments that are given to social enterprises in order for them to create social and environmental impact. The financial instruments used within this main field range from grants and engaged philanthropy to social impact capital that can not only give market returns but potentially above-market returns. Included in this main field of “social finance” are other sub-fields such as crowdfunding or community finance. Although this paper places SII in this broader context, it is very important to distinguish it further as “social finance” does not always encompass the repayment of capital by investees (Bugg-Levine & Emerson, 2011). However, the term SII for this studies’ purpose refers to investees that aim at repaying the capital with the possibility of even a financial return (see appendix A for a differentiation between social impact finance and other types of finance). It is investment made to social enterprises that create social impact while still being financially responsible in their business model2. Other definitions of SII take on a greater investee and
social impact approach whereas the definition for this paper lays a focal point on investor deportment and stimulus.
Social Impact Investment Investors
Understanding the motivation of investors interested in SII and the challenges they face is important to lay the ground for tackling the current suspicion and reluctance to invest in SII. There are several SII players in the UK and primary investors that fund social impact investments include institutions and banks as well as pension funds, insurance companies or development finance institutions (Saltuk & El Idrissi, 2015). As far as the motivation of investors is concerned, an extensive survey conducted by GIIN and J.P. Morgan (2015) finds that over half of the social impact investors aim to generate competitive returns with their social impact investments. The remainder either wants to have a return that is below the market return and close to the market rate or wants a below market return close to capital preservation. Although “only” half of the 147 surveyed fund managers say they seek return, all of them want at least a preservation of capital and 82% want at least a return that is close to the market rate. The importance for investors to generate return on investment or at least recoup the investment adds to the explanation why they are cautious with SII. Impediments and challenges still shape the life of a social impact investor. Investors still regard the dearth of data as a main barrier and challenge for SII saying that “while a lot of interest, excitement, and talk suggest the
2 The definition used by the Global Impact Investing Network is: “Impact investments are investments made
into companies, organizations and funds with the intention to generate social and environmental impact alongside a financial return (The GIIN, 2016).
5 trend toward market rate returns on SSI, there is still a lack of returns data to prove the case” (Saltuk & El Idrissi, 2015). As far as uncertainties regarding the social business model of social enterprises are concerned, the study conducted by J.P. Morgan (2015) finds that investors rank this challenge as a lower concern in comparison to previous years. Apparently, investors are now more familiar with the social sector although it still remains a challenge. Another challenge is the principal agent theory that follows from the information asymmetry in the pursuit of the acknowledged objectives and both social and financial returns (Alemany & Scarlata, 2010; Evans, 2013; Achleitner et al, 2013). The investors must trust a small group of managers to thoroughly follow the agreed objectives. The challenges arising from the investor motivation, the dearth of data and the principal agent theory help to explain the skepticism of SII investors.
Social Impact Investment Infrastructure in the UK
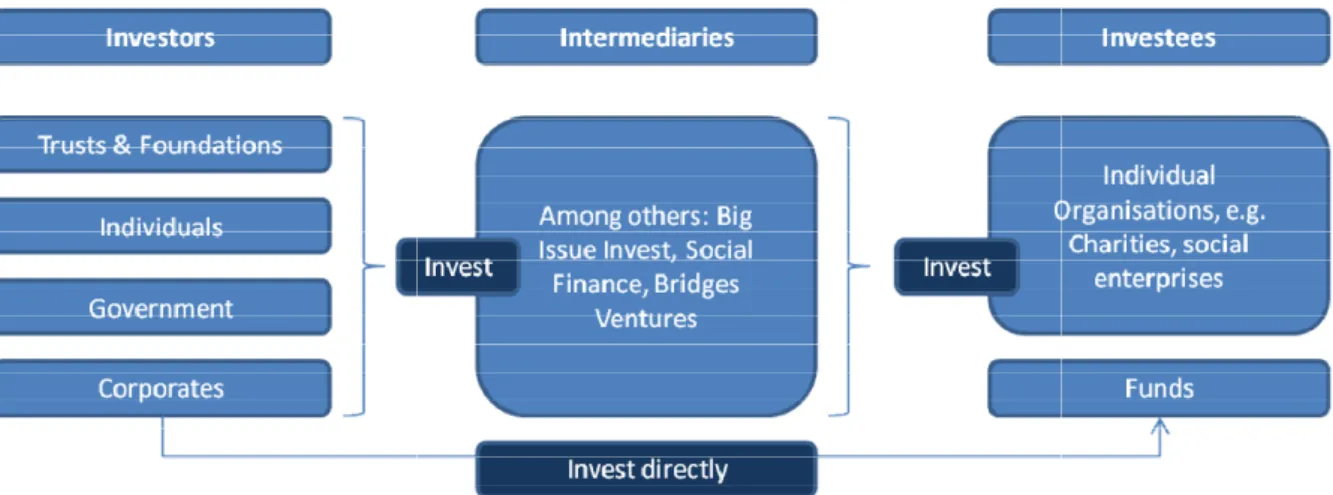
The infrastructure for SII in the UK is among the world’s best developed infrastructures but nevertheless struggles to grow to any comparable size of traditional financial market infrastructures. Financial markets need infrastructure to function and social impact investments are no exception to the rule. Financial infrastructure is understood as a system among participating parties used for “the purposes of clearing, settling, or recording payments, securities, derivatives, or other financial transactions” (Dudley, 2012). It should govern transparent arrangements, enforce safety and efficiency, soundly manage several types of risk, and provide a legal basis. Figure 1 shows a basic infrastructure containing investors that supply the money, intermediaries that offer investment support, and investees such as charities on the receiving end. The role of the intermediary includes also the creation of communication procedures and standards (Dudley, 2012). For this purpose, social stock exchanges (SSE), as part of intermediaries, are needed (Salamon, 2014; Daggers & Nicholls, 2016). The UK Social Stock Exchange was founded in 2013 and functions as an information provider. A current entry hurdle is that all participating companies must be simultaneously registered at the London Stock Exchange and need to pass a social impact test (Chhichhia, 2015). To qualify for other social stock exchanges, the main aim of an enterprise needs to be on creating impact whereas the UK SSE does not require the impact creation to be the core of the business. The UK SSE still does not provide actual trading which could provide a comparable information base about SII and enable the creation of market indices. Overall, investors still miss comparable valuations and exits, structure of SIIs and help with legal and technical due diligence (Gregory, Hill, Joy, & Keen, 2015). As such, there is still upward potential for SII infrastructure in the UK.
Figure 1: Infrastructure of the Social Impact Investment marke
After laying the theoretical background on social that could potentially influence the financial success of
2.2 Theory of the determinan
Although it is true that the term “
a role in choosing to invest in social enterprises, this paper focuses on the financial success of impact investment. It is assumed that the primary reason to invest
balanced relationship between risk and return
top of the equation. A SII can be deemed successful if th
written off. Simultaneously, SII success can be measured by the return on investment generated by the SII3. This study examines the factors influencing the financial success of social investments under
two different domains: (1) The learning curve, and (2) investment characteristics.
2.2.1 The learning curve
For each investment decision, a lengthy process of research and due diligence is necessary as well as the involvement of several parties including investors,
is particularly true for SII as the external environment is still underdeveloped and the internal environment at the investor’s sight is still far from standardized
Drawing upon the learning curve theory can help to explain why improvements in the external environment and improvements in the internal environment could influence the success of SII. The theory of learning curves, experience curves
of the same thing can mean to do it at a decreased cost. improved efficiency rate due to learning, some
3 For reasoning see section 2.1 subpart “
ructure of the Social Impact Investment market: own illustration
After laying the theoretical background on social impact investments, several factors are proposed that could potentially influence the financial success of SIIs.
2.2 Theory of the determinants of social impact investment success
the term “social investment” implies that impact and ethical morality do play a role in choosing to invest in social enterprises, this paper focuses on the financial success of
investment. It is assumed that the primary reason to invest in any kind of project
balanced relationship between risk and return with the social impact factor simply being a bonus on A SII can be deemed successful if the capital is repaid and does not need to be written off. Simultaneously, SII success can be measured by the return on investment generated by This study examines the factors influencing the financial success of social investments under
ent domains: (1) The learning curve, and (2) investment characteristics.
For each investment decision, a lengthy process of research and due diligence is necessary as well as the involvement of several parties including investors, investees, intermediaries and consultants. This is particularly true for SII as the external environment is still underdeveloped and the internal environment at the investor’s sight is still far from standardized (Gregory, Hill,
Drawing upon the learning curve theory can help to explain why improvements in the external environment and improvements in the internal environment could influence the success of SII.
experience curves or improvement curves describes how doing more can mean to do it at a decreased cost. While most scholars have looked at the improved efficiency rate due to learning, some papers have also investigated t
For reasoning see section 2.1 subpart “Social Impact Investment Investors”
6 investments, several factors are proposed
that impact and ethical morality do play a role in choosing to invest in social enterprises, this paper focuses on the financial success of social in any kind of project is still a well with the social impact factor simply being a bonus on e capital is repaid and does not need to be written off. Simultaneously, SII success can be measured by the return on investment generated by This study examines the factors influencing the financial success of social investments under
ent domains: (1) The learning curve, and (2) investment characteristics.
For each investment decision, a lengthy process of research and due diligence is necessary as well as investees, intermediaries and consultants. This is particularly true for SII as the external environment is still underdeveloped and the internal (Gregory, Hill, Joy, & Keen, 2015). Drawing upon the learning curve theory can help to explain why improvements in the external environment and improvements in the internal environment could influence the success of SII.
describes how doing more While most scholars have looked at the ve also investigated the influence of
7 learning behavior on quality of products and services and find a significant relationship (Levin, 2000). To the knowledge of the paper, no academic literature has so far applied the theory of learning curves to SII. The theory used to be applied to industries before the Second World War by Wright’s investigation of factors influencing airplane costs (1936) and has since been applied to a variety of other fields and academically explained (Huber, 1991; Loerch, 1999). Because there is no empirical study investigating factors that influence learning in SII, this paper draws upon factors that show to influence learning in other fields of application.
Several learning hot spots add to the learning experience with learning occurring at the external level in actors in the environment and at the internal level in individual employees and organizational systems (Argote, 1993). The actual improvement of efficiency and quality is a combined effect of the two environments. More in detail, there is a long list of factors that are thought to be connected to organizational learning. The focal firm learns through external factors in the external environment including the learnings by firms that are outside of the focal firm as for example its suppliers. The focal firm also learns through internal factors in the internal environment such as standardization of procedures, improvements in product characteristics, proficiency of individuals, and improvements in equipment (Wright, 1936; Hirsch, 1952; Wheel Wright, 1984; Joskow & Rose, 1985). In terms of social impact investments, this means that at the external environment level, the investors learning is influenced by factors outside of the bank or fund such as the stock exchanges or intermediaries. At the same time, the investor’s learning curve is influenced by internal factors such as standardization of procedures and due diligence examinations in dealing with SIIs. It can therefore be hypothesized that with more investment transactions occurring over time, the quality and cost of SII is improved for the investor.
Hypothesis 1a: A higher number of transactions per year will have a positive influence on the success of social investment transactions.
Scholars were also interested in the timing of organizational learning and when it would take place for the introduction of a new product. It is argued that the learning curve is really rather a function of time rather than just the cumulative experience (Zangwill & Kantor, 1998; Levin, 2000). However, there are also studies that find there to be no connection between calendar time and learning as soon as cumulative experience is added to the model (Lieberman, 1987). It is also shown that the rate of learning is higher as soon as the service or product is used more extensively while the learning that occurs during a planning phase is slower (Tyre & Orlikowsk, 1994). As SII is a rather recent phenomenon, this paper argues that this finding could be transferred to social impact investments. Translated to SII, this finding would mean that learning during the earlier years of SII occurred more
8 slower than the learning in later years. If learning can influence the quality and cost of an investment transaction, it can therefore be hypothesized that:
Hypothesis 1b: A later transaction period year will have a positive influence on the success of social investment transactions.
2.2.2 Investment characteristics
As with the development of each new investment vehicle, different characteristics need to be tested to arrive at the ideal structure (Alemany & Scarlata, 2010). For SIIs, the ideal structure has yet to be found (Chhichhia, 2015). Especially because of the difficult social impact measurements that need to be added to the risk and return relationship to price the investment, this has been difficult for SIIs. For the purpose of the paper, this special investment characteristic is disregarded because a focus is put on the normal risk and return perspective of investors. Other investment characteristics that need potential adjustment include the maturity of the investment and the total amount of the investment. Both characteristics are discussed respectively.
Social enterprises have a bad reputation with investors and most that are asked position them as unstable and risky organizations that constantly fight bankruptcy (Rumbold, 2014). Positive examples such as the London Early Years Foundation show that this is not true. They survived for a century and can report a trading income of more than 10 million British Pounds (Blakeborough, 2012). Research has also confirmed that social enterprises are not more likely to file for bankruptcy than their private sector counterparts. Nevertheless, social enterprises do fail for several external and internal reasons. For the scope of the paper, one external reason is particularly important as it has an influence on the investor’s side. Social enterprises are very dependent on the legal framework within a country (Brandstetter & Lehner, 2015). This framework, however, is subject to constant change. The framework can change from being favorable for social enterprises (e.g. tax relieves) to suddenly becoming unfavorable. This is beyond the control of the social enterprise but can happen quickly with a simple change in government policy. Some countries only classify between charity and for-profit but the UK momentarily has a legal structure in place that supports the social enterprise hybrid model that connects social impact and for-profit constructs (Gregory, Hill, Joy, & Keen, 2015). This support structure cannot be taken for granted and the social enterprise is always at the risk to lose the favorable status. This challenge is an indicator to have shorter investment maturities instead of long ones because of the increasing uncertainties in the far future.
Another reasoning adding to this proposition concerns the social enterprise’s culture and the relationship between investor and investee. Few social enterprises and even less charities are used
9 to think in “generating-profit terms” (Lyons & Kickul, 2013). The prediction of a business model over a long time period is more challenging for any organization but even more so for social ones as they are more inexperienced with the action. Given the possible external changes and the difficulty to make a long-term prediction on the business model success of a social enterprise, this can impact the successfulness of SII investment from the investor point of view. Furthermore, the investor and investee relationship can give an additional argument towards a shorter maturity because of the principal agent theory. Although there is no initial asymmetry of information between the investor and the investee, as soon as the investment is made, the control of the investor over what is exactly done with the investment lessens. This information asymmetry strengthens with a longer maturity of investment (Bergemann & Hege, 1998). The investments given out to social enterprises can be distinguished by their different maturity terms and because of the increasing uncertainty with a longer time horizon as well as the increase in agency costs, it can by hypothesized that:
Hypothesis 2: A longer maturity of social impact investments, has a negative influence on the success of a social investment transaction.
Another characteristic of SIIs that might still need adjustment is the credit or investment total given to the social enterprise. The short track record of closed investment transactions leaves investors wondering and sometimes widely speculating as to what investment characteristics might influence the success of SIIs (Achleitner et al, 2013). Because SIIs are still quite new, some investors fear to lose too much money by investing a large sum in the social enterprise. They, furthermore, think that tempting a social enterprise with a high investment might make them more prone to moral hazard than traditional investees. They base this suspicion on the fact that the social enterprise has only limited options to secure financial means and might overestimate their business model to secure an investment deal out of desperateness (Bergemann & Hege, 1998; Stoesz, 2014). Also, because of the earlier mentioned asymmetry of information and the, therefore unobservable allocation of the investment, the investee could “shirk” and hide parts of the investment by diverting it to other causes within the enterprise (Bergemann & Hege, 1998). This, in turn, can hurt the successfulness of an investment. It is therefore hypothesized that:
Hypothesis 3: The credit total has a negative influence on the success of a social investment transaction.
After developing factors that theoretically should determine the success of a social investment transaction and hypothesizing the direction of the relationship, this paper introduces the data and method utilized to test the hypotheses.
10
3 Data and methodology
This section of the paper is concerned with the nature of research and the data collection process. It also discusses and defines the dependent, independent and control variables. Hereafter, the statistical analysis is briefly introduced.
3.1 Nature of research
As the topic of social impact investment has come up only recently, most practice reports and academic articles make use of exploratory and qualitative techniques. Most conduct expert interviews or case studies to infer knowledge about social investments. The paper builds on an existing body of qualitative studies on the investment readiness of social enterprises and the willingness of financial providers to invest in social enterprises (Mulgan, Reeder, Aylott, & Bo'sher, 2010). In contrast, however, the developed hypotheses in this paper can be tested empirically and the gathered dataset as well as the quantifiable variables allow the paper to use a quantitative approach. It must be considered, however, that due to the recency of the topic, the paper does not build upon tested empirical measurements. It is, therefore, still exploratory in nature as the defined measures have not been tested in the field of social impact investment transactions. This paper might be able to contribute to the methodological growth within the field of social investments from the investor’s point of view.
3.2 Data collection and sampling
Data on individual transactions in the social investment market is difficult to obtain as it is normally not publicized data. Furthermore, to draw conclusions about the overall social investment market a sufficiently large dataset must be obtained. This means that data from several players must be gathered and combined. In the UK alone, there are about 30 different Social Investment Financial Intermediaries (SIFIs) and there is no standardized form or framework on what data to collect or in which format the data should be. This paper gathers data on the financial risk and returns of social investment transactions published by EngagedX. Founded in 2012, EngagedX’s mission is to enable mainstream capital to be used in a way that brings positive outcomes for all. EngagedX brought together independent and anonymized data of a key segment in the UK social investment market from 2002 until 2014. CAF Venturesome, Key Fund and Social Investment Business cooperated to collect the data while the Boston Consulting Group assisted with an external validation of the data. To the knowledge of the author, there has been no published academic study so far that utilizes this data. It offers, among other variables, information on the investment principal (amount actually invested), the return (yield and capital appreciation), maturity (duration to redemption / exit), and
11 risk (actual write offs and defaults). Hereby, the focus is solely on financial return and purposely neglects the social impact created. Transactions gathered for the dataset were picked from the very risky edge of the market including investments to the so called “unbankables” of the market. The sample encompasses only performance of UK transactions.
The unit of analysis of the study is at an individual transaction level whereas each transaction contains one or more draw down transactions. The transactions include equity and debt investments ranging from £2,400 to £2.7m with some of the loans backed against a fixed asset, debenture or guarantee. The sample frame includes all transactions that were already completed by the time of the analysis. Of 1041 collected transactions, 426 closed ones are selected. Open transactions needed to be excluded because they cannot offer information on the risk and return relationship, namely the success of the social investment. Although the dataset includes a data range from 2002 until 2014, the years of 2002-2004 were excluded as they could potentially introduce bias. The three primary years only contained 7 transactions in total and can be regarded as a pilot-test phase of social investing where risk and return patterns where still try and error. 2014 only included one transaction as all others have not been completed and has, therefore, been removed as well. This leaves the sample with 417 transactions between 2005 and 2013 to analyze.
Information on control variables is gathered from a variety of online sources such as the worldbank and Eurostat. As the transactions are anonymized, each of the added variables is matched with the year of the transaction. The exact source for the respective variable is mentioned with the description of the variables.
For the analysis, the sample is not further randomized but a non-randomization sampling method is chosen, namely consecutive sampling. This method pursues to hold all accessible subjects as part of the sample. With regards to non-random sample methods, this sampling technique can be considered as favorable because it contains all data points that are available that makes the sample more indicative of the population (Field, 2009). Since the investment transactions are anonymizeda subjective selection bias is very unlikely.
3.2.1 Dependent variables
The success of a social impact investment is normally measured in its risk and return profile together with the created social impact. Because of the focus of this paper, this is neglected. To measure success, the effect of several variables onto both capital write off (risk) and return on investment as the two dependent variables are investigated.
12 Capital Write Off. The variable Capital Write Off catches the risk of an investment. For each transaction in social investments it is important for the intermediary, or financial provider, to recoup the investment and avoid write-offs. A transaction can be claimed successful to the provider if it is able to have no capital write off. Whether capital is written-off is captured by the dataset for each transaction. The goal is to clearly distinguish between a success and a failure. Therefore, the financial transactions are clustered into two groups, namely transactions that did not experience any write off and transactions that experience either partial write off or full write off. This dummy variable is named SUCCESS in the SPSS data output and has assigned a 1 for transactions that do not experience write off and 0 for transactions that experience any kind of write off. This makes unsuccessfulness, having to write off capital, the baseline of the model. It should be noted that the successfulness could also be captured by the amount of capital written off, so a ratio variable. As the aim is to investigate in one of the hypotheses whether a higher credit total affects success, taking the total of write off would bias the statistic towards assuming higher write offs for higher credit totals automatically.
Return on Investment. In accordance with literature and practitioners, another part of a successful social investment transaction that is not captured by capital write off is the return on investment (Saltuk & El Idrissi, 2015). The return on investment is dubbed ROI in SPSS and is a continuous variable. Return on investment is measured in percentages with a high percentage being more successful and favorable for the investor in comparison to a low percentage.
3.2.2 Independent variables
Credit Total. It is hypothesized that the amount of investment, the credit total, has an influence on the success of the investment. For each social investment transaction, the credit total invested into the social enterprise is published. As the data only concerns transactions from the UK market, all entries are made in British Pounds. The variable is dubbed CREDTOT in SPSS. The descriptive statistics in table 2 (see section 4) show that the distribution of credit total is highly skewed. To normalize the distribution a long transformation is used. As the long transformation does not work for zeros, the dataset was searched for any unfit transaction. There was no credit total of zero discovered so that no value of 1 had to be added to each transaction. The new variable is displayed as lnCEDTOT in the output.
Number of Transactions per year. The number of transactions per year is bound to have an effect on the successfulness of social investments. This refers to the internal learning process. The gain of experiences and knowledge of the financial intermediaries in dealing with social enterprises, their needs and business models should lead to less write offs. They are better equipped to judge what
13 social enterprise is investment ready. The number of transactions per year is dubbed NUMBTRAN in SPSS and is a continuous variable.
Maturity. The maturity of the investment is likely to influence the success of a social investment negatively. The data set offers the duration of the investment transactions measured in between the date of the first draw and the last cash flow event. Maturity is dubbed MATURI in SPSS outputs. The unit used is moths and it is counted as a continuous variable.
Number of transactions per period. The point of time in which the transaction happened is bound to impact the successfulness of the social investment. With the hypothesis that external learning will have occurred and better social investment infrastructure is in place, the time series is divided into two groups, early years and later years. The early years reach from 2005-2009 and the later years from 2010 until 2013. This categorical dummy variable takes 0 for the early years and 1 for the later years from 2010 until 2013. This variable is dubbed TRANSPERIOD in SPSS and is a categorical variable.
Year 2005 2006 2007 2008 2009 2010 2011 2012 2013
# Transactions 47 24 21 49 56 58 89 52 21
Table 1: Number of transactions per early and later years. Source: own illustration
3.2.3 Control variables
Count of social enterprises. The count of social enterprises is likely to influence the success of social investments. With more social enterprises, more social investment transactions are demanded to provide enough money for each enterprise (Karanikolos, et al., 2013). Therefore, controlling for the count of social enterprises in the UK over the time span of the data set is necessary. The required information is not published in the data set used to examine social investment transactions. As social enterprises do not underlie a closed definition, the paper made sure to use the same source for each year of social enterprise count. The regularly conducted “Social Enterprise Market Trend Survey” by the UK government uses the “very good fit definition” for social enterprises for all years and offers the required information. This variable is dubbed SOCIENT in the SPSS outputs.
Count of Social Investment Financial Intermediaries. Social Investment Financial Intermediaries (SIFIs), dubbed SIFIS in SPSS, actively invest in social enterprises and charities. Over the years, this count has seen some advancement. Because a higher number of intermediaries influences the available social investment infrastructure and adds to the learning effect of existent intermediaries, this variable needs to be controlled for. The research report “Growing the Social Investment Market: The Landscape and Economic Impact” by Big Society Capital in cooperation with BMG Research sheds light onto the count of intermediaries in the UK over the applicable time frame.
14 British Interest Rate (BoE). The British interest rate influences the rate at which intermediaries and banks are willing to give money to investees. The required rate of return, so one part of the success formula for desired social investments, can also depend on this rate. Therefore, the variable, dubbed BOE in SPSS, must be controlled. The British interest rate is decided by the Bank’s monetary policy committee and is each month voted upon (Bank of England, 2016). The Bank of England publishes the rates for all years since 1694 and the applicable time frame was used for the coming analysis. As there were sometimes up to four different interest rates within one year, an average of the rates within one year was taken to match it to the dataset.
Persistent Poverty Count UK. To live in poverty means living off a salary that is below 60% of the national median. This threshold is commonly used by both the EU and the UK (Office for National Statistics, 2016). The Office for National Statistics and Eurostat publish the UK average persistent and overall poverty rates for the respective years as a percentage of total population. For the purpose of the analysis, the rate of persistent poverty is used. To convert this percentage to a total count, a population size of 64 million (World Bank, 2016) is assumed. For the purpose of this paper, the count of persistent poverty is thought to negatively influence the success of social investment. A higher count of poverty goes along with an overall difficult state of economy, thus, increasing the chance of investment write offs (Karanikolos, et al., 2013). This variable is dubbed POVRATE in SPSS.
For a summary of the SPSS coding of variables see Appendix B.
3.3 Statistical Analysis
Having the different types of dependent variables to test, ROI as a continuous variable and SUCCESS as a categorical variable, two different statistical techniques are required to conduct a statistical analysis. For the continuous variable ROI, ordinary least square regression (OLS) is applied. Because the variable SUCCESS is categorical in nature and a dummy variable, logistic regression (logit) is used to conduct the statistical analysis. For both models, hierarchical regression is used which allows to add variables in different stages to the models. For each step, the explanatory power added to the model can be observed. Also, with the control variables entered in the first step, the different effects of control variables and the variables this paper is interested in are distinguished. For an easier comparison of the two models, OLS and logistic regression, the order of the variables entered was kept the same in both analyses.
15
4 Analysis and results
In the analysis and results section, first the descriptive statistics are presented which are then used to evaluate statistical assumptions for the OLS regression and the logistic regression. With these assumptions sufficiently satisfied, both regression models are run with SPSS and the outcomes are depicted.
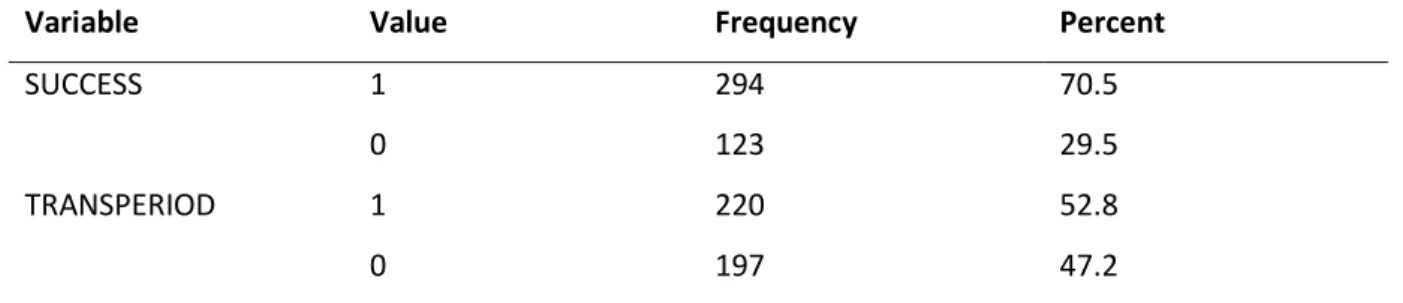
4.1 Descriptive statistics
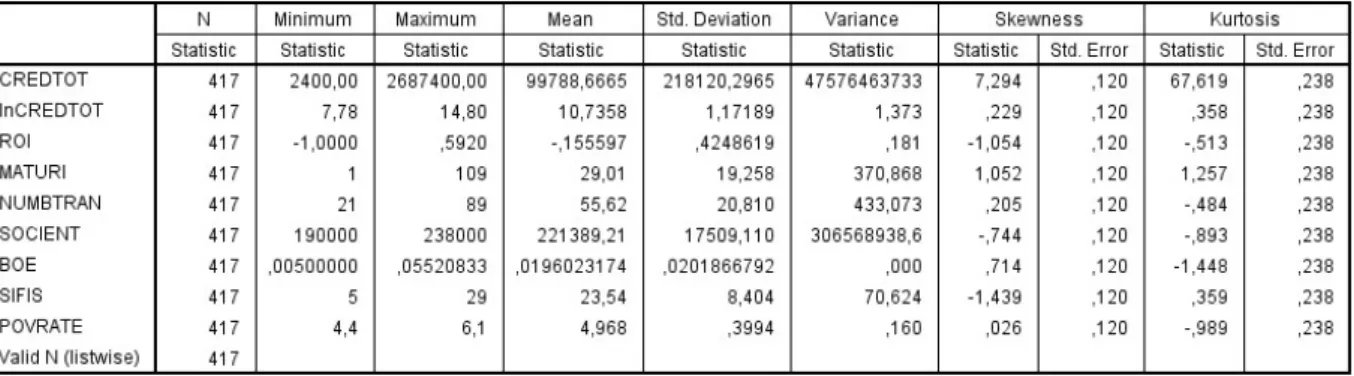
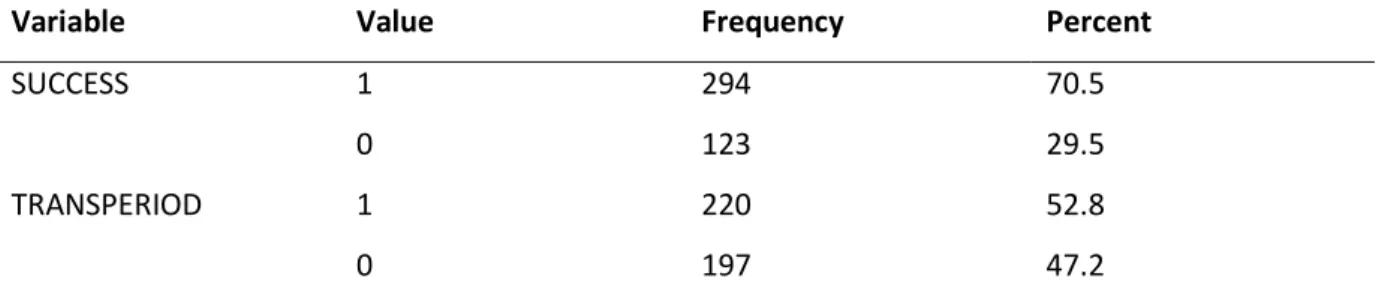
Table 2 and table 3 show the outcomes of the descriptive statistics analysis in SPSS. Table 2 portrays the analysis for the continuous variables whereas table 3 highlights the statistics for the categorical variables SUCCESS and TRANSPERIOD. In total, the sample contains 417 transactions with a mean of 99.788 £ in total credit given out by the financial providers. The highest transaction documented is over 2687400 £ and occurred in year 2011 with a maturity of 37 months until repayment. Already interesting to see is the negative return on investment (ROI) of a mean of -0.15. Negative 15% of return on the social investments made with of course a minimum of -100% which occurs for investments that experience a full write-off and are not repaid at all by the investee. It is, however, hopeful to see that a maximum return on investment of 0.592 was achieved. Overall, the mean repayment maturity lies at about 29 months although the longest maturity took 109 months which was then fully written off.
Table 2: Descriptive statistics of the continuous variables
Because the descriptive statistics table 2 shows high skewness and kurtosis values for CREDTOT, the variable was log transformed to lnCREDTOT. With a high skewness value, the distribution of the variable is clustered at low values whereas a high kurtosis value can be interpreted as having variables that are rather clustered in the middle without having extremes (Field, 2009). The log transformation described in section 3 is therefore justified.
16
Variable Value Frequency Percent
SUCCESS 1 0 294 123 70.5 29.5 TRANSPERIOD 1 0 220 197 52.8 47.2
Table 3: Descriptive statistics of the categorical variables
This paper would like to test the determinants for a successful social transaction with two different variables for success, one being continuous (ROI) and one being categorical (SUCCESS). Per operational definition, OLS regression and a logit model are used to test both variables. For each model, the statistical assumptions must be checked. OLS regression needs to be tested for normality, linearity and homoscedasticity while both models need to be checked for multicollinearity and outliers (Palllant, 2011).
Multicollinearity. Table 4 presents the correlation matrix among the tested variables. The fields highlighted with an asterisk contain values that require statistical attention. There is a strong correlation between ROI and SUCCESS which can be disregarded as both variables are tested in different models and not used together. As they are both supposed to measure the overall successfulness of an investment it is a good sign they are correlated. For the remaining variables showing significant correlations, it needs to be checked whether they pose a threat to the planned analysis. To check for multicollinearity, the variance inflation factor (VIF) and tolerance can be used as proxies (Field, 2009). Tolerance values that fall below 0.1 and VIF values above ten signal for a problem with multicollinearity (Palllant, 2011). Except for the variable SOCIENT, all values and VIFs are well apart from the designated threshold (Appendix E).
Table 4: Correlation statistics
S U C C E S S ln C R E D T O T R O I M A T U R I N U M B T R A N T R A N S P E R IO D S O C IE N T B O E S IF IS P O V R A T E SUCCESS 1 lnCREDTOT .030 1 ROI ,878** .044 1 MATURI -.075 ,290** .090 1 NUMBTRAN -.053 -.089 -.088 -,150** 1 TRANSPERIOD -.022 -,298** -.066 -,415** ,507** 1 SOCIENT .004 -,225** -.058 -,377** ,660** ,745** 1 BOE -.020 ,242** .033 ,355** -,561** -,765** -,897** 1 SIFIS .038 -,191** -.039 -,359** ,493** ,654** ,890** -,772** 1 POVRATE -.032 .036 -.018 ,104* -,656** -,481** -,364** ,406** -,212** 1
**. Correlation is significant at the 0.01 level (2-tailed). *. Correlation is significant at the 0.05 level (2-tailed).
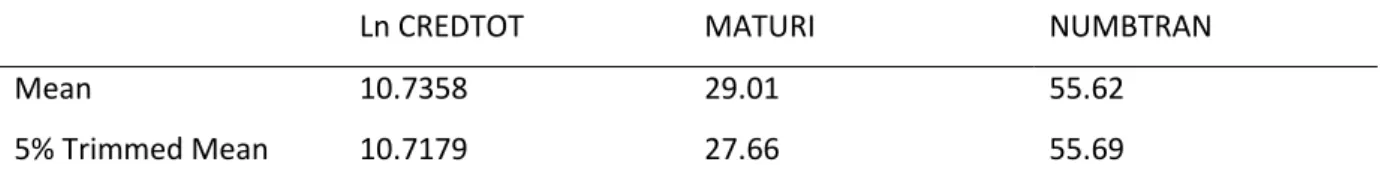
17 Outliers. According to Pallant (2011), the creation of boxplots can help identify significant outliers that differ from the other data points within the sample. SPSS identifies outliers when they are more than 1.5 box-lengths from the box. In case outliers are identified, their bias inducing influence on the analysis can be further checked with a comparison of their means against their trimmed means. For this sample, lnCREDTOT, MATURI and NUMBTRAN contain identified outliers. For further evaluation of a potential threat of bias, the means of the variables were compared with their trimmed means. SPSS showed:
Ln CREDTOT MATURI NUMBTRAN
Mean 10.7358 29.01 55.62
5% Trimmed Mean 10.7179 27.66 55.69
Tabel 5: Trimmed mean check
The 5% trimmed mean is calculated by removing to top and bottom 5% of values. Since both the mean and the trimmed mean are very close in all three variables, the cases were not removed from the sample.
Normality. The normality assumption must hold for the OLS regression analysis and can be visually assessed by looking at the histogram and the normal probability plot (Palllant, 2011). The histogram and the normal probability plot in appendix C both suggest a fairly normal distribution. For a histogram, a bell-shaped curve is ideal, whereas, with the normal probability plot, a straight diagonal is desirable. Although the plot in appendix C shows some bumps along the diagonal between the observed residuals on the x-axis and the expected residuals on the y-axis, the general picture is still of a normally distributed data.
Linearity and Homoscedasticity. Appendix D shows the scatterplot testing the assumption of linearity. It plots the standardized residuals against the regression standardized predicted values. For this purpose, new variables needed to be created in SPSS. The linearity assumption is fulfilled if the values plot around the line without forming a curve. This assumption holds for the tested data so that it is safe to assume linearity. This also defies any suspicion of heteroscedasticity which would be a potential threat in case the variability in the regression standardized values increased or decreased with the predicted values (Wooldridge, 2009).
From the checked assumption, the paper is now able to perform both statistical tests, namely the OLS regression and the logistic regression.
18
4.2. Regression
This section first illustrates the outcomes of the OLS regression testing the return on investment for social investments. Then, the findings for the riskiness of social investments are presented by the means of the logistic regression.
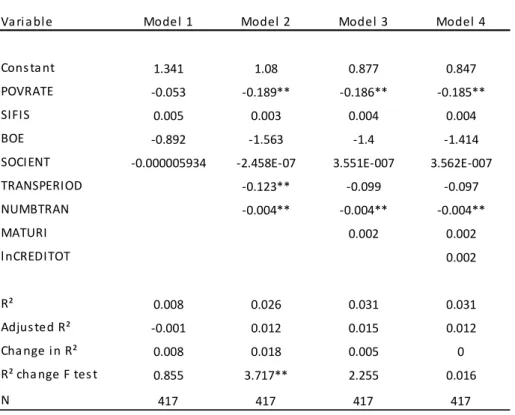
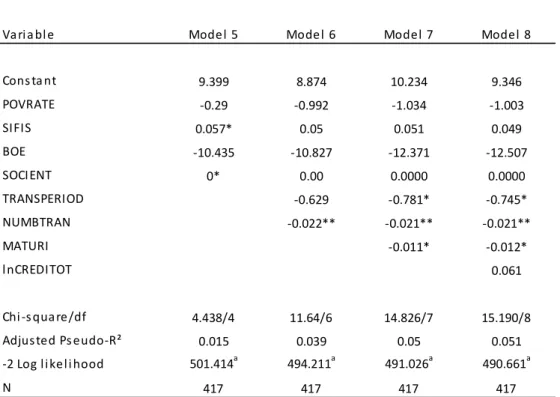
4.2.1 OLS regression of Return on Investment (ROI)
Table 6 and appendix E present the results of the ordinary least square regression analysis of return on investment. Model 1 includes only the control variables. They have been entered into SPSS first as they are expected to explain some of the underlying variation but are not supposed to explain away the entire association. Adding one unit of POVRATE, so the number of people living below the poverty line, decreases the return on investment rate by 5%. Although this finding is not significant, it does fit to the reasoning of adding the number of people living in poverty to the control variables as it decreases successfulness of social investment. Also, the variable becomes significant in Model 2-4 with the same relationship direction on return on investment. Apart from POVRATE becoming significant in later models, neither of the control variables has a significant effect on return on investment in Model 1-4 at the 0.01. 0.05 or 0.1 significance level.
Model 2 tests the hypotheses 1a and 1b with adding TRANSPERIOD and NUMTRAN to the model. Both variables bear a significant influence on return on investment at the 10% and 5% level (respectively) of significance. However, though being significant, both variables have coefficients opposite of the hypothesized direction. TRANSPERIOD is a dummy variable with early periods (year 2005-2009) as a baseline. With one added unit of transactions per later periods (2010-2013), the return on investment rate decreases by 0.123. Also, adding one unit of transaction per year decreases the rate of return. This time, the effect is not as drastic as the return only decreases by 0.004. Therefore, hypotheses 1a and 1b are not supported. Overall, the variables only capture 1.2% of the underlying variation within the data (adjusted R²: 0.012). The change in R², however, is significant at the 10% level and thereby adds value to the overall power of the model.
The effects of investment characteristics, namely maturity and investment total on return on investment are analyzed in Model 3 and 4 respectively. Adding maturity in months in model 3 only very slightly improves the models adjusted R² from 0.012 to 0.015 which is not significant. Although the variable shows the hypothesized direction, with one unit of added maturity showing an increase in return on investment of 0.002, the influence is not of significance. Adding the investment total (lnCREDITOT) in Model 4 actually decreases the adjusted R² and shows an extremely high p-value of 0.898. There is clearly no evidence for hypothesis 2 and 3.
19
Table 6: OLS regression of return on investment
4.2.2 Logistic regression of no capital write off (SUCCESS)
Table 7 and appendix F present the results of the logistic regression analyzing the effect of several variables on the likelihood of capital write off in social investment coded SUCCESS. To improve comparability between both models, the variables have been entered in the same sequence as with OLS regression. Equally as model 1, model 5 includes only control variables. With a logistic regression, R² or adjusted R² do not exist to demonstrate the explanatory power of the model. As R² fits a line through the data points and measures the squared residuals between the fitted line and the data entries, this is impossible to do with a categorical variable (as there is only 0 and 1). To, nevertheless, judge the power of the model, Nagelkerke adjusted pseudo R-squared is used. It was decided to use this proxy instead of the, by SPSS suggested, Cox & Snell's pseudo R-squared. In contrast to Cox & Snell, Nagelkerke’s pseudo R-squared can reach up to 1 and is better to compare with the normal R² used in the other model. The explanatory power of Model 5 lies at 1.5% which is a better fit than Model 1. The number of SIFIs in the market is significantly positive related to the success of social investments. This supports the hypothesized direction of the control variable and adds power to the argument to include it as a control.
Dependent Variable: ROI
Variable Model 1 Model 2 Model 3 Model 4
Constant 1.341 1.08 0.877 0.847
POVRATE -0.053 -0.189** -0.186** -0.185**
SIFIS 0.005 0.003 0.004 0.004
BOE -0.892 -1.563 -1.4 -1.414
SOCIENT -0.000005934 -2.458E-07 3.551E-007 3.562E-007
TRANSPERIOD -0.123** -0.099 -0.097 NUMBTRAN -0.004** -0.004** -0.004** MATURI 0.002 0.002 lnCREDITOT 0.002 R² 0.008 0.026 0.031 0.031 Adjusted R² -0.001 0.012 0.015 0.012 Change in R² 0.008 0.018 0.005 0 R² change F test 0.855 3.717** 2.255 0.016 N 417 417 417 417
Note: Unstandardized coefficients are reported
***= significant at the 0.01 level; **= significant at the 0.05 level; *= significant at the 0.1 level
20 Model 6 and 7 test the hypotheses 1a and 1b, adding both the transactions per period (early period versus later period) and the transactions per year. Increasing the unit of transactions per year is significantly negative related to the successfulness of social investments. Both variables, again, show a direction that goes against the hypothesized one. Adding the variables increases the Nagelkerke adjusted pseudo R-Squared which indicates an explanatory power of 3.9%. Looking at the -2 Log likelihood, however, raises some doubt. In general, Log-likelihood values cannot be used individually as an index of fit as they are a function of sample size. However, they work well to compare the fit of different coefficients (Field, 2009). In the data output at hand, the Log likelihood decreases from Model 5 to Model 6 which is a sign of a weaker fit of variables.
Model 7 and 8 which tests the influence of investment characteristics by adding maturity and credit total, show the highest explanatory power in terms of pseudo R-squared (5.1%) in Model 8. Maturity has a significant, negative relationship with write off likelihood meaning that an added unit of maturity decreases the chance of fully recovering the investment. This is significant at the 10% level and supports hypothesis 2. Again, the variable credit total is not significant and has a very high p-value, showing its insignificance and failing to support hypothesis 3.
Table 7: Logistic regression of having no write off on investment Dependent Variable: SUCCESS
Variable Model 5 Model 6 Model 7 Model 8
Constant 9.399 8.874 10.234 9.346 POVRATE -0.29 -0.992 -1.034 -1.003 SIFIS 0.057* 0.05 0.051 0.049 BOE -10.435 -10.827 -12.371 -12.507 SOCIENT 0* 0.00 0.0000 0.0000 TRANSPERIOD -0.629 -0.781* -0.745* NUMBTRAN -0.022** -0.021** -0.021** MATURI -0.011* -0.012* lnCREDITOT 0.061 Chi-square/df 4.438/4 11.64/6 14.826/7 15.190/8 Adjusted Pseudo-R² 0.015 0.039 0.05 0.051 -2 Log likelihood 501.414a 494.211a 491.026a 490.661a N 417 417 417 417
a. Estimation terminated at iteration number 5 because parameter estimates changed by less than .001
***= significant at the 0.01 level; **= significant at the 0.05 level; *= significant at the 0.1 level
21 The findings of the two models are discussed in the next section.
5 Discussion
The discussion session reflects upon the statistical outcomes from section 4 and matches them to the hypotheses that were developed in section 2. The findings are then discussed together with the literature reasoning. After the discussion, the paper acknowledges its limitations and points towards future fields of research and practical implications to further advance the topic of SII.
5.1 Return on Investment on social investments
Model 1 of the regression shows the influence of control variables on the return on investment. None of them is significant but run into the expected direction. Nevertheless, including the variables did not seem to have shown any alternative explanation factors influencing the return on investment. Therefore, they could be excluded from the model in future research. Based on the theory of the learning curve, the paper hypothesized that both a higher number of transactions per year and an investment at a later point in time positively influence the success of investments. Although model 2 shows a significant influence for both variables on the return of investment, the hypotheses 1a and 1b are both refuted. The hypotheses expected a positive relationship but the model shows the opposite. For 1a, with every added transaction per year, the return on the investment decreases. Looking at table 1 again from section 3, it can be seen that most transactions occurred in both years after the financial crisis. Because interest rates were rather low after the financial crisis occurred and about 4% higher before 2009, this could explain the found relationship direction in the two variables (Bank of England, 2016).
Year 2005 2006 2007 2008 2009 2010 2011 2012 2013
# Transactions 47 24 21 49 56 58 89 52 21
Table 1: Number of transactions per early and later years. Source: own illustration
For hypothesis 1b, the theory of having more learning occurring in later years (Tyre & Orlikowsk, 1994) cannot be supported from the model. This could be because SIIs have taken a long time to come from a first plan to the first implementation. Having the years 2005-2009 defined as early years could exactly be the phase in which a high utilization was reached and most learning took place. That the return on investment is then found to be lower in later years could be again due to the aftermaths of the financial crisis. The claim of Liebermann (1987) that there is no connection between learning and calendar time, however, cannot be supported, as both variables are significant. Overall, the explanatory power of the model improved from adding both variables although the explained variation is still very low. Model 3 adds the maturity variable into the model. Hypothesis 2
22 claims that a longer maturity has a negative influence on the success of a social investment transaction. This draws upon the political landscape’s influence on uncertainty, the social enterprise’s culture and principal agent theory. The variable is not significant and indicates the opposite relation as compared to the hypothesis. With each month of maturity, the return on investment increases. This, however, does support the hypothesis because it means that the investment becomes riskier with longer maturity. Although there is only a change of 0.2% in return on investment given for each added month and there is no statistical significance at the 10% level, the p-value, however, is at 0.13. This is still enough to expect some truth between the introduced theory in connection with SIIs. Future research should try to rebuild the model using a different data set to investigate this. In model 4, the investment amount was added to the model. It was hypothesized that there would be a negative influence on the success of the investment which cannot be supported. This shows that the investors’ concern about running into the risk of moral hazard by offering “too much” investment to the social enterprise is not supported by evidence. The high p-value of almost 0.9 and the lowered adjusted R² in comparison to model 3 provides the indication that this variable has no influence on the success of the investment.
5.2. Risk of social investments
In model 5-8, the factors discussed before where tested on their influence on investment success, this time measured by capital write off vs. no capital write off. Looking at the descriptive statistics in table 2 again, it should be highlighted that only 29.5% of the investigated investments did experience partial or full write off. To put this into perspective, the figure is compared to the experiences of the Enterprise Guarantee Scheme, a scheme founded by the UK government to support SMEs in the UK. They show a very similar write off rate and are somewhat comparable to social impact investing (Social Investment Research Council, 2015). Therefore, investing in social enterprises is not riskier than investing in other SMEs. The Social Investment Research Council (2015), however, points out that the expected return for SIIs is lower than would normally be expected with mainstream
Variable Value Frequency Percent
SUCCESS 1 0 294 123 70.5 29.5 TRANSPERIOD 1 0 220 197 52.8 47.2
Table 2: Descriptive statistics of categorical variable
investment products. In the logistic regression, model 5 shows that the added control variables have significant effects on the likelihood of investment write off. Having more social financial
23 intermediaries does indeed increase the chance of having no investment write off and, therefore, supports the expected direction. Also, although not significant, the influence of the British interest rate goes in the expected direction which makes intuitive sense. With a higher base interest rate, investors are likely to charge a higher price for giving out money so the cost of capital increases again for the social venture (Achleitner et al, 2013; Bank of England, 2016). This increases the chance of capital write off. Model 6 includes the added variables that draw upon the learning theory. Here, again both hypotheses 1a and 1b are refuted. The number of transactions per year is a significant variable but points into the opposite direction of the hypothesized one. With each number of transaction added, the chance of having no capital write off decreases. The same explanation as given in section 5.2.1 can be used to explain the phenomenon. Adding the variables does add explanatory power to the model just as before in the OLS regression. Adding the variable maturity in the next step of the model gives significant support to hypothesis 2. It does seem to be the case that a longer maturity investment has a lower chance of being fully recovered and increases the expected return on investment as it becomes more risky. This supports the theory that there seems to be a connection between at least one of the suggested explaining theories. To investigate whether the unstable policy framework, the social enterprise culture or the principal agent theory explain the observed phenomenon best, future research could conduct a separate in-depth analysis of the connection between maturity length and investment success. The logistic regression, furthermore, supports the findings of the OLS regression concerning the investment total. There seems to be no connection between the success of a SII and investment total whatsoever, refuting hypothesis 3 and the moral hazard suspicion of investors.
5.3 Practical Implications
This paper offers some important implications for social impact investors, investees and policy makers which are explained in the following.
The purpose of this paper is to help investors to overcome prejudices against social impact investing and understand more about the risk and return profile. By investigating success factors for investments, the overall quality of the investments can be enhanced. It offers the notion that investment success does not only depend on the investors themselves but also on external factors such as the market infrastructure. Furthermore, investors may understand that a learning process taking place internally will potentially help to make investments more successful. As far as the characteristics of the investments are concerned, it should be noted by investors that a longer maturity has a slight negative effect on the likeliness of success. By rejecting hypothesis 3, the
long-24 standing rumor of saying that social impact investment totals should not be too high in order to avoid moral hazard problems can be contradicted.
Another group that can draw practical implications from this study is the social enterprise group. This paper adds to the understanding of investor motives and tries to show what they are looking for in an investment. Having a better understanding of investors can help make investees more investment ready. They are better able to prepare for investment negotiations and can meet the worries and expectations of investors before the investment deal might fail. Also, because there seems to be no relation between the total sum of the investment and success, social enterprises have a stronger argument to press for the investment sum that is required.
For policy makers, this paper offers some information on their role in facilitating the relationship between investors and investees. Providing a secured legal framework around social enterprises to help them through difficult financing phases decreases the uncertainty for investor decision making. Important is that this legal framework needs to be protected from the sometimes unstable political environment that tends to change every 4 years.
5.4 Limitations and future research
The overall academic literature on SIIs is scarce and literature on the perspective of the social impact investor is barely existent. Success factors of SIIs have not been researched before from the investor perspective and this paper is a first attempt to fill this gap. Also, it is the, or one of the first studies to empirically investigate the risk and return relationship of social impact investments. So far, only case studies and survey methods have been used to shed light onto this field. It is, however, in the interest of the market, to test the developed frameworks with gathered data that is slowly becoming more available. This study has a variety of limitations and can point to effective future research areas. First of all, the decision making process that social impact investors go through should be thoroughly analyzed to develop a better understanding of the different touch points that add challenges (Dudley, 2012). With a developed framework, it can be ensured to consider all possible influencing variables throughout the process. As there was no academically developed investment decision making process for SIIs, this paper may have overlooked a great deal of potential factors that influence success of investments.
Following the scope of this paper, an important and complex part of the social impact investment success formula has been disregarded. Social impact needs to be measured and priced accordingly by the investors (Höchstädter & Scheck, 2014). As there had not been a comprehensive method to price social impact into the risk and return formula by the time of this paper, maybe future research will be