Mestre em Genética Molecular Comparativa e Tecnológica
Peptidome and Proteome Peritoneal Dialysate
Evolutionary Atlas (P3DEVOATLAS)
Dissertação para obtenção do Grau de Doutor em Química
Orientador: Doutor Hugo Miguel Baptista Carreira dos Santos,
Investigador Auxiliar, Faculdade de Ciências e Tecnologia, Caparica Universidade NOVA de Lisboa, Portugal
Coorientadores: Doutor Janne Lehtiö, Professor e Diretor Científico, Science for Life Laboratory, Karolinska Institutet, Suécia
Doutor Carlos Lodeiro Espiño, Professor Associado com Agregação, Faculdade de Ciências e Tecnologia, Caparica
Universidade NOVA de Lisboa, Portugal
Júri:
Presidente: Doutora Ana Aguiar-Ricardo
Arguente: Doutor José Luís Gómez-Ariza
Arguente: Doutora Deborah Penque
Vogais: Doutor Hugo Miguel Santos
Doutor José Luís Capelo-Martínez
iii
Mestre em Genética Molecular Comparativa e Tecnológica
Peptidome and Proteome Peritoneal Dialysate
Evolutionary Atlas (P3DEVOATLAS)
Dissertação para obtenção do Grau de Doutor em Química
This thesis was supported by the Foundation for Science and Technology, with the fellowship, reference number SFRH/BD/109201/2015 and by the
ProteoMass Scientific Society and Lehtiö Lab
v
Peptidome and Proteome Peritoneal Dialysate Evolutionary Atlas (P3DEVOATLAS)
Copyright © José Eduardo Ferreira Araújo, Faculdade de Ciências e Tecnologia, Universidade
Nova de Lisboa.
A Faculdade de Ciências e Tecnologia e a Universidade Nova de Lisboa têm o direito, perpétuo
e sem limites geográficos, de arquivar e publicar esta dissertação através de exemplares
impressos reproduzidos em papel ou de forma digital, ou por qualquer outro meio conhecido
ou que venha a ser inventado, e de a divulgar através de repositórios científicos e de admitir a
sua cópia e distribuição com objetivos educacionais ou de investigação, não comerciais, desde
que seja dado crédito ao autor e editor.
vii
ACKNOWLEDGEMENTS
No decorrer da realização deste trabalho, inúmeras pessoas e instituições intervieram, através da colaboração, disponibilidade, apoio e ensinamentos, quer diretamente como indiretamente. A todas essas pessoas presto os meus sinceros agradecimentos.
Ao Doutor Hugo Miguel Baptista Carreira dos Santos, pela orientação, pela sua disponibilidade e apoio laboratorial sempre que necessário e ensinamentos transmitidos no decorrer deste projeto.
Ao Professor Doutor Janne Lehtiö, pela coorientação, voto de confiança em aceitar como seu orientando, revisão crítica deste trabalho que contribuiu para um maior rigor científico e apoio financeiro no âmbito do trabalho desenvolvido no seu grupo de investigação.
Ao Professor Doutor Carlos Lodeiro Espiño, pela coorientação, conselhos dados e disponibilidade sempre que necessária, boa disposição e o apoio financeiro no âmbito do projeto.
Ao Professor Doutor José Luís Capelo Martínez, pelo voto de confiança, aceitando-me no seu grupo de investigação para realizar o Mestrado, que após concluído, deu a continuidade para o desenvolvimento deste projeto. Agradeço ainda, a contribuição para a minha formação como investigador e revisão crítica deste trabalho.
Ao Doutor Rui Mamede Branca, pela orientação e ajuda dada durante o meu período de adaptação na instituição de acolhimento estrangeira, pela sua disponibilidade, apoio e ensinamentos transmitidos.
Ao Hospital Garcia da Orta, mais concretamente ao Serviço de Nefrologia e em especial ao Sr. Doutor Fernando Teixeira e Costa e Sra. Doutora Aura Ramos, pela colaboração e disponibilização das amostras para este estudo.
A todos os meus colegas dos grupos de investigação Bioscope e LehtiöLab, pelo companheirismo, entreajuda e convívio dentro e fora do trabalho.
Aos meus Amigos e Família, pela amizade, confiança, carinho e apoio incondicional, o meu mais sincero Obrigado!
Pelo suporte financeiro agradeço à FCT, no âmbito do projeto SFRH/BD/109201/2015, assim como aos grupos de investigação LehtiöLab e Bioscope e à Associação Científica Proteomass
ix
ABSTRACT
Peritoneal membrane (PM) failure in patients with end stage renal disease submitted to peritoneal dialysis (PD) cannot be predicted and does not occur in every patient in the same sequence and to the same extent. Moreover, long-term PD leads to morphological and functional alterations in the PM, reducing the lifespan of this dialysis up to five years, and forcing the replacement of PD by other renal replacement therapies. This represents a lower quality of life for the patients and extra cost of tens of million euros per year for the Portuguese National Health System.
Peritoneal dialysis effluent (PDE) represents an underestimated biochemical window into the peritoneum and a useful reservoir of potential clinical biomarkers. Therefore, this work aims to develop longitudinal studies to unravel the evolution of the peptidome and proteome of the PDE with time, to identify specific molecular changes that can be particularly interesting for the understanding and early detection of long-term PM alterations. To achieve this goal, mass spectrometry (MS)-based methods are needed to improve PDE proteome and peptidome analysis and to overcome some drawbacks that can arise from such a complex biological sample that can hamper the proteome and peptidome coverage.
For this reason, this thesis is focused also in the use of sample treatments and methodologies to reduce PDE sample complexity prior to MS analysis. Therefore, different methods of sample treatment were assessed with success as proteomics tools for getting insight into the PDE proteome and peptidome. Furthermore, this research constitutes the first proteome and peptidome-based longitudinal study of PD patient. In addition, the results represent the highest proteome and peptidome coverage ever achieved for this complex sample. Hence, this knowledge could be useful for the proteomic and clinical PD-devoted research community.
Keywords: Peritoneal dialysis effluent, Sample preparation, Mass spectrometry, Proteome
xi
RESUMO
A falha da membrana peritoneal (MP) em pacientes submetidos a diálise peritoneal (DP), não é um fenómeno possível de predizer, não ocorrendo de forma uniforme em todos os pacientes. A DP prolongada no tempo induz alterações morfológicas e funcionais na MP, o que reduz o tempo útil de tratamento a um máximo de 5 anos. Após este período, o paciente é forçosamente transferido para outro tipo de terapia de substituição renal, perdendo qualidade de vida e aumentando os custos de tratamento em dezenas de milhões de euros para o Serviço Nacional Saúde.
O efluente de diálise peritoneal (EDP), quando não menosprezado, representa um reservoir de potenciais biomarcadores que poderá ser útil para entender a bioquímica do peritoneu. Assim, este trabalho pretende efetuar um estudo temporal de modo a avaliar o conteúdo peptidómico e proteómico do EDP. A identificação de proteínas e péptidos indicadores de alterações da MP é particularmente interessante para compreender os mecanismos de alterações da MP ao longo do tratamento. No entanto, é necessário desenvolver métodos que melhorem e permitam ultrapassar algumas das dificuldades que advém da complexidade biológica deste tipo de amostra e que impedem a análise apropriada destas.
Por as razões acima mencionadas, esta tese é focada também na investigação e aplicação de metodologias para o tratamento de amostra de forma a reduzir previamente a complexidade das amostras de EDP antes da análise por espectrometria de massa. Diferentes metodologias foram testadas e permitiram com sucesso a análise proteómica e peptidómica das amostras de EDP. A investigação desenvolvida representa o primeiro estudo longitudinal neste tipo de amostra em pacientes de DP e com o maior número de proteínas e péptidos alguma vez identificados. Este conhecimento poderá ser útil para a comunidade proteómica e médica que desenvolvem investigação nesta área.
Palavras-chave: Efluente de diálise peritoneal, Preparação de amostra, Espectrometria de massa,
xiii
SUBJECT INDEX
ACKNOWLEDGEMENTS ... vii
ABSTRACT ... ix
RESUMO ... xi
SUBJECT INDEX ... xiii
FIGURES INDEX ... xix
TABLES INDEX ... xxvii
SYMBOLS, UNITS AND ABBREVIATIONS ... xxix
CHAPTER I. GENERAL INTRODUCTION ... 1
1-A general revision of chronic kidney disease and renal replacement therapies... 3
2-Peritoneal Dialysis: a peritoneal membrane-based treatment technique ... 4
2.1- Solute and water transport across the PM ... 6
2.2- Peritoneal equilibration test ... 9
2.2.1-Dialysate/plasma ratios and peritoneal transporter classification ... 10
2.2.2- Ultrafiltration capacity /Net ultrafiltration ... 12
2.3- Dialysis dose adequacy ... 13
2.4- Peritoneal protein clearance ... 14
2.5- Peritoneal dialysis effluent CA 125 marker ... 14
2.6 -Residual kidney function ... 15
3- Complications related to Peritoneal Dialysis therapy ... 15
3.1-Inducers of peritoneal membrane degradation ... 16
3.1.1- Inflammation and infection ... 17
3.1.2- Mesothelial to Mesenchymal Transition ... 19
3.1.3- Angiogenesis and Lymphangiogenesis ... 24
3.1.4- Peritoneal fibrosis, sclerosis and EPS ... 26
3.2- Peritoneal membrane failure ... 28
3.3- Stability of peritoneal membrane transport over time ... 31
3.3.1- Biocompatibility of the Peritoneal Dialysis Fluids ... 32
3.3.2-Pharmacological preservation of the peritoneal membrane ... 35
4- Early detection of peritoneal response ... 38
4.1-Implementation of biomarker use in clinical practice ... 38
5-Mass spectrometry ... 41
5.1-Mass spectrometry analysers ... 42
5.2-Ionization methods ... 44
5.3-Fragmentation methods ... 45
xiv
6.1-Mass spectrometry-based approach to study the PDE proteome and peptidome... 47
6.1.1-Sampling strategy and sample preservation ... 49
6.1.2- Protein depletion and protein concentration strategies applied to PDE samples ... 50
6.1.3- Protein digestion strategies applied to PDE samples ... 51
6.1.4- Gel-based electrophoresis strategies for protein and peptide fractionation of PDE samples ... 53
6.1.5-RP-HPLC strategy for fractionation of PDE samples ... 54
7-Quantitative mass spectrometry-based proteomics ... 55
8-Bioinformatic analysis of mass spectrometry-based data sets ... 58
8.1- Gene Ontology term identification and enrichment analysis ... 59
9-References ... 61
CHAPTER II. OBJECTIVES, WORKING PLAN AND THESIS OUTPUT ... 77
1-Objectives ... 79
2-Working Plan ... 80
3-Thesis Output ... 82
3.1-Papers published in international scientific journals ... 82
3.2-Paper in preparation ... 82
3.3-Participation in national and international conferences ... 82
CHAPTER III. MATRIX-ASSISTED LASER DESORPTION/IONIZATION TIME-OF-FLIGHT MASS SPECTROMETRY-BASED PROFILING AS A STEP FORWARD IN THE CHARACTERIZATION OF PERITONEAL DIALYSIS EFFLUENT ... 85
Abstract ... 87
1-Introduction ... 87
2-Materials and methods ... 88
2.1-Reagents ... 88
2.2-Peritoneal dialysate effluent samples ... 88
2.3-Apparatus ... 88
2.4-Peritoneal dialysate concentration ... 89
2.5-Protein depletion with DTT ... 89
2.6-2D gel electrophoresis... 89
2.7-In-gel protein digestion ... 91
2.8-In-solution protein digestion ... 92
2.9-MALDI-TOF-MS analysis... 92
2.10-Principal component analysis (PCA) ... 92
2.11-Hierarchical clustering analysis ... 93
3-Results and discussion ... 93
3.1-Sample treatment ... 93
xv 4-Conclusions ... 96 5-Conflict of interest ... 96 6-Acknowledgements ... 96 7-Data accessibility ... 96 8-References ... 96
CHAPTER IV. A COST-EFFECTIVE METHOD TO GET INSIGHT INTO THE PERITONEAL DIALYSATE EFFLUENT PROTEOME ... 99
Abstract ... 101
1-Introduction ... 101
2-Materials and methods ... 102
2.1-Reagents and apparatus ... 102
2.2-96-well plate Bradford protein assay ... 103
2.3-Sample collection and pre-preparation ... 103
2.4-Protein depletion with acetonitrile ... 104
2.5-Protein depletion with DL-Dithiothreitol ... 104
2.6-1D-SDS-PAGE ... 104
2.7-2D-gel electrophoresis ... 104
2.8-Gel staining and image analysis ... 105
2.9-In-gel protein digestion ... 105
2.10-Mass spectrometry analysis ... 105
3-Results and discussion ... 106
3.1-Performance of centrifugal concentrators ... 106
3.2-Use of acetonitrile- or dithiothreitol-based sample treatments over PDE samples ... 107
3.3-Clinical significance... 109 4-Concluding remarks ... 111 5-Conflict of interest ... 111 6-Acknowledgements ... 111 7-Data accessibility ... 112 8-References ... 112
CHAPTER V. CLASSIFYING PATIENTS IN PERITONEAL DIALYSIS BY MASS SPECTROMETRY-BASED PROFILING ... 115
Abstract ... 117
1-Introduction ... 117
2-Material and methods ... 119
2.1. Reagents ... 119
2.2-Samples ... 119
2.3-Apparatus ... 119
xvi
2.5-Protein depletion with ACN... 120
2.6-Protein equalization with DTT ... 120
2.7-In-solution protein digestion ... 122
2.8-MALDI-TOF-MS analysis... 122
2.9-Principal component analysis (PCA) ... 122
2.10-Hierarchical clustering analysis ... 123
3-Results and discussion ... 123
3.1-Sample treatments ... 123
3.2-Principal component analysis and hierarchical clustering analysis ... 124
4-Conclusions ... 126
5-Conflict of interest ... 126
6-Acknowledgments ... 126
7-Data Accessibility ... 126
8-References ... 126
CHAPTER VI. IN-DEPTH ANALYSIS OF PERITONEAL DIALYSIS EFFLUENT PROTEOME AND PEPTIDOME: A LONGITUDINAL FOLLOW-UP STUDY ... 129
Abstract ... 131
1-Introduction ... 132
2-Material and Methods ... 133
2.1-Reagents and apparatus ... 133
2.2-Ethical statement and samples collection... 134
2.3-PDE concentration ... 134
2.4-96-well plate BCC protein concentration measurement assay ... 136
2.5-Proteome analysis of PDE samples ... 136
2.5.1-Multiple Affinity Removal Column Human 14 ... 136
2.5.2-Buffer Exchange/Concentration Samples ... 136
2.5.3-Sample clean-up with Sera-Mag Speed beads (SP3) and protein digestion ... 139
2.5.4-TMT (10 plex) Labelling of peptides ... 139
2.5.5-SCX cleaning of the proteome fraction ... 140
2.5.6-High-resolution isoelectric focusing (HiRIEF) ... 140
2.5.7-Proteome MS analysis ... 140
2.5.8-PDE vs plasma analysis ... 141
2.6-Peptidome analysis of PDE samples ... 142
2.6.1-SCX cleaning of the peptidome fraction ... 142
2.6.2-Peptidome MS analysis ... 142
2.6.3-Protease prediction analysis ... 143
2.7-Longitudinal study: clustering and enrichment analysis ... 143
xvii
3.1-In-depth proteome analysis. ... 144
3.2-PDE peptidome analysis ... 149
3.2.1-Protease prediction ... 150
3.3-Longitudinal study analysis. ... 152
3.3.1-Clinical case studies ... 152
4-Conclusions ... 170
5-Conflict of interest ... 171
6-Acknowledgements ... 171
7-Data Accessibility ... 171
8-References ... 172
CHAPTER VII. CONCLUDING REMARKS AND FUTURE PERSPECTIVES ... 179
xix
FIGURES INDEX
Figure I-1 – Prognosis of CKD based on GFR and albuminuria stages. Image adapted from Levey and
Coresh, 2012 [1]. ….………...……….………3
Figure I-2 – Peritoneal dialysis representation and principle, from the insertion of dialysis fluid, solute
and fluid exchange between peritoneal capillary blood and dialysis solution to final drainage………..6
Figure I-3- A- The capillary dialysis system: capillary, interstitium, mesothelium, and peritoneal cavity.
Potential barriers separating the dialysis solution in the peritoneal cavity from plasma flowing within the microvasculature distributed within the subperitoneal tissue. B- Structure of the PM and representation of the TPM. During PD, the microvascular endothelium (arrows, stained in red) represents the functional barrier for the transport of solutes and water from the blood of the patient to the dialysate that has been instilled in the peritoneal cavity. The Starling forces (P, hydrostatic pressure; Π, oncotic pressure) operating across each type of pore are indicated. Å, angström (10−10m); r, functional radius. C-Transcapillary UF in the TPM, i) Fractional fluid flows across the peritoneum under normal conditions with no dialysis. In the absence of an osmotic agent, (ii) With glycerol as the osmotic agent, (iii) With glucose as the osmotic agent, (iv) In a conventional icodextrin PD solution and v) Backfiltration after gradient dissipation. Aquaporin (AQP), Small Pore (SP) and Large Pore (LP). Figure adapted from Devuyst et al. [16] and Flessner et al. [22]. .………...……….………7
Figure I-4 - Twardowski Curves: Transport status based on the PET. (Left) dialysate creatinine versus
plasma creatinine at 4-hours (D/P); Middle) ratio of dialysate glucose at time zero (D/D0); (Right) Drain volume after 4-hours for the different membrane classifications. The figure was adapted from Hoffman et al. [31]………...…….………...………10
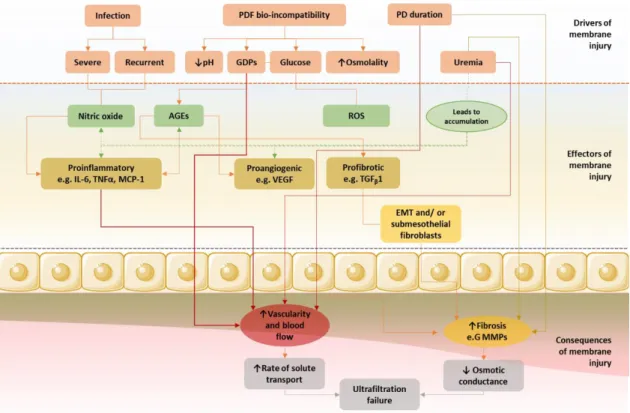
Figure I-5- The pathways of PM injury and progressive UFF can be divided into 3 phases: drivers,
mechanisms, and functional consequences. EMT, epithelial-to-mesenchymal transition; GDPs, glucose degradation products; IL, interleukin; MCP, monocyte chemoattractant protein; TGF, transforming growth factor; TNF, tumor necrosis factor; VEGF, vascular endothelial growth factor. The figure was adapted from Davies [53]..………..………17
Figure I-6- Representation of IL-6 and sIL-6R signalling in the regulation of leukocyte trafficking. The
regulation of leukocyte trafficking in the peritoneal cavity is mediated by proinflammatory cytokine– driven (IL-1, TNF-α, and IFN-γ) activation of IL-6/sIL-6R transsignaling mediated through control of STAT3 activation that results in differential control of chemokine secretion (that is responsible for mononuclear leukocyte and T cell recruitment) and polymorphonuclear neutrophils (PMN) apoptosis. Image taken from Devuyst et al. with permission [57]………...……….19
xx
Figure I-7- Representation of the peritoneal membrane suffering structural abnormalities such as, loss
of mesothelial cells monolayer, increasing number of fibroblasts, submesothelial fibrosis, and augmented number of vessels. The key steps and effectors for the epithelial-to-mesenchymal transition (EMT) and for mesenchymal-to-epithelial transition (MET) are also represented. Furthermore, common markers for epithelial and mesenchymal cells, resident fibroblasts and myofibroblasts, are also represented. Figure adapted from Aroeira et al. [50]…………..……….…..21
Figure I-8- Representation of the signalling pathways that regulate MMT progression. These signalling
pathways are, i) inflammation ii) delta-like jagged Notch, iii) integrins, iv) receptors for TGF/Smads, and v) tyrosine kinase receptors and vi) Janus kinase signal transducer. Abbreviations: MMT (mesothelial-to-mesenchymal transition); TGFβ (transforming growth factor-β); MMPs (matrix metalloproteinases); GSK3β (glycogen-synthase kinase-3β); β-catenin-Lef/Tcf (lymphoid enhancer factor/T cell factor); ILK (integrin-linked kinase); MAPK (mitogen-activated protein kinase); RAS– RAF–MEK–ERK pathway, extracellular signal-regulated kinases (MEK: Mitogen-activated protein kinase kinase. ERK: extracellular signal–regulated kinase); NF-kB (nuclear factor-kB); TAK1 (TGF-beta activated kinase 1); VEGF (vascular endothelial growth factor); ECM (extracellular matrix); Notch-IC (intracellular fragment of Notch); COX-2 (cyclooxygenase); CKs (cytokines); SHCA (adaptor protein SRC homology 2 domain–containing-transforming A); GRB2 (growth factor receptor–bound protein 2); SOS (son of sevenless); TRAF6 (TNF receptor-associated factor 6); α-SMA (alpha smooth muscle actin); AKT (protein kinase B); RhoA (Ras homolog gene family member A); ROCK (Rho-associated protein kinase); STAT3 (signal transducer and activator of transcription 3); t-PA (tissue plasminogen activator); AP-1 (activator protein-1); and LPS (lipopolysaccharide). Figure adapted from Aguilera et al. [65] and González-Mateo et al. [67]……….………23
Figure I-9- Scheme of VEGF receptors and co-receptors and processes in which they are involved.
Figure adapted from Pérez-Lozano et al.[70].……….………..….25
Figure I-10- Clinical characteristics of the different types of UFF and accepted therapeutic option for
UFF. Creatinine mass transfer coefficient (Cr-MTC); dialysate-to-plasma ratio (D/P). Adapted from González-Mateo et al. [23]...………...…….……..29
Figure I-11- Schematic presentation of the potential beneficial effects of newer PDF. Abbreviations:
AGE, advanced glycation end products; PD, peritoneal dialysis; PDF, peritoneal dialysis fluid; PM, peritoneal membrane; RRF, renal residual function; UF, ultrafiltration. Adapted from García-Lopez et al. [93]..………..33
Figure I-12- Schematic representation of three different MS instruments: A- MALDI LIFT-TOF/TOF;
B-Q-Exactive HF (Hybrid Quadrupole-Orbitrap Mass Spectrometer); and C-Orbitrap Fusion (Tribrid Mass Spectrometer). Figure A, was adapted from Suckau et al. [195] and Figure B was taken with permission
xxi
from, Michalski et al. [196] and Figure C was taken from the instrument view software. Thermo Fisher Scientific is acknowledged as an author of the Thermo Fisher material..………...………..….43
Figure I-13- Soft ionization techniques, A- Matrix-assisted Laser Desorption Ionization (MALDI); B-
Electrospray Ionization (ESI). Figure adapted from [199], [200]..………...…..……44
Figure I-14- Distribution of protein abundances is a bell‐shape curve on a logarithmic copy number
scale. Conventional proteomics analysis detects highly abundant proteins (about four orders of magnitude). Deeper proteome analysis requires a much larger sample size. The very low abundant proteins (red part) is the most challenging detection part of the proteome (approximately 1000 least abundant proteins). Figure adapted from Zubarev et al. [215].………48
Figure III-1- PDE sample treatment chart. (1) Concentration of proteins: the protein content of 10 mL
of PDE is concentrated to ca. 150 µL using protein concentration tubes Vivaspin 15R MWCO 10 kDa. (2) Protein depletion: the sample treatment to equalize the proteome content consists of DTT depletion. The resulting pellet is discarded and the supernatant (SN) is withdrawn and stored at -80 ºC until analysis. (3) Sample trypsination: samples are digested using the ultrafast protein digestion, which was performed in a sonoreactor with the following operating conditions: 50% ultrasonic amplitude and 2.5 min ultrasonic time (twice). Then, the sample was vacuum centrifuged until dry. (4) MALDI Profiling: for sample analysis, the peptides were re-suspended, hand-spotted onto a MALDI target plate and analysed by MALDI-TOF MS. Finally, the Mass-Up program was used, as it was designed to support the pre-processing [(i) baseline correction; (ii) normalization; (iii) smoothing; (iv) peak detection; (v) peak matching] and analysis of MALDI-TOF mass spectrometry data through principal component analysis and hierarchical clustering analysis………..……… 90
Figure III-2-2D-SDS-PAGE image from a pooled PDE sample of ten patients after protein
concentration and depletion. Representative pie charts of: (A) biological processes; (B) cellular components; (C) molecular function of the identified proteins. The pie charts were generated with the STRAP 1.5 software………95
Figure IV-1- Reproducibility of protein recovery after centrifugal ultrafiltration: (A) Ratio of protein
concentration after concentration (P a.c) and before concentration (P b.c). Protein concentrations were determined by Bradford Protein Assay (595 nm). Centrifugal ultrafiltration was performed in duplicates. The error bars represent the standard deviation of protein concentration between two replicates of the same sample. (B) % of protein recovery after centrifugal ultrafiltration. The error bars represent the standard deviation of recovery between two replicates……….107
Figure IV-2-Colloidal coomassie stained 2D SDS-PAGE of a pool of peritoneal dialysate effluent
xxii
Figure IV-3-Number of detected spots, number of identified proteins and number of unique identified
proteins for the samples without HAPs depletion, after depletion with ACN and DTT. Venn diagram of the unique identified proteins in each treatment and percentage of immunoglobulins and apolipoproteins enriched identified in each treatment……….109
Figure IV-4-Annotation per gene ontology term obtained with the Software Tool for Researching
Annotations of Proteins (STRAP). Bar chart of (A) Biological process GO term annotations, (B) Cellular component GO term annotations and (C)Molecular function GO term annotations. STRING Protein interaction network of the proteins identified in PDE. The proteins dashed in red denote involvement in (A1) Regulation, (B1) Extracellular and (C1) Binding. The network uses a confidence view. Thicker lines represent stronger associations……….110
Figure V-1- PDE sample treatment chart (Adapted from Araújo et al. 23). Sample pre-treatment: the
protein content of 50 ml of PDE is concentrated to c.a. 150 µL using protein concentration tubes. Sample treatment: (A) Protein depletion with ACN, was used to avoid the presence of major protein. (B) Protein equalization with DTT, was used to equalize the proteome content. (C) Without depletion, no pre-treatment was used to avoid major protein or equalize the protein content. The pools of proteins obtained for all the three treatments were quantified and then trypsinated using ultrafast protein digestion. Sample Analysis: Peptides were analysed by MALDI-TOF MS. Finally, the Mass- Up program was used to support the pre-processing and analysis of MALDI-TOF mass spectrometry data…….………..121
Figure V-2- (A) 1D-SDS-PAGE, 12.5% polyacrylamide gels with 1 mm thickness: Molecular Weight
standard (first lane), PDE Pool without treatment (second lane), DTT-treated samples (3–6 lanes) and ACN-treated samples (57%) (6–10 lanes). (B) Bar charts with the comparative percentage of immunoglobulins and apolipoproteins identified in each treatment (DTT and ACN) and for different samples (Serum and PDE). (C) MALDI-TOF-MS-based profiles obtained for the same patient with different treatment methods (without depletion, DTT, ACN)………...124
Figure V-3- Mass-Up 3D Principal Component Analysis (PCA) for each sample treatment method...125 Figure V-4- Mass-Up Hierarchical Clustering Analysis for each sample treatment method………... 125 Figure VI-1- Longitudinal cohort description. Per patient starting date of peritoneal dialysis (PD) and
Peritoneal Equilibration Test (PET) sample collection. Active and non-active patients are highlighted in different shapes. For non-active patients, the documented date of the last peritoneal dialysis is displayed………...……137
Figure VI-2- PDE sample treatment chart for the Proteome and Peptidome fractions. Pre-treatment:
PDE samples are first centrifuged to remove insoluble pellets and then desalted and concentrated using centrifugal concentrator's tubes with 10 kDa cut-off membrane, thus obtaining the Proteome (> 10 kDa) and Peptidome (< 10 kDa) fractions. The Proteome fraction (Proteome analysis), was subjected to
xxiii
protein depletion of the HAPs using the MARS14 approach. After the MARS14 runs, the depleted fraction was collected to centrifugal concentrators of 10 kDa to perform the buffer exchange and sample concentration before proceeding with the SP3-clean-up and digestion. Then, SP3-clean-up was performed and the peptides obtained after SP3 digestion were quantified and labelled with TMT 10-plex and the samples pooled. Afterwards, the pooled samples were fractionated with HiRIEF approach and then, the LC-MS/MS analysis (using Q-Exactive) of the 72 HiRIEF fractions performed. Finally, the longitudinal analysis of the data (using TiCoNE software) and the enrichment analysis were performed. The Peptidome fraction (Peptidome analysis) clean-up and peptide concentration was done using SCX cartridges. The concentration of the endogenous peptides was further quantified and analysed through LC-MS/MS (using Orbitrap Fusion), with CID and EThcD fragmentation methods. Finally, the data base searching and peptide identification was performed, and the peptides obtained were analysed with the Proteasix software (protease prediction tool).………...…………...138
Figure VI-3- Venn’s diagram comparison, A- This study vs PDE studies; B- PDE HiRIEF vs Plasma
HiRIEF studies……….………...………..146
Figure VI-4- Correlation of PDE abundance (median MS1 intensity) and plasma abundance. A- HiRIEF
plasma nephropathy versus normal plasma (same technique, plasma samples) (Spearman´s correlation =0.68). B- HiRIEF normal plasma versus PDE analysis (same technique, different samples) (Spearman´s correlation =0.57). C- HiRIEF plasma nephropathy versus PDE (same technique, different samples) Spearman´s correlation =0.61). ………..………...147
Figure VI-5- Bar chart with the number of proteins identified per patient for the different time points.
The protein groups are coloured with, i) light blue: proteins common among time points of each patient; ii) dark blue: protein uniquely identified for the first time point (T1); iii) light green: protein uniquely identified for the second time point (T2); iv) dark green: protein uniquely identified for the third time point (T3); v) pink: protein uniquely identified for the fourth time point (T4); v) red: protein uniquely identified for the fifth time point (T5). Dashed lines indicate the number of common protein identified across all samples in the study (n=1807) and the median of proteins identified (n=3136)………...………148
Figure VI-6- PDE proteins ranked (using nephropathy plasma dataset 2) according to abundance and
coloured accordingly with, Yellow, proteins shared across patients that are also found in plasma (1200 proteins). Blue, proteins shared across patients but not found in plasma (603 proteins). Red, proteins not shared across patients but found in plasma (362 proteins). Purple, proteins not shared across patients nor found in plasma (2384 proteins). Some suggested literature PD candidate biomarkers that were identified and quantified with our methodology are highlighted in the abundance rank distribution ………..149
xxiv
Figure VI-7- Bar chart with the predicted proteases for those peptides that had at least one protease
prediction. For each protease the blue bar indicates the number of cleavage events, and the red bar the number of cleaved substrates that each protease is responsible for. The green and red labelling, means
that the predicted protease is found or not found in the proteome,
respectively………..…….151
Figure VI-8- Case study 1 (P01)- Cluster trends (time profiles) and respective bar plot with the most significant (-log10 adjusted p-value) enriched pathways for each cluster. Bar heights represent the adjusted p-value for each pathway. The log2 fold change represents the median of the differences between all proteins enriched for that specific pathway at the last time-point and the same proteins at the first time-point. Blue means decrease, and red increase. The dots represent the number of proteins identified within the pathway in a specific cluster, divided by the total number of proteins identified in a specific pathway for this specific patient proteome background (universe). Dashed line represents the threshold of the p-adjusted value (0.25)...……….………157
Figure VI-9- Case study 2 (V16)- Cluster trends (time profiles) and respective bar plot with the most
significant (-log10 adjusted p-value) enriched pathways for each cluster. Bar heights represent the adjusted p-value for each pathway. The log2 fold change represents the median of the differences between all proteins enriched for that specific pathway at the last time-point and the same proteins at the first time-point. Blue means decrease, and red increase. The dots represent the number of proteins identified within the pathway in a specific cluster, divided by the total number of proteins identified in a specific pathway for this specific patient proteome background (universe). Dashed line represents the threshold of the p-adjusted value (0.25)………...………….………162
Figure VI-10- Case study 3- Cluster trends (time profiles) and respective bar plot with the most
significant (-log10 adjusted p-value) enriched pathways for each cluster. Bar heights represent the adjusted p-value for each pathway. The log2 fold change represents the median of the differences between all proteins enriched for that specific pathway at the last time-point and the same proteins at the first time-point. Blue means decrease, and red increase. The dots represent the number of proteins identified within the pathway in a specific cluster, divided by the total number of proteins identified in a specific pathway for this specific patient proteome background (universe). Dashed line represents the threshold of the p-adjusted value (0.25).……….………..……169
xxv
Annex I
Figure S1- Bar chart representation of the total number/overlap of peptides and proteins identified
between sets...……..……….………..………..………187
Figure S2- Venn diagrams comparison of the fragmentation techniques (CID and HCD-EthcD) applied
for endogenous peptides analysis, with number of peptide sequences and parental proteins identified and proteases predicted…..………..……….………187
xxvii
TABLES INDEX
Table I-1- Dialysis regimen based on PET procedure. Adapted from Twardowski [33]…………..…...11 Table I-2- Types of cytokines produce by different cells in peritoneum, their relevance to PD. Adapted
from Shi el al.[55].………...…………..………..18
Table I-3 Potential pharmacological interventions to block different processes implicated in the
alterations suffered in the peritoneal membrane during peritoneal dialysis. Adapted from Gónzalez-Mateo [23]………...36
Table I-4- Candidate effluent biomarkers in peritoneal dialysis. Table adapted from Barreto et al. [144],
Bajo et al. [94]……….………..…...…….……..40
Table VI-1-Demographic data and clinical characteristics of the PD patients’ cohort at the baseline...135
Annex I
Table S1- Enriched pathways (terms) present across the patient’s cohort. Each pathway (term), has the
frequency, that means the number of times that a pathway appears across the patients cohort, the patients that have that specific term, and the group (relation between the different pathways, if they are related the group number is the same).………..……….………....…...188
Table S2- Clinical parameters assess during the PET for the longitudinal case study patients. The values
highlighted are out of the reference range values for that specific parameter (described at the bottom of the table)………....………..……….…….………....204
Table S3- Patient P01-Enriched pathways for each cluster with the respective Gene Ratio, Background
ratio (Bg Ratio), p-value, p-adjust, q-value, Gene Id and counts (number of genes (proteins) per pathways). The highlighted pathways were the one selected for the bar plots graphs.………....………..……….…….…...205
Table S4- Patient V16-Enriched pathways for each cluster with the respective Gene Ratio, Background
ratio (Bg Ratio), p-value, p-adjust, q-value, Gene Id and counts (number of genes (proteins) per pathways). The highlighted pathways were the one selected for the bar plots graphs.………....………..……….…….…...211
Table S5- Patient P03-Enriched pathways for each cluster with the respective Gene Ratio, Background
ratio (Bg Ratio), p-value, p-adjust, q-value, Gene Id and counts (number of genes (proteins) per pathways). The highlighted pathways were the one selected for the bar plots graphs..………....………..………..……….…….…...218
xxviii
Electronic Supplementary Material Tables
Electronic Supplementary Material of Chapter VI can be assessed at ProteomeXchange:
Project Name: In-Depth Analysis of Peritoneal Dialysis Effluent Proteome and Peptidome: A Longitudinal Follow-Up StudyProject accession: PXD016853
Username: [email protected]
Files:
Table ESM1- Detailed clinical information of the patient’s cohort. File name:
“Clinical_information_PDE_patients_cohort”.
Table ESM2- Table with all the proteins identified and quantified with TMT labelling for all patients.
File name: “TMT_quantification_PDE_study”.
Table ESM3- Protein ranking abundance, proteins ¬ quantified and summarized are ranked according
to their MS1 intensities and divided into four groups –(non-)unique for PDE, (non-) shared across patients– with neuropathy plasma dataset proteins as background. File name: “Proteome_rank_PDE_nephro2_protein_categories”.
Table ESM4- Proteasix protease prediction analysis of the endogenous peptides acquired and identified
with the CID fragmentation method. File name: “Proteasix_CID_input_observed”.
Table ESM5- Proteasix protease prediction analysis of the endogenous peptides acquired and identified
xxix
SYMBOLS, UNITS AND ABBREVIATIONS
A
Å Ångström
ACE Angiotensin converting-enzyme ACN Acetonitrile
ACS Acute coronary syndromes
ADAMTS13 A disintegrin and metalloproteinase with thrombospondin motifs 13 AEBSF Aminoethyl benzylsulfonyl fluoride
AGEs Advanced glycation end products AKT Protein Kinase B
Ambic Ammonium bicarbonate AMI Acute Myocardial Infarction AngII Angiotensin II
APD Automated Peritoneal Dialysis
ADPKD Autosomal dominant polycystic kidney disease
AQP Aquaporin
ARB Angiotensin II receptor blockers B
BCA Bicinchoninic acid BMP Bone morphogenic protein BSA Bovine serum albumin
BSG Basigin
C
C18 18 carbon aliphatic chains C8 8 carbon aliphatic chains CA125 Cancer antigen 125 CAMs Cell adhesion molecules
CAPD Continuous ambulatory Peritoneal Dialysis CAV-1 Caveolin-1
CBB Coomassie brilliant blue
CCT/TRiC Chaperonin-containing t-complex polypeptide 1 CCL18 CC chemokine ligand 18
ClAA Chloroacetamide
CCPD Continuous cycling peritoneal dialysis
xxx
CHF Congestive heart failure CI Chemical ionization
CID Collision induced dissociation CKD Chronic kidney disease
CKs Cytokines
COX-2 Cyclooxygenase-2 CPB2 Carboxypeptidase B2 CPD Chronic peritoneal Dialysis Cpd Solute concentration in the dialysate
Cplasma Solute concentration in plasma
CREB cAMP-responsive element binding protein CTGF Connective tissue growth factor
CTSF Cathepsin F CTSL Cathepsin L1 CTSK Cathepsin K D
D/D0 Dialysate240/initial dialysate ratio of glucose
D/PCr Dialysate/plasma ratio of creatinine
D/Purea Dialysate/plasma ratio of urea
Da Dalton DI Desorption ionization DN Diabetic Nephropathy DOC Deoxycholate DTT Dithiothreitol E
ECD Electron capture dissociation ECM Extracellular matrix
ECs Endothelial cells ECW Extracellular water
EDTA Ethylene diamine tetraacetic acid EGF Epidermal growth factor
eGFR Estimated glomerular filtration rate EI Electron ionization
EMT Epithelial-to-mesenchymal transition eNOS Endothelial NO synthase
EPS Encapsulating peritoneal sclerosis ERK Extracellular signal–regulated kinase ESI Electrospray ionization
xxxi
ESRD End stage renal disease ETD Electron transfer dissociation
EThcD Electron-transfer/higher-energy collision dissociation
EuTRiPD European Training and Research in Peritoneal Dialysis Network F
F10 Coagulation X
F2 Prothrombin
FASP Filter-aided sample preparation FGB Fibrinogen beta chain
FGF Fibroblast growth factor FGG Fibrinogen gamma chain
Fig. Figure
FWHM Full width at half-maximum FWT Free water transport G
g Gravitational force equivalent
GCNT1 Beta-1,3-galactosyl-O-glycosyl-glycoprotein beta-1,6-N-acetylglucosaminyltransferase GDPs Glucose degradation products
GFR Glomerular filtration rate GNC Glomerular chronic nephritis GPMDB Global Proteome Machine Database GRB2 Growth factor receptor-bound protein 2 GSEA Gene set enrichment analysis
GSK Glycogen synthase kinase GSK3β Glycogen-synthase kinase-3β H
h Hours
H. High peritoneal transport patients H.A. High-average peritoneal transport patients
HA Hyaluronan
HAP High abundance proteins
HCD Higher-energy collisional dissociation
HD Hemodialysis
HEPES 4-(2-hydroxyethyl)-1-piperazineethanesulfonic acid HGF Hepatocyte growth factor
HIF-1α Hypoxia inducible factor
HiRIEF High resolution isoelectric focusing HPMCs Human peritoneal mesothelial cells
xxxii I
IAA Iodoacetamide
ICAM-1 Intercellular adhesion molecule-1 ICAT Isotope coded affinity tags IEF Isoelectric focusing IFN-γ Interferon-γ
IGF-I Insulin‐like growth factor‐I
IGFBPs Insulin-like growth factor binding proteins
IL Interleukin
ILK Integrin-linked kinase IPG Immobilized pH gradient ITGB1 Integrin beta-1
ITIH3 Inter-alpha-trypsin inhibitor heavy chain H3 iTRAQ Isobaric tag for relative and absolute quantification) K
K Lysine
KDa kilodalton
Kf Membrane filtration coefficient
KNG1 Kininogen-1
Kt/Vurea K, the clearance of urea (mL/min) multiplied by t, the time of dialysis treatment (min ) by the
coefficient of V, the volume of distribution of urea (mL) L
L2 Neural cell adhesion molecule L1
L Litters
L. Low peritoneal patients transport L.A. Low-average peritoneal patients transport LAP Low abundance proteins
LC Liquid chromatography
Lef/Tcf Lymphoid enhancer factor/T cell factor LMWH Low molecular weight heparin
LP Large Pores
LpS Hydraulic condunctance or ultrafiltration coefficient LPS Lipopolysaccharide
M
m Minutes
m/Z Mass-to-charge ratio
M1 Macrophages with a proinflammatory phenotype
xxxiii
M2 Macrophages with a profibrotic phenotype MALDI Matrix-assisted laser desorption ionization
MALDI-TOF Matrix-assisted laser desorption ionization time of flight MAPK Mitogen-activated protein kinase
MARS Multiple Affinity Removal System MCP Monocyte chemoattractant protein MCs Mesothelial cells
MEA Modular enrichment analysis MEK Mitogen-activated protein kinase MET Mesenchymal-to-epithelial transition MHC Major histocompatibility complex
mm Millimetre mmHg Millimetre of mercury mM milliMolar mmol Millimole MMPs Matrix Metalloproteinases MMT Mesothelial-to-mesenchymal transition mOsm Milliosmole MS Mass spectrometry MS/MS Tandem mass spectrometry MTAC Mass transfer-area coefficient
mTOR Mammalian target of rapamycin MW Molecular weight
MYL Myosin light chain
MUC16 Mucin-16
Mφ Macrophages
N
NaF Sodium fluoride Net UF Net ultrafiltration NF-kB Nuclear factor-kB
NIPD Nocturnal intermittent peritoneal dialysis
NO Nitric Oxide
Notch-IC Intracellular fragment of Notch Nrps Neuropilins
NT-proBNP N-terminal brain natriuretic peptide P
P Hydrostatic pressure
xxxiv
PAMSs Phenotype-associated molecular signatures PAMSs Phenotype-associated molecular signatures PCA Principal component analysis
PD Peritoneal dialysis PDE Peritoneal dialysis effluent PDF Peritoneal dialysis fluid
PDGFRB Platelet-derived growth factor receptor beta PET Peritoneal equilibration test
PGE2 Prostaglandin E2
PLG Plasminogen
PLAU Urokinase-type plasminogen activator PKCα Protein kinase C
PM Peritoneal membrane PMF Peptide mass fingerprints PMN Polymorphonuclear neutrophils PMSF Phenylmethylsulfonyl fluoride
PPAR-γ Peroxisome proliferator-activated receptor-γ PPCl Peritoneal protein clearance
PPI Protein-protein interaction ppm Parts per million
PRIDE Proteomics identifications database PROC Vitamin k-dependent protein C PROS Vitamin k-dependent protein S PSTR Peritoneal solute transport rate PTH Parathyroidism hormone PTM Post-translational modifications Q Q Quadrupole R R Arginine
RAGE Receptors of advanced glycation end products RAS Renin-angiotensin system
RF Radio frequency
Rhoa Ras homolog gene family member A RKF Residual kidney function
ROCK Rho-associated protein kinase
RORγt Retinoic acid-related orphan receptor-γt
xxxv
RRT Renal replacement therapies RTKs Receptor tyrosine kinases S
s Seconds
SD Standard deviation
SEA Singular enrichment analysis SERPINA11 Serpin A11
SERPINC1 Antithrombin-III SERPIND1 Heparin cofactor 2 SERPINF2 Alpha-2 antiplasmin SERPING1 Plasma protease C1 inhibitor
SHCA Adaptor protein SRC homology 2 domain-containing-transforming A SI Spray ionization
sIL-6R Soluble interleukin-6 receptor
SILAC Stable isotope labelling by amino acids in cell culture
SN Supernatant
SOS Son of sevenless
SP Small pores
SP3 Single-Pot Solid-Phase-enhanced Sample Preparation SPUF Small-pore ultrafiltration
SS Simple peritoneal sclerosis SSP Severe sclerosing peritonitis
STAT3 Signal transducer and activator of transcription 3 T
TAK1 Tumor growth factor-β-activated kinase 1 TBW Total body water
TCA Trichloroacetic acid
TCEP Tris(2-carboxyethyl)phosphine TFA Trifluoroacetic acid
TGF Transforming growth factor Th T helper cells
TIMP Inhibitors of metalloproteinase
TMED N, N, N’, N’-tetramethylethylene-diamine TMP Three pore model
TMT Tandem mass tags TNF Tumor necrosis factor TOF Time-of-flight
xxxvi
TRAF6 Tumor necrosis factor receptor-associated factor 6 U
UF Ultrafiltration UFF Ultrafiltration failure
US Ultrasounds
V
VCAM-1 Vascular cell adhesion molecule-1 VEGF Vascular endothelial growth factor
VEGFRs Vascular endothelial growth factor receptors W
WBC White blood cell
Others
1D-SDS‐PAGE One‐dimensional sodium dodecyl sulfate/polyacrylamide gel electrophoresis 2D-SDS_PAGE Two-dimensional sodium dodecyl sulfate polyacrylamide gel electrophoresis
Å Ångström
α-SMA α-smooth actin β1-AR β1-adrenergic receptor π Effective osmotic pressure
3
1-A general revision of chronic kidney disease and renal replacement therapies
Chronic kidney disease (CKD) is a general term for heterogeneous disorders affecting kidney structure and function [1]. Currently, the international guidelines define CKD as decreased kidney function shown by a glomerular filtration rate (GFR) of less than 60 mL/min per 1.73 m2, or markers of kidney damage (albuminuria), or both, of at least 3 months duration, regardless of the underlying cause [2]. Given the important of the GFR in the pathophysiology of the complications, the disease is classified into five stages based on GFR: Stage 1 (> than 90 mL/min per 1.73 m2); Stage 2 (60–89 mL/min per 1.73 m2); Stage 3 (30–59 mL/min per 1.73 m2); Stage 4 (15–29 mL/min per 1.73 m2) and stage 5 (< than 15 mL/min per 1.73 m2) (Figure 1). Also, albuminuria stages should be taken into account for prognosis, since increased albuminuria is correlated with mortality and kidney outcomes [1].
Figure 1 – Prognosis of CKD based on GFR and albuminuria stages. Image adapted from Levey and Coresh, 2012 [1].
Additionally, CKD is a leading cause of end stage renal disease (ESRD) and cardiovascular morbidity and mortality worldwide, resulting in a growing social and economic burden [3]. ESRD is the irreversible loss of kidney function, which is fatal if not treated with renal replacement therapies (RRT) or renal transplantation [4].Thus, kidney failure is defined as a GFR of less than 15 mL/min per 1.73 m², or the need for treatment with dialysis or transplantation [5]. However, for patients with ESRD unable to receive a kidney transplant, replacement of kidney function with dialysis is necessary to extend life, hemodialysis (HD) and peritoneal dialysis (PD) being the two major forms of therapy.
4
HD involves the passage of blood via an extracorporeal circuit whereby removal of small solutes, toxins, and water is achieved across a synthetic, semipermeable dialysis membrane [6].Given the technical differences between dialysis and ultrafiltration, patients can undergo solute clearance, volume removal, or both simultaneously [7]. In PD, the dialysis membrane is the highly vascularized internal lining of the peritoneal cavity. Intraperitoneal installation of hypertonic high glucose PD solution creates a transmembrane osmotic and diffusive gradient that facilitates water removal (ultrafiltration), convection and diffusion of uremic toxins [6]. Each year over 100.000 Americans and similar number of Europeans move from advanced non-dialysis-dependent CKD to RRT, these patients usually have an GFR <25 mL/min 1.73 m2 at the time of the transition. From these patients, <5% undergo kidney transplantation and the majority move on to renal replacement therapy (RRT) [5]
Nowadays, the number of people worldwide suffering from chronic kidney diseases and requiring dialysis treatment is rising at a constant rate of around 6% annually, with more than 3.4 M patients expected in 2018 and approximately 4.9 M by 2025 [8]. Likewise, as the global burden of CKD continues to increase, so does the need for a cost-effective RRT [9]. To-date there is a focus of interest in peritoneal dialysis (PD), as it provides a better quality of life and autonomy for the patients than other renal replacement therapies (RRT) such as hemodialysis and represents a cost-effective RRT. Despite these benefits, the utilization of PD has not always increased [9],[10]. In the last decade, approximately 196,000 end stage renal disease (ESRD) patients were performing PD worldwide, representing 11% of the dialysis population [11].
Therefore, to move the PD therapy forward some strategies need to be implemented to facilitate PD utilization, such as, policies and incentives to favour this therapy, appropriate training for nephrologists to increase the use of the therapy and to decrease the rates of technique failure. In addition, the PD community should undertake clinically meaningful studies with a strong focus on technique survival [9] [10].
2-Peritoneal Dialysis: a peritoneal membrane-based treatment technique
Peritoneal dialysis (PD) is a life-sustaining therapy that involves solute and fluid exchange, mainly between peritoneal capillary blood and dialysis solution in the peritoneal cavity [12]. This therapy is based on using the peritoneum, defined as the serosal membrane that covers the peritoneal cavity, because it is a semipermeable membrane through which ultrafiltration and diffusion of circulating compounds occur[10],[11],[13].
The peritoneum is composed of two principal parts, (i) the parietal peritoneum, which covers the inner surface of the abdominal and pelvic walls including the diaphragm, and (ii) the visceral peritoneum, which covers visceral organs, forms the visceral mesentery that connects loops of bowel, and reflects over and covers the inner surface of the abdominal wall. In the physiological state, the peritoneal cavity retains 50–100 mL of peritoneal fluid. This space can be enlarged by the instillation of fluid, normal-sized adults can tolerate 2 or more liters of fluid without discomfort [5][13][14]. In PD
5
patients, the compact zone of the visceral peritoneum is ~20 µm thicker and the parietal peritoneum can be thickened up to 500 µm in long-term PD patients when compared with 50 µm of a normal parietal peritoneum [15].
The PD efficiency is dependent of important anatomic components of the PM, such as, the mesothelium, the insterstitium, the microcirculation and the visceral lymphatics. The mesothelial cell monolayer, mesothelium, lines the peritoneal cavity [14]. These cells secrete lubricants, anticoagulants and surface-lowering substances for the peritoneum, minimizing the friction between intra-abdominal organs, caused by intestinal peristalsis or respiratory movement [16]. In the steady state, mesothelial cells produce 5-100 mL of peritoneal fluid containing complement factors, immunoglobulins, defensins, and immune cells such as macrophages, lymphocytes, eosinophils, and mast cells that exert anti-infection actions and regulate the inflammatory response [17].
The homogenous basement membrane underling the mesothelial cells (MC), is between 25 and 40 mm thick, and is believed to be composed of type IV collagen, proteoglycogens, and glycoproteins [14]. Below the mesothelium is the submesothelial compact zone. It contains the interstitium, which is the supporting structure of the peritoneum and is primarily composed of a mucopolysaccharide matrix, contains bundles of collagen fibers, blood vessels, the lymphatics, occasional macrophages, glycosaminoglycans, and fibroblasts. There are aqueous and lipophilic phases. The aqueous phase mediates transport of water, electrolytes, protein, nutrients, and hormones [6][14].
The blood supply to the visceral and parietal peritoneum (that constitute 60% and 40% of the total surface area of peritoneum, respectively) arises from 2 sources: (1) the celiac and mesenteric arteries, with venous drainage via the portal vein; and (2) the circumflex, iliac, lumbar, intercostal, and epigastric arteries draining directly into the systemic circulation, bypassing the hepatic portal system. The number of perfused capillaries determines the functional area for the exchange between blood and dialysate. The solute exchange occurs according to the three pore model (TMP) (described below in section 2.1), in which ultra-small pores (aquaporin (AQP)-1) mediate water flux along osmotic gradients, small pores (40-60 Å) transport readily dialyzable molecules (sodium and urea) and large pores (100-200 Å) are responsible for movement of macrolecules (β-2 microglobulin) [6] [7] [14].
In addition, a network of lymphatic vessels aids in the removal of fluids and solutes from the interstitium. The fluid absorption occurs primarily through stomata in the subdiaphragmatic area. Several physiologic factors can alter the rate of lymphatic uptake, such as, intraperitoneal hydrostatic pressure, body posture, and pharmacological agents [14].
PD involves the insertion of a permanent abdominal catheter through which the peritoneal cavity is filled with dialysis fluid, left to dwell and then drained out, removing uraemic toxins and excess water (Figure 2). This home-based treatment is undertaken daily by the patients, who can perform continuous ambulatory PD (CAPD) during the day, or use a machine overnight to perform automated PD (APD), also referred to as continuous cycling PD (CCPD). Both methods enable the patient to remain at home, promoting self-management and preserving vascular access, which hemodialysis diminishes
6
[4][18].Thus, this enables patient autonomy and reduces the cost of the medical treatment compared with hemodialysis.
In conclusion, the peritoneal dialysis system has three major components: the peritoneal microcirculation, the peritoneal membrane, and the dialysate compartment, which includes the composition of the solution and the modalities of delivery. All of these components may have an important effect on the final performance of the technique [19].
Figure 2 – Peritoneal dialysis representation and principle, from the insertion of dialysis fluid, solute and fluid exchange between peritoneal capillary blood and dialysis solution to final drainage.
2.1- Solute and water transport across the PM
The PD involves diffuse and convective transports as well as osmosis through the highly vascularized PM [20]. Solute and fluid transport through diffusion is driven by a concentration gradient (from the high-concentration to a lower-concentration compartment), whereas convection (ultrafiltration) is driven by osmotic or hydrostatic pressure gradients [18]. Ultrafiltration, i.e., the amount of water removed from the patient, depends on the presence of an osmotic agent (most often glucose) in the PDF [21]. The pathways available for solute and water exchange between the plasma in the peritoneal capillaries and the fluid in the peritoneal cavity include, i) anatomic peritoneum (more precisely the mesothelium), ii) the cell-interstitial matrix or space, and iii) blood capillary endothelium lining vasculature, which is distributed within the tissue, and can be functionally described as TMP (Figure 3A and 3B) [16] [22].
The solute exchange occurs according to the TPM, through ultra-small pores, small pores and large pores. The ultra-small pores located in endothelial cells account (the only ones located inside the endothelial cells) for about of 2% of the total ultrafiltration (UF) coefficient (LpS, or hydraulic
7
conductance) and are permeable to water but impermeable to solutes (Figure 3B and 3C-i)[16]. The transcellular water permeability is mediated by AQP-1 channels, a membrane protein essential for water removal across the PM that allows transport of solute-free water in response to a crystalloid-induced osmotic pressure. In clinical practice, such water movement is termed free water transport [18]. The small pores (located between the endothelial cells) account for ∼90% of the LpS and 99.5% of the total pore area available for solute transport. The large pores (thought to correspond to interendothelial gaps) account for 5–8% of the LpS, occupying <0.5% of the total pore area[16][23] (Figure 2.1B).
Figure 3- A- The capillary dialysis system: capillary, interstitium, mesothelium, and peritoneal cavity. Potential barriers separating the dialysis solution in the peritoneal cavity from plasma flowing within the microvasculature distributed within the subperitoneal tissue. B- Structure of the PM and representation of the TPM. During PD, the microvascular endothelium (arrows, stained in red) represents the functional barrier for the transport of solutes and water from the blood of the patient to the dialysate that has been instilled in the peritoneal cavity. The Starling forces (P, hydrostatic pressure; Π, oncotic pressure) operating across each type of pore are indicated. Å, angström (10−10m); r, functional radius. C-Transcapillary UF in the TPM, i) Fractional fluid flows across the peritoneum under normal conditions with no dialysis. In the absence of an osmotic agent, (ii) With glycerol as the osmotic agent, (iii) With glucose as the osmotic agent, (iv) In a conventional icodextrin PD solution and v) Backfiltration after gradient dissipation. Aquaporin (AQP), Small Pore (SP) and Large Pore (LP). Figure adapted from Devuyst et al. [16] and Flessner et al. [22].
The Starling forces (P, hydrostatic pressure; Π, oncotic pressure) can be considered as the forces operating across each different type of pore. Under normal conditions, with no dialysis and in the absence of an osmotic agent, ∼60% of the transcapillary fluid flow occurs through small pores, where the Starling forces are close to equilibrium. Approximately 40% of the capillary UF occurs across large pores where there is hardly any colloid osmotic pressure counteracting the transcapillary hydrostatic pressure gradient (Figure 3C-i)[16].
However, transcapillary UF in the TPM can change in different conditions of PD. That is, fluid removal can be markedly enhanced by the presence of an osmotic agent in the peritoneal cavity. With
8
glycerol and glucose as the osmotic agent, ~55% and ~45% of the transperitoneal water flow occurs through water-only pores (AQP), respectively; and 45% and 55% through the small pores, respectively. Glucose is relatively inefficient as an osmotic agent across the small-pore pathway. However, when compared with glycerol (also relative inefficient) it is 50% more efficient than glycerol (Figure 3C-ii and 3C-iii)[16].
The glucose in the dialysis solution, once introduced into the peritoneal cavity, generates crystalloid osmotic pressure which, along with transmembrane hydrostatic pressure, promotes convective water and solute transport from the capillary blood to the dialysis solution. The effectiveness of glucose in promoting water and solute transport during convection is determined by the resistance offered by the PM to glucose transport from the peritoneal cavity to the capillaries. This resistance is expressed as the osmotic reflection coefficient. By definition the reflection coefficient is 1.0 for a solute with complete resistance, such that the solute cannot cross the membrane, and 0 when the membrane offers no resistance to solute movement. [18].
Icodextrin, a glucose polymer, has been introduced as an alternative to the glucose in PD solutions because it provides better UF during long dwells and reduces the metabolic effects [24]. Being a macromolecule, induces colloidal osmosis. Due to its size, is unable to cross capillary walls, generating an oncotic pressure that pulls fluid in its direction. Icodextrin induces fluid transport in its direction at the capillary level even in an isotonic or hypotonic state. Consequently, dialysis solution containing icodextrin draws fluid out of capillary blood despite low osmotic force, through the small pores. In contrast, icodextrin fails to draw water via AQP due to low numbers relative to electrolytes and extremely low osmotic force compared to glucose. In addition, icodextrin stays in the PD fluid for long periods due to extremely slow metabolism and poor absorption from the peritoneal cavity, drawing fluid into the peritoneal compartment for a longer period than glucose-based solution and does not cause sodium sieving [18]. Therefore, with a conventional icodextrin PD solution, ∼25–30% of the molecules (∼3mm) act as a colloid, implying a reflection coefficient close to unity. A 3 mM of high-molecular-weight icodextrin produce approximately, a colloid osmotic pressure of 58mmHg (3 × 19.3mmHg (for solutes with a reflection coefficient of 1, each 1 milliosmole (mOsm) exerts an osmotic pressure of 19.3 mm Hg according to Van’t Hoff’s law [18]), which is sufficient to counteract the plasma colloid osmotic pressure (22–26mmHg) exerted by ∼1mm of negatively charged plasma proteins (Figure 3C-iv). Thus, the type of osmotic agent used markedly affects the mechanisms of osmosis [16].
Back absorption of fluid into capillaries follows Starling forces, whereas lymphatic absorption is convective and driven by the negative force created by expansion of the chest wall during inspiration. Back absorption across the small pores occurs when the crystalloid (glucose) osmotic gradient has totally dissipated, usually after 4h. The net Starling fluid balance is biased toward reabsorption across the small pores in PD and some across AQP-1. On the other hand, a minute UF still occurs across the large pores (figure 3C-v) [16].
9
influenced by, i) the exchange frequency and volume of the dialysate; ii) the osmolality of the dialysate; (iii) the peritoneal blood flow; iv) the effective peritoneal vascular surface area (EPSA) and v) the microvascular intrinsic permeability [25]. The main transport parameters across the PM are routinely evaluated using the peritoneal equilibration test (PET), which is based on the rate of small solutes transport during an exchange (described in section 2.2). Therefore, and based on these basic principles, any increase in the transport of small solutes across the membrane leads to a rapid dissipation of the osmotic gradient (due to increased reabsorption of glucose, the osmotic gradient) and loss of the UF, causing fluid overload in uremic patients [21]. Thus, the capacity of osmotically-induced UF across the PM is a major predictor of outcome and mortality in PD patients, and failure of the UF capacity the most frequent abnormality and the main reason for technical failure in long-term PD patients [21].
2.2- Peritoneal equilibration test
The peritoneal equilibration test (PET) is a standardized test used to assess the transport properties of the PM in individual patients treated with PD enabling the characterization of the functional state of this biological membrane and the assessment of the required dialysis dose. These measurements are useful due to intra- and inter-individual variabilities of the patients [26]. The principle of PET was standardized by Twardowski et al in 1987 as explained below [27].
Firstly, the exchange preceding PET must dwell for 8-12 hours, this pre-test exchange is completely drained over 20 min with the patient in the sitting position, a dialysate and a blood sample are obtained at the end of drainage. Then a sample of dialysis solution is taken from the test bag to be infused, and a 2 L of 2.5% dialysis solution is infused with the patient in the supine position in portions of 400 mL every 2 min. The patient is rolled from side to side after each infusion to mix residual volume and infused solution, and this procedure takes a total of 10 min. Exactly 10 min after the start of infusion, when the infusion is completed (0 dwell time), 200 mL of solution is drained into the bag, mixed well, a 10 mL sample of dialysate is taken and the remaining 190 mL reinfused. Posteriorly, samples of dialysate are taken with the same technique after 30 min, 60 min, 120 min, and 180 min of dwell time. After a 4-hour dwell time, the dialysate is drained over 20 min with the patient in the sitting position. At the end of the drainage, the total volume drained is measured and a dialysate and blood sample are taken. The total time of the equilibration exchange is 270 min. Finally, a sample of dialysis solution is taken from a post-test exchange bag to be infused, and 2 L of fresh solution is infused over 10 min with the same technique as for the equilibration exchange; 200 ml of dialysate is immediately drained into the bag, a 10 ml sample is collected and the remaining 190 ml reinfused [27].
After a PET has been performed it is possible to measure the low molecular weight solute transfer and net ultrafiltration. Details of the process of fluid transport are important from a clinical point of view because of the high prevalence of complications related to water removal which is the reason for the change of PD modality and/or schedule or the change from PD to HD [28]. The PET was the
10
first standardized method to evaluate PM characteristics but there are numerous techniques for measuring peritoneal transport, based on the measurement of parameters, such as, PM transport, total protein clearance, residual renal function, ultrafiltration and nutritional status.
Summing up, the aims of evaluating PM function are:
Optimization of the treatment prescription with regard to small-solute clearances, volume regulation and reduction of uraemic toxicity;
To assess membrane characteristics not related to small solutes: osmotic conductance of glucose, aquaporins, hydraulic conductance, large-solute flow, lymphatic reabsorption;
To evaluate the evolution of peritoneal function over time.
Therefore, assessment of PM characteristics, specifically solute transport rate and UF capacity, is fundamental to PD prescription, as this will guide the prescription [29]. Some of the parameters assessed are described in the following sections.
2.2.1-Dialysate/plasma ratios and peritoneal transporter classification
Measurements performed during PETs include dialysate-to-plasma ratios of urea (D/P urea), creatinine (D/P Cr) at 4 h and the ratio of dialysate glucose concentrations at 0 and 4 h, dialysate240/initial dialysate ratio of glucose (D/D0) (Figure 4). These are calculated and used as parameters of solute transport [26][30].
Figure Twardowski Curves: Transport status based on the PET. (Left) dialysate creatinine versus plasma creatinine at 4-hours (D/P); Middle) ratio of dialysate glucose at time zero (D/D0); (Right) Drain volume after 4-hours for the different


![Table 1- Dialysis regimen based on PET procedure. Adapted from Twardowski [33].](https://thumb-eu.123doks.com/thumbv2/123dok_br/15496185.1043513/47.892.102.793.432.596/table-dialysis-regimen-based-pet-procedure-adapted-twardowski.webp)