ABSTRACT: The Health, Wellbeing and Aging Study (SABE) began in 2000 under the coordination of the Pan American Health Organization as a multicenter study developed in seven urban centers of Latin America and the Caribbean, to determine the health and living conditions of elderly in this region. In Brazil, the study was developed in the city of São Paulo, where 2,143 individuals (cohort A) aged 60 years or older were selected through probabilistic sampling. In 2006, 1,115 of these individuals were interviewed a second time, and a new probabilistic cohort of individuals aged 60 to 64 years was added (cohort B; n=298). Thus the SABE Study – Brazil was transformed into a multi-cohort longitudinal study, with the objective of identifying changes that occur in the aging process among different generations. In 2010, a longitudinal follow-up was developed with cohorts A and B, with the addition of a new cohort of individuals aged 60 to 64 years (cohort C; n=355). The three surveys (2000, 2006 and 2010) involved the application of a questionnaire, anthropometric evaluation and functional tests, with the subsequent inclusion of blood collection for the evaluation of biochemical, immunological and genetic variables, as well as an accelerometer for the measuring of caloric expenditure. Keywords: Longitudinal studies. Demographic aging. Health of elderly. Epidemiology.
10 Years of SABE Study: background,
methodology and organization of the study
10 Anos do Estudo SABE: antecedentes, metodologia e organização do estudo
Maria Lúcia Lebrão (in memoriam)I, Yeda Aparecida de Oliveira DuarteII,
Jair Lício Ferreira SantosIII, Nilza Nunes da SilvaI
SPECIAL ARTICLE / ARTIGO ESPECIAL
IDepartment of Epidemiology, School of Public Health, Universidade de São Paulo – São Paulo (SP), Brazil. IIDepartment of Medical-Surgical Nursing, School of Nursing, Universidade de São Paulo – São Paulo (SP), Brazil.
IIIDepartment of Social Medicine, School of Medicine of Ribeirão Preto, Universidade de São Paulo – Ribeirão Preto (SP), Brazil.
Corresponding author: Maria Lúcia Lebrão. Faculdade de Saúde Pública, Departamento de Epidemiologia. Avenida Dr. Arnaldo, 715, CEP: 01246-904, São Paulo, SP, Brasil. E-mail: [email protected]
INTRODUCTION: INSTITUTIONAL BASES OF THE SABE STUDY
The Health, Wellbeing and Aging Study (SABE) was initially devised by the Pan American Health Organization/World Health Organization (PAHO/WHO) as a mul-ticenter survey to profile the living and health conditions of the elderly in seven urban centers in Latin America and the Caribbean. It was conducted in Bridgetown (Barbados), Buenos Aires (Argentina), Mexico City (Mexico), Havana (Cuba), Montevideo (Uruguay), Santiago (Chile) and São Paulo (Brazil), from October 1999 to December 2000. SABE is the second multi-center survey sponsored by PAHO, the first being the Encuesta de Necesidades
de los ancianos (ENA), developed during the 1980s in 12 urban areas also in Latin America
and the Caribbean.
The study design, sampling plan, instruments and field operations, as well as the col-lection and organization of the data, were carried out by the Center for Demography and Ecology of the University of Wisconsin-Madison. At various stages the SABE Study bene-fited from guidance provided by a body of external consultants who worked in coordina-tion with PAHO/WHO and the Center for Demography and Ecology.
The team of researchers who conducted the SABE Study counted on components such as the PAHO team in Washington, D.C., headed by Dr. Martha Pelaez, at that time the aging coordinator of the institution; some researchers at the Center for Demography and Ecology at the University of Wisconsin-Madison, coordinated by Prof. Dr. Alberto Palloni, responsible for the study design and logistics organization; teams of consultants from both the United States as the involved countries; and, finally, country-based teams made up of senior researchers and their associates.
RESUMO:O Estudo Saúde, Bem-Estar e Envelhecimento (SABE) teve início em 2000 sob coordenação da Organização Pan-Americana da Saúde como um estudo multicêntrico desenvolvido em sete centros urbanos da América Latina e Caribe para traçar o perfil das condições de vida e saúde das pessoas idosas na região. No Brasil, foi realizado na cidade de São Paulo, onde foram entrevistadas 2.143 pessoas (coorte A), com idade igual ou superior a 60 anos, por amostra probabilística. Em 2006, o Estudo SABE – Brasil transformou-se em longitudinal. Nesse momento, foram localizadas e reentrevistadas 1.115 pessoas, introduzindo-se uma nova amostra probabilística de idosos com idade de 60 a 64 anos (coorte B, n = 298), o transformando em longitudinal de múltiplas coortes com o objetivo principal de identificar as transformações que ocorrem no processo de envelhecimento entre as diferentes gerações. No ano 2010 foi desenvolvido o seguimento longitudinal das coortes A e B e introduzida nova coorte de 60 a 64 anos (coorte C, n = 355). Nas três coletas (2000, 2006 e 2010) utilizou-se um instrumento sob a forma de questionário, avaliação antropométrica e testes funcionais, introduzindo-se a coleta de sangue para avaliação de parâmetros bioquímicos, imunológicos e genéticos e, também, o acelerômetro para medir objetivamente o gasto calórico dos idosos.
The primary objective of the SABE Study was to assess the health status of the elderly to project the needs that are likely to result in the rapid growth of this population. The secon-dary objective was to broaden the dialogue between public health research and the study of aging in order to strengthen interdisciplinary work1.
METHODS
In Brazil, the SABE Study was developed in the city of São Paulo, which, although did not have the largest proportion of elderly people in the country, represented - and still repre-sents - the highest absolute number of elderly people, and also the elderly population with greater diversity as a result of immigration and internal migration.
POPULATION
The study population of the first collection (cohort A) was composed of individuals aged 60 years or older residing in the urban area of the city of São Paulo in the year 2000. According to the Brazilian Institute of Geography and Statistics (IBGE), in 1996 the city had 836,223 elderly people, corresponding to 8.1% of the total population.
SAMPLE
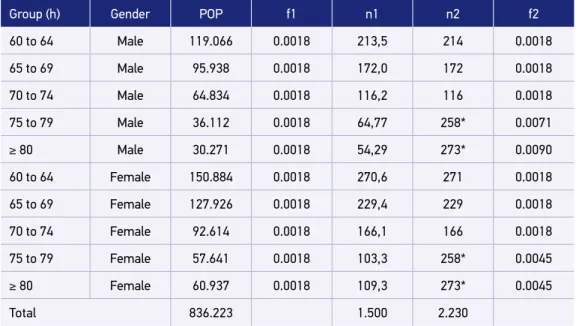
In order to comply with the statistical analysis plan proposed by PAHO, the initial sam-ple size - 1,500 elderly - was distributed according to the strata defined by gender and age group. The proportional sharing criterion led to the results presented in the fifth column of Table 1, according to Equations 1 and 2:
n1 = (f x POP) (1)
Where:
n1 = initial value of the sample size in each age group; f = initial sample fraction; and
POP = number of elderly in each h-th stratum.
(f = n/N) (2)
Where:
f = initial sample fraction;
Due to the low population density, samples from age groups of 75 years and over were extended, by multiplying the numbers obtained at n1 by 2.5. Also, in order to compensate for excess mortality in relation to the female population, the male samples were adjusted to the same amount as the female sample. The last two columns of Table 1 present the expected mini-mum number of interviews (n2) and the respective final sampling fractions (f2) in each stratum. The sample was reached by two procedures: draw of 1,500 elderly and free composition for the extended groups.
In order to calculate the minimum number of 5,882 households to be drawn and to obtain the 1,500 desired interviews, Equation 3 was used:
[d = (1500 * 10/3)*(0,85)-1] (3)
Where:
d = minimum number of households to be drawn.
The ratio 10/3 is the inverse of 3 elderly for every 10 residences, and 0.85 is the expec-ted rate of success of the operation of locating and conducting the interviews in the per-manent private households drawn.
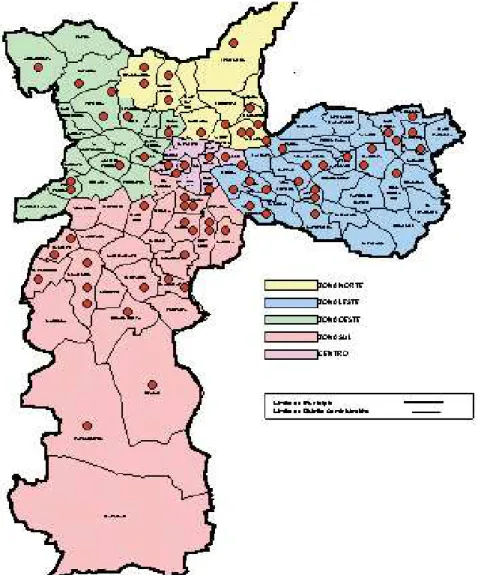
In this case, the two-stage conglomerate sampling method was used under the probability proportional to size (PPS) criterion2. The permanent register of 72 census tracts, available at
the Department of Epidemiology of the School of Public Health, was considered the first stage sample. Figure 1 shows the distribution of census tracts by geographical areas of the city3.
Table 1. Size of samples by gender and age group.
Group (h) Gender POP f1 n1 n2 f2
60 to 64 Male 119.066 0.0018 213,5 214 0.0018
65 to 69 Male 95.938 0.0018 172,0 172 0.0018
70 to 74 Male 64.834 0.0018 116,2 116 0.0018
75 to 79 Male 36.112 0.0018 64,77 258* 0.0071
≥ 80 Male 30.271 0.0018 54,29 273* 0.0090
60 to 64 Female 150.884 0.0018 270,6 271 0.0018
65 to 69 Female 127.926 0.0018 229,4 229 0.0018
70 to 74 Female 92.614 0.0018 166,1 166 0.0018
75 to 79 Female 57.641 0.0018 103,3 258* 0.0045
≥ 80 Female 60.937 0.0018 109,3 273* 0.0045
Total 836.223 1.500 2.230
This sample was taken from the National Survey by Household Sampling (PNAD) 1995, composed of 263 census tracts drawn under the criterion of probability proportional to the number of households. The sampling fraction of the first stage was then calculated by Equation 4, resulting in Equation 5:
f1 = [(263*Di )/D] * (72/263)] (4)
Where:
f1 = fraction of second stage sampling; Di = number of households in each sector; and
D = number of households in the city of São Paulo in 1991.
f1 = [(72*Di)/D] (5)
Where:
f1 = fraction of second stage sampling;
Di = number of households in each sector; and
D = number of households in the city of São Paulo in 1991.
The minimum number of households drawn in the second stage, calculated by the mean (5.882/72=81.69), was approximated to 90. The sampling fraction of the second stage is equal to Equation 6, and the final fraction of sampling, expressed by Equation 7, corres-ponds to the probability that a household belongs to the sample drawn3. The updating of
the addresses was carried out by the PNAD 1998 lists.
f2 = 90/Di1998 (6)
Where:
f2 = fraction of second stage sampling; and Di = number of households in each sector.
f = f1*f2 (7)
Where:
f = final fraction of sampling;
f1 = sampling fraction of the first stage; and f2 = fraction of the second stage.
The total number of addresses of each census tract was divided into segments of ten households and, in each sector, nine segments were drawn. Ninety households per sec-tor were visited. All individuals considered eligible according to the research objectives were identified and invited to participate in the interviews. At the end of the first phase of the field work, 1,568 interviews had been conducted. Chart 1 shows the composition of
Chart 1. Sampling plan and results. Health, Wellbeing and Aging Project, 2000.
Stage Drawn unit Number Probability(f)
First Census tract 72 (72.dj1991)/total dj1991
Second Addresses 90 90/dj1998)
Results Elderly 1.852 f = f1.f2
Interviews 1.568
Elderly/address = 0,2858 = 28,58% Answer rate = 1.568/1.852 = 0,8467 = 84,67%
the sample according to the draw stages and the results that remained within the limits set in the planning phase.
WEIGHTING
To compensate for unequal probabilities
The updating of the mailing lists introduced changes in the drawability in the second stage (f2), resulting in different sampling fractions (fj) among the 72 census tracts. This pro-blem was compensated by the use of weights calculated by the inverse of fj, obtained by Equation 84:
p D
D d D j
j
j j
j = ⋅ ⋅
∑
−
72
1
’
(8)
Where:
pj = sample weight relative to stratum j;
Dj = number of households registered in the 1991 census;
d = number of households to be visited in stratum j; and
Dj’ = number of households registered in the household counting operation performed at the time of the sample draw, in each j-th census tract.
To compensate for lack of response
To adjust the distribution of the sample to the composition of the population according to age and gender, weights (ph) were calculated for each stratum, using equation 9:
p N p h
h h j =
∑
, (9)Where:
ph = weight calculated by stratification a posteriori in stratum h;
Nh = number of elements in the h-th stratum recorded by the last demographic census; and
ph.j = sum of sample weights (pj) and total of elements recorded in each stratum h.
Final weight added to the element file
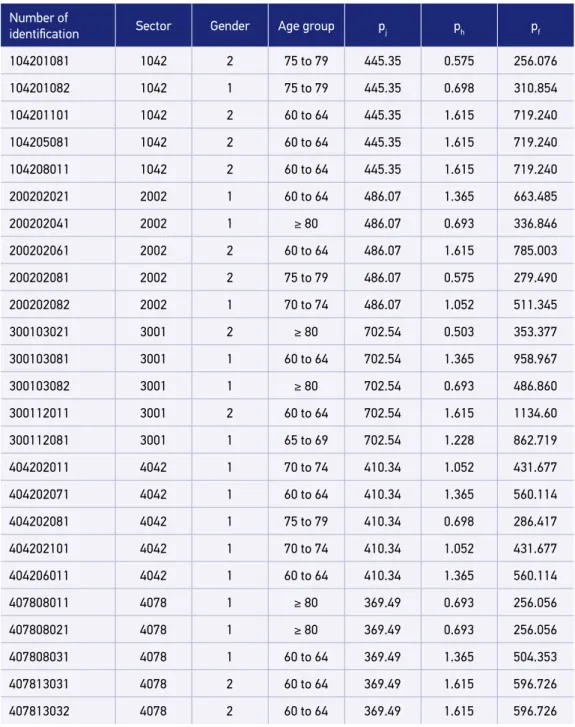
(pj.ph). Every five records in the file have the same weight corresponding to the effect of the design (sector), but depending on the stratum to which it belongs, this factor is chan-ged. In the last column are the values of the final weight (pf ), which should always be con-sidered in the calculation of the final estimates, and their respective confidence intervals.
Figure 2. Excerpt from the file, with fields of the sampling plan, partial weights and final weight.
Number of
identification Sector Gender Age group pj ph pf
104201081 1042 2 75 to 79 445.35 0.575 256.076
104201082 1042 1 75 to 79 445.35 0.698 310.854
104201101 1042 2 60 to 64 445.35 1.615 719.240
104205081 1042 2 60 to 64 445.35 1.615 719.240
104208011 1042 2 60 to 64 445.35 1.615 719.240
200202021 2002 1 60 to 64 486.07 1.365 663.485
200202041 2002 1 ≥ 80 486.07 0.693 336.846
200202061 2002 2 60 to 64 486.07 1.615 785.003
200202081 2002 2 75 to 79 486.07 0.575 279.490
200202082 2002 1 70 to 74 486.07 1.052 511.345
300103021 3001 2 ≥ 80 702.54 0.503 353.377
300103081 3001 1 60 to 64 702.54 1.365 958.967
300103082 3001 1 ≥ 80 702.54 0.693 486.860
300112011 3001 2 60 to 64 702.54 1.615 1134.60
300112081 3001 1 65 to 69 702.54 1.228 862.719
404202011 4042 1 70 to 74 410.34 1.052 431.677
404202071 4042 1 60 to 64 410.34 1.365 560.114
404202081 4042 1 75 to 79 410.34 0.698 286.417
404202101 4042 1 70 to 74 410.34 1.052 431.677
404206011 4042 1 60 to 64 410.34 1.365 560.114
407808011 4078 1 ≥ 80 369.49 0.693 256.056
407808021 4078 1 ≥ 80 369.49 0.693 256.056
407808031 4078 1 60 to 64 369.49 1.365 504.353
407813031 4078 2 60 to 64 369.49 1.615 596.726
EFFECTS OF DESIGN
The sample draw plan defines the census tract as the primary sampling unit 5.
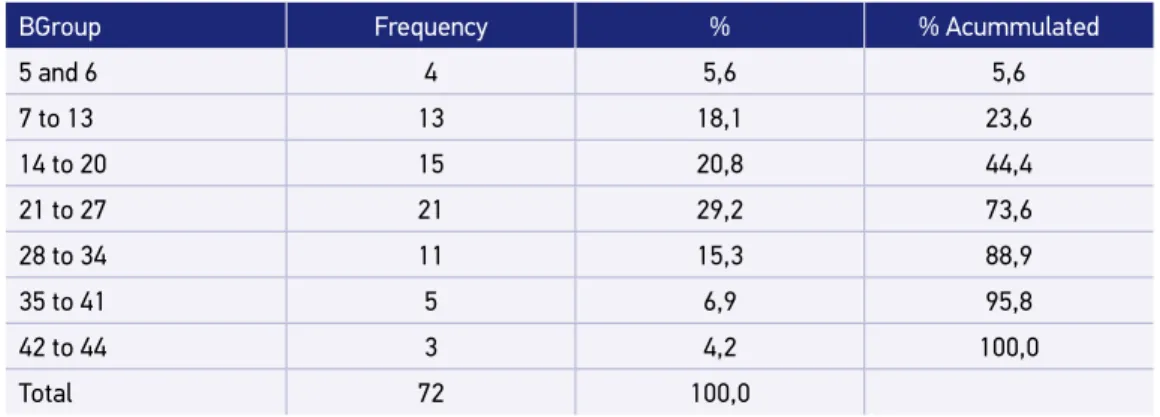
As the results of Tables 2 and 3 show, there is variability between the number of interviews achieved in each sector and between the estimated results for some socio-demographic variables 6.
As indicated by the results, the values of the effects of the design(deff ) for gender only are close to 1, since the composition of the elderly population within the census tract in this characteristic is natural and is not impacted by cultural or economic influences. However, for the other variables, all the results show deff greater than 1, indicating possible simila-rities in the internal distributions and differences between the census tracts. The extreme value for the economic variable is confirmed by several studies carried out on the effect of the design in national and international epidemiological surveys4,5.
Thus, the final sample resulted in 2,143 people aged 60 years or older. It was compo-sed of two segments: the first one, resulting from draw, corresponded to the probability sample formed by 1,568 interviews; the other one, made up of 575 residents in the districts where the previous interviews took place, accounts for the increase made to compensate the mortality in the population of more than 75 years, and to complete the desired number of interviews in this age group.
Table 2. Distribution of the number of interviews according to the census tract.
BGroup Frequency % % Acummulated
5 and 6 4 5,6 5,6
7 to 13 13 18,1 23,6
14 to 20 15 20,8 44,4
21 to 27 21 29,2 73,6
28 to 34 11 15,3 88,9
35 to 41 5 6,9 95,8
42 to 44 3 4,2 100,0
Total 72 100,0
Table 3. Values of the design effect for sociodemographic variables.
Variable Deff (no weight) Deff (with weight)
Gender 0,847 1,011
Age group 1,388 1,814
Work 1,349 1,293
Economic 3,691 3,653
THE CONTINUATION...
Five years after the first data collection, it was decided to revisit the people interviewed in 2000 - which only occurred in 2006 - thus materializing the original SABE Project propo-sal to be a longitudinal study in all participating countries. For various reasons, this conti-nuation could not be carried out in all countries, in the manner foreseen.
In 2006 and 2010, the second and third collections of the cohort A were constituted. Initially a search was made in the databases of municipal and state deaths. Next, the elderly were located through the addresses already known because of the previous interview. In the case of changes, information was sought in the vicinity and in nearby commercial esta-blishments, such as pharmacies, greengrocers and real estate offices.
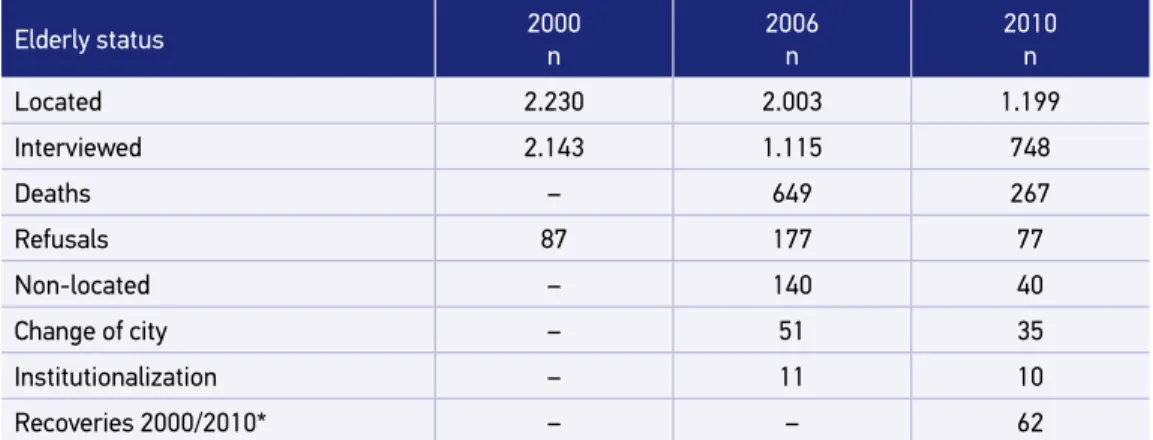
Of the 2,143 elderly interviewed in 2000, 1,115 were located and re-interviewed in 2006 and 748 in 2010 (cohort A). The differences can be seen in Table 4.
NEW COHORTS: B AND C
It is believed that the characteristics of elderly cohorts are very different from each other. For this reason, it is important that the surveys follow the cohorts over time in order to capture the variations of responses to the patterns associated with those chan-ges. Longitudinal studies that continue to add new cohorts at the base of the age scale and to be representative of the study population are the ones best able to respond to these questions7.
Thus, in parallel to the research with cohort A, new cohorts were introduced, compo-sed of people aged 60 to 64 years, living in the urban area of the city of São Paulo in 2006 and 2010.
Table 4. Follow-up of cohort A in São Paulo in the years 2000, 2006 and 2010.
Elderly status 2000 n 2006 n 2010 n
Located 2.230 2.003 1.199
Interviewed 2.143 1.115 748
Deaths – 649 267
Refusals 87 177 77
Non-located – 140 40
Change of city – 51 35
Institutionalization – 11 10
Recoveries 2000/2010* – – 62
In 2004, the number of people aged 60 to 64 in the city was 310,694, corresponding to 2.9% of the population, according to preliminary estimates of population totals released by IBGE8.
The sample for cohort B was composed of 400 individuals, which defines the sampling fraction 400/310,694=0.0012874. In order to calculate the sample size, the prevalence of hypertension in 2000 was equal to 50%9; the design effect equal to 1.5; and margin of error
of 7%. Corrections to the expected rate of response (75%) and mortality equal to 2%4,5
were introduced.
For the household draw, the method of sampling by conglomerates in two stages, under the PPS criterion, was used. The units of first and second stages were, respectively, the cen-sus tract and the household. Forty sectors were drawn in the first stage, observing the cri-terion by which the number of primary sampling units (PSUs) should be ≥30, and the mini-mum number of interviews per sector equal to 400/40 = 10.
The minimum number of households drawn by sector was 118, calculated by Equation 10, whose terms correspond to 10 interviews per sector. The ratio 10/1 is the inverse of 1 elderly for every 10 households, and 0.85 is the expected rate of success of the location and interviewing operation in the permanent households that were selected.
d = (10*10/1)*(0,85)-1 (10)
Where:
D = number of households drawn by sector.
For all of the 40 sectors, 4,720 households were drawn.
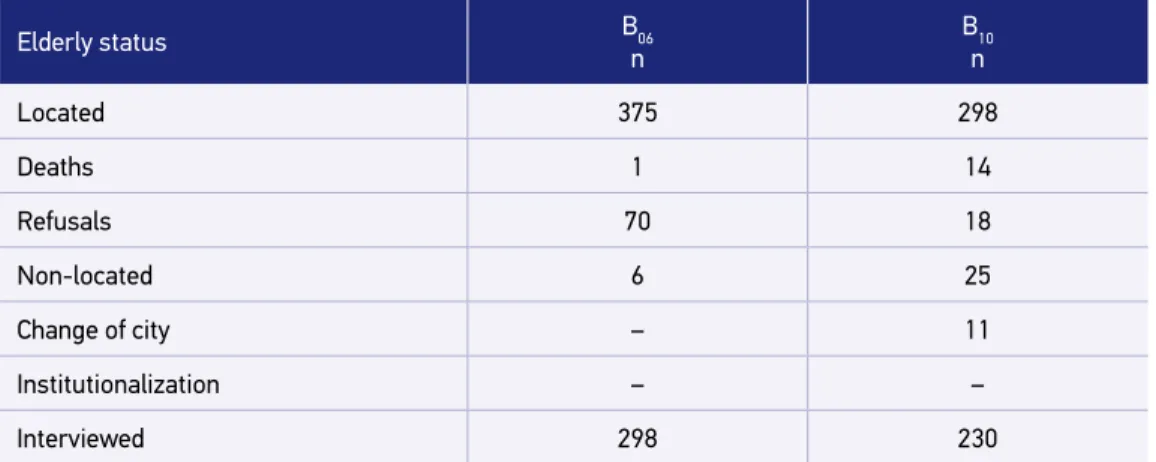
At the end of the process, 375 people were identified within the established criterion (60 to 64 years), and 298 interviews were performed (Table 5).
Table 5. Outcome of elderly status of cohort B in 2006 and 2010.
Elderly status B06
n
B10 n
Located 375 298
Deaths 1 14
Refusals 70 18
Non-located 6 25
Change of city – 11
Institutionalization – –
Interviewed 298 230
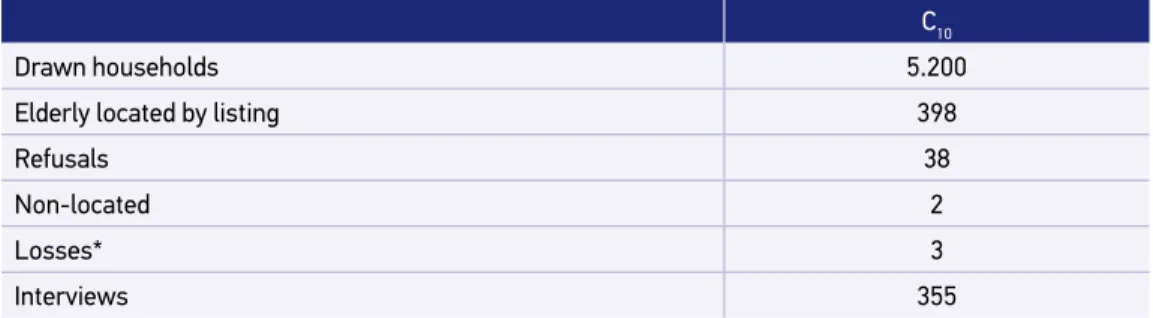
For the determination of sample of the cohort C, the same process was used, conside-ring the population of 413,563, aged 60 to 64 in 2010, according to census data. The result is presented in Table 6.
WEIGHTING
The applied methods of estimation and weighting corresponded to the use of simple, unbiased estimators and reason estimators, which considered, in all cases, the calculation of the expansion factors of the sample design employed - that is, the selection probabilities applied in each step and the no answers. The variables gender and age were also conside-red, given the differences in mortality between men and women and the over dimensioning of the population aged 75 years or over. At the end, a factor was obtained for each indivi-dual in the sample, summarizing all the elements mentioned in the sample design and the strata considered.
In addition to the longitudinal analysis and the monitoring of the population, the SABE study design allows cross-sectional analyzes in each new collection (every five years on average), being the representative sample of the population in the year of interest (2006 or 2010). For this purpose, weight adjustments were performed and are described below.
ANALYSIS OF ELDERLY POPULATION IN 2006 (A
06+B
06)
The 2006 total sample consisted of the cohort A elderly interviewed in 2000, located and re-interviewed in 2006, and the new cohort B.
The weights due to sample design, absence of response and unequal probabilities in selection refer to the sample of 2000. Thus, the elderly of the A06 cohort represent an elderly population of São Paulo referring to 2000, who did not move, did not die and agreed to be interviewed in 2006. That made it a bit distant from the city’s senior population in 2006.
Table 6. Result of the sample process of cohort C, in 2010.
C10
Drawn households 5.200
Elderly located by listing 398
Refusals 38
Non-located 2
Losses* 3
Interviews 355
In order to compensate for unequal probabilities in the sectors, it would be very difficult to change the weights, since they refer to the households counted at the time of the sample draw in 2000, in each census tract. On the other hand, they could not simply be discarded, which is why they were retained.
To compensate for the lack of response, the losses between 2000 and 2006 (deaths, refu-sals, no location etc.) can be considered as lack of response. Based on the 2006 population estimates, Equation 11 was applied, in which the denominator weights refer to each of the 1,115 re-interviewed, calculated in each stratum:
p N
p
h h
h j =
∑
,p N
p
h h
h j
=
∑
,(11)
Where:
ph = final value of the sample weighting;
Nh = population in the stratum in question; and
ph,j = sample weights in stratum h, sector j.
In the age group of 60 to 64 years, which corresponds to the B06 contingent, we did not substitute the weights as in the others. The final weights were only adjusted for the new population estimates.
Thus, the new weights allow the almost exact reproduction of the age structure of the city in 2006, leaving no doubt about the representativeness of the expanded sample.
ANALYSIS OF ELDERLY POPULATION IN 2010 (A
10+B
10+C
10)
In order to study the elderly population living in the city of São Paulo in 2010, the A, B and C cohorts can be added with due weight. A similar procedure to that described above was performed with the total sample of 2010, composed of the elderly interviewed in 2000, 2006 and 2010 from cohort A, and of the respondents in 2006 from cohort B, who were located and re-interviewed in 2010, and by the new cohort C.
The weights due to sample design, lack of response and unequal probabilities in selection refer to the 2000 and 2006 samples. Thus, the elderly of the A10 and B10 cohorts represent the elderly population of São Paulo in 2000 and 2006 that did not move, did not die and agreed to be interviewed in 2010. This makes the population a little bit distant from that of 2006.
In order to compensate for unequal probabilities in the sectors, it would be very diffi-cult to change the weights referring to the households counted at the time of the draw of the 2000 and 2006 samples in each census tract, which is why the weights were maintained.
p N p
h h
h j =
∑
,(12)
Where:
ph = final value of the sample weighting;
Nh = population in the stratum in question; and
Ph,j = sample weights in stratum h, sector j.
The new weights allow the almost exact reproduction of the age structure of the city in 2010, leaving no doubt about the representativeness of the expanded sample.
QUESTIONNAIRES
The original 2000 questionnaire was developed at PAHO with the assistance of experts from various universities and researchers from other similar studies conducted in different parts of the world. The instrument consisted of 11 sections that covered the main aspects related to aging studies: personal information, cognitive assessment, health status, func-tional status, medications, use and access to health services, social and family support net-work, income, housing conditions, anthropometry and functional tests (balance, flexibility and mobility). The questionnaires applied in 2006 and 2010 maintained the central axis of the instrument used in 200010, and its sections were revised and updated. Also it received
the addition of instruments such as: functional independence measure (FIM)11; sexuality,
quality of life assessment through SF-12® (Quality Metrics License nº R10-060608-36374)12;
evaluation of family functionality (Adaptation, Partnership, Growth, Affection, Resolve - family APGAR)13; mistreatment; assessment of the overload of family carers’14,15; evaluation
of deaths by means of “verbal autopsy”16; and evaluation of institutionalization. An
exami-nation of the oral cavity was carried out to verify the dental situation by means of the index of decayed, missing and filled teeth (DMFT) and possible soft tissue lesions.
In Annex 1 the structure of the data collection instrument used in the three periods of study is available, followed by the references related to it.
EVALUATION OF DEATHS
Deaths occurred between 2000, 2006 and 2010 were verified based on the information reported by relatives or neighbors, during a home visit, at the time of the subsequent data collection, in which case having a “verbal autopsy” performed16. Subsequently, these data
EVALUATION OF INSTITUTIONALIZATIONS
As in the evaluation of mortality, the occurrence of institutionalization between the years 2000, 2006 and 2010 was verified from the information reported by family members or neighbors, during a home visit, at the time of the subsequent data collection, having fil-led a specific instrument of characterization of the situation. These data allow the analysis of the predictive factors of institutionalization, little known in our country.
EVALUATION OF FRAILTY SYNDROME
Frailty is one of the most important syndromes that affect the elderly, and its study has been the target of many international research. Since 2006, this syndrome has been an important outcome of the SABE Study, given the scarcity of information about it at the time. The longitudinal design of the study allows the analysis of its main determinants,their impact on the quality of life of the elderly and their families, the care costs involved and the use of social and health services. Among the existing models, the SABE researchers opted for the one proposed by Fried et al. (2001)17. Thus, it was decided to add in this article the
description of the methodology used for the operationalization of the phenotype proposed in the adopted model, which uses the measurement of five components. The presence of one or two indicate the condition of pre-frailty, and the presence of three or more is consi-dered frailty. To be classified as “non-frail” it is necessary that the elderly does not present any of the following components:
1. Unintentional weight loss: a subjective question was asked (“In the last year, did you lose three or more pounds of weight without a diet?”). If yes, it was punctuated in this component;
2. Referred fatigue: obtained through two questions from the Center for Epidemiological Studies - Depression (CES-D), validated for Brazilian elderly by Batistoni, Neri and Cupertino (2007)18;
• “How often, in the last week, did you feel that everything you did required a lot of effort?”;
• “How often, in the last week, did you feel that you could not carry on with your things?”;
The answers to both questions were: 0= rarely or no time (<1 day); 1= some part of the time (1 to 2 days); 2= a moderate part of the time (3 to 4 days); or 3= the whole time. Elderly who answered 2 or 3 on at least one of the two questions positively scored for the component;
4. low walking speed: obtained by the three-meter walking test, part of the Short Physical Performance Battery (SPPB)19. The elderly who were in the highest quintile
of the distribution, stratified by gender and the median value of height, were scored for this component;
5. low level of physical activity: identified by the short (translated) version of the International Physical Activity Questionnaire (IPAQ)20-22, which evaluates three
specific types of activities: walking, of moderate and vigorous intensity; and leisure, domestic and/or work, in which an estimate of the weekly caloric expenditure (kcal) is obtained. The elderly in the lowest quintile of caloric expenditure, stratified by gender, were scored for this component.
The way force, velocity and physical activity were assessed can be observed in Chart 2. The SABE Study, like any longitudinal study, had changes along its route, either because in the first phase we were in line with the international coordination of the project and other partners, by the appearance of new instruments or, also, because new partners saw in it an opportunity to develop their research. Thus, the evolution of the study in the three collections so far can be followed in Chart 3.
Chart 2. Cut-off points adopted for the operation of frailty phenotypes - hand grip strength, walking speed and physical activity level. Health, Wellbeing and Aging Study 2010.
Component Operational definition
Reduction in strength
20% with lower values in manual grip strength, by gender and BMI (kg/m2):
Men
Strength ≤ 24,5 kg for BMI ≤ 24,36 kg/m2 Strength ≤ 25 kg for BMI 24,37 to 26,99 kg/m2 Strength ≤ 26,5 kg for BMI 27,0 to 29,62 kg/m2 Strength ≤ 30 kg for BMI > 29,62 kg/m2
Women
Strength ≤ 14 kg for BMI ≤ 25,01 kg/m2 Strength ≤ 14 kg for BMI 25,02 to 28,39 kg/m2 Strength ≤ 15,5 kg for BMI 28,40 to 32,55 kg/m2 Strength ≤ 16 kg for BMI > 30,55 kg/m2
Low speed walking
20% slower in SPPB walking test
Men
> 5,0 seconds for height ≤ 1,66 m > 4,1 seconds for height >1,66 m
Women
> 5,2 seconds for height ≤ 1,52 m > 4,7 seconds for height >1,52 m
Low level of physical activity
20% with lower caloric expenditure, according to gender Men = 457,2 kcal
Women = 413,6 kcal
Chart 3. Evolution of the Health, Wellbeing and Aging Study between 2000 and 2010.
Phase Measures
Baseline
2000 and 2001
1. questionnaire;
2. anthropometry: weight, height, wrist and hip circumference; 3. balance, mobility and flexibility.
Follow-up 2006
1. questionnaire;
2. anthropometry: weight, height, wrist and hip circumference; 3. balance, mobility and flexibility.
4. blood pressure; 5. glycoste.
Follow-up 2010 to 2012
1. questionnaire;
2. anthropometry: weight, height, wrist and hip circumference; 3. balance, mobility and flexibility.
4. blood pressure;
5. fasting blood sample Þ haematological/biochemical tests; 6. DNA extraction + aliquot of serum stored at -80 °C; 7. HIV test (Elisa);
8. uri-color check;
9. brain magnetic resonance imaging in the participants who accept, to evaluate the neuroimaging associated with the cerebral structures;
10. evaluation of immune response by immunoassay tests; 11. accelerometry.
2015
1. questionnaire; 2. anthropometry 3. blood pressure;
4. haematological/biochemical tests;
5. DNA extraction + aliquot of serum stored at -80 °C; 6. HIV test (Elisa);
7. urine;
8. brain magnetic resonance imaging in the participants who accept, to evaluate the neuroimaging associated with the cerebral structures;
9. evaluation of immune response by immunoassay tests; 10. accelerometry;
11. dual energy x-ray absorciometry (DXA); 12. spirometry;
13. echocardiography (ECG).
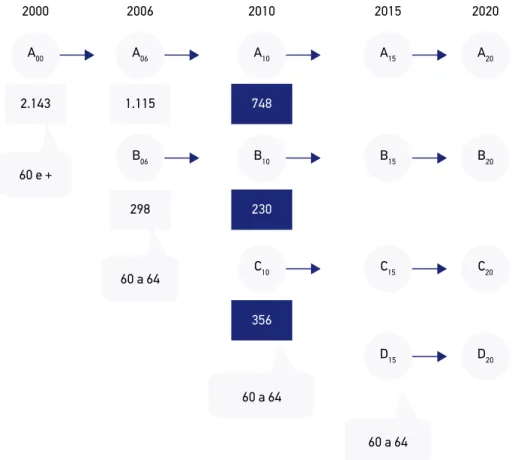
Figure 3 shows the complete study design. It is worth noting that it allows, in addition to the longitudinal analyzes obtained by the follow-up of the cohorts of interest, to identify the changes that have been occurring in the aging process from the comparison of cohorts A, B and C from 60 to 64 years, since these represent dif-ferent generations (those born before World War II, those born during the war and those born after it).
Figure 3. Overview of the Health, Wellbeing and Aging Study, conducted in the city of São Paulo in 2000, 2006 and 2010.
A: cohort aged 60 years and over, interviewed in 2000. Their survivors in 2006, 2010 and 2015 constitute groups A06, A10 and A15; B: cohort aged 60-65 year old, interviewed initially in 2006. Survivors are B10, interviewed in 2010, and B15 in 2015; C: cohort aged 60-65 year old, interviewed in 2010. Their survivors form the C15 cohort, to be interviewed in 2015; D: cohort aged 60 to 65 years, to be interviewed in 2015.
A00 2000
2.143
60 e +
1.115
298
60 a 64 2006
A06
B06
748
356
60 a 64 230 2010
A10
B10
C10
2020
A20
B20
C20
D20
60 a 64 2015
A15
B15
C15
D15
1. Albala C, Lebrão ML, León Díaz EM, Ham-Chande R, Hennis AJ, Palloni A, et al. The Health, Well-Being, and Aging (“SABE”) survey: methodology applied and profile of the study population. Rev Panam Salud Publica 2005; 17(5-6): 307-22.
2. Silva NN. Amostragem probabilística: um curso introdutório. 2a ed. São Paulo: EDUSP; 2001. 128 p.
3. Silva NN da, Cunha TN da, Quintanilha JA. Amostra mestra e geoprocessamento: tecnologias para inquéritos domiciliares. Rev Saude Publica 2003; 37(4): 494-502. 4. Kish L. Selected papers. New York: John Wiley and
Sons; 2003.
5. Kish L. Survey Sampling. New York: John Wiley and Sons; 1965. 274 p.
6. Skinner CJ, Holt D, Smith TMF. Analysis of complex survey. Chichester: John Wiley and Sons; 1989. 7. Nacional Research Council. Preparing for an Aging World:
The case for Cross-National Research. Washington, D.C.: National Academies Press (US); 2001.
8. Instituto Brasileiro de Geografia e Estatística (IBGE). Estimativas de população para 2008. 2008. [Internet]. Disponível em: http://www.ibge.gov.br/home/ estatistica/populacao/estimativa2008/default.shtm (Acessado em 05 de junho de 2017).
9. Lebrão ML, Laurenti R. Saúde, bem-estar e envelhecimento: o estudo SABE no Município de São Paulo. Rev Bras Epidemiol 2005 Jun; 8(2): 127-41. 10. Lebrão ML. SABE - Saúde, bem-estar e envelhecimento. O Projeto Sabe no município de São Paulo: uma abordagem inicial. Brasília: Organização Pan-Americana da Saúde; 2003. 11. Riberto M, Miyazaki MH, Jucá SSH, Sakamoto H,
Potiguara P. Validação da Medida de Independência Funcional. Acta Fisiatr 2004; 11(2): 72-6.
12. Gandek B, Ware JE, Aaronson NK, Apolone G, Bjorner JB, Brazier JE, et al. Cross-validation of item selection and scoring for the SF-12 Health Survey in nine countries: results from the IQOLA Project. International Quality of Life Assessment. J Clin Epidemiol 1998 Nov; 51(11): 1171-8.
13. Duarte YAO. Família: rede de suporte ou fator estressor: a ótica de idosos e cuidadores familiares. São Paulo: s.n.; 2001. 14. Zarit SH, Zarit JZ. The memory and behavior problems
checklist - 1987R and the burden interview. 1987. 15. Scazufca M. Brazilian version of the Burden Interview
scale for the assessment of burden of care in carers of people with mental illnesses. Rev Bras Psiquiatr 2002 Mar; 24(1): 12-7.
16 World Health Organization. Verbal autopsy standards: ascertaining and attributing causes of death. Geneva: WHO; 2007.
17. Fried LP, Tangen CM, Walston J, Newman AB, Hirsch C, Gottdiener J, et al. Frailty in older adults: evidence for a phenotype. J Gerontol A Biol Sci Med Sci 2001 Mar; 56(3): M146-56.
18. Batistoni SST, Néri AL, Cupertino AP. Validade e confiabilidade da versão Brasileira da Center for Epidemiological Scale - Depression (CES-D) em idosos Brasileiros. Psico-USF 2010 Apr; 15(1): 13-22. 19. Pfeffer RI, Kurosaki TT, Harrah CH, Chance JM, Filos
S. Measurement of functional activities in older adults in the community. J Gerontol 1982 May; 37(3): 323-9. 20. Guedes DP, Lopes CC, Guedes JERP. Reprodutibilidade e validade do Questionário Internacional de Atividade Física em adolescentes. Rev Bras Med do Esporte 2005 Apr; 11(2): 151-8.
21 Benedetti TRB, Mazo GZ, Barros MVG de. Application of the International Physical Activity Questionnaire (IPAQ) for evaluation of elderly women: concurrent validity and test-retest reproducibility. Rev Bras Ciência e Mov 2004; 12(1): 25-34.
22. Benedetti TRB, Antunes PC, Rodriguez-Añez CR, Mazo GZ, Petroski ÉL. Reprodutibilidade e validade do Questionário Internacional de Atividade Física (IPAQ) em homens idosos. Rev Bras Med do Esporte 2007 Feb; 13(1): 11-6. 23. Icaza MG, Albala C. Minimental State Examinations
(MMSE) del estudio de demencia en Chile: Análisis estadístico. Washington, D.C.; 1999.
24. Folstein MF, Folstein SE, McHugh PR. “Mini-mental state”. A practical method for grading the cognitive state of patients for the clinician. J Psychiatr Res 1975 Nov; 12(3): 189-98. 25. Brucki SMD, Malheiros SMF, Okamoto IH, Bertolucci
PHF. Dados normativos para o teste de fluência verbal categoria animais em nosso meio. Arq Neuropsiquiatr 1997; 55(1): 56-61.
26. Atalaia-Silva KC, Lourenço RA. Tradução, adaptação e validação de construto do Teste do Relógio aplicado entre idosos no Brasil. Rev Saude Publica 2008 Oct; 42(5): 930-7. 27. Yesavage JA, Sheikh JI. Geriatric Depression Scale(GDS): recent evidence and development of shorter violence. Clin Gerontol 1986; 5(1-2): 165-73.
28. Paradela EMP, Lourenço RA, Veras RP. Validação da escala de depressão geriátrica em um ambulatório geral. Rev Saude Publica 2005 Dec; 39(6): 918-23. 29. Kaiser MJ, Bauer JM, Ramsch C, Uter W, Guigoz Y, Cederholm
T, et al. Validation of the Mini Nutritional Assessment short-form (MNA-SF): a practical tool for identification of nutritional status. J Nutr Health Aging 2009 Nov; 13(9): 782-8. 30. Carvalho C, Manso AC, Escoval A, Salvado F, Nunes
C. Tradução e validação da versão portuguesa do Geriatric Oral Health Assessment Index (GOHAI). Rev Port Saúde Pública 2013 Jul; 31(2): 153-9. 31. Nunes DP, Duarte YAO, Santos JLF, Lebrão ML.
Screening for frailty in older adults using a self-reported instrument. Rev Saude Publica 2015; 49: 1-9. 32. Selzer ML. The Michigan alcoholism screening test:
the quest for a new diagnostic instrument. Am J Psychiatry 1971 Jun; 127(12): 1653-8.
33. Hirata ES, Almeida OP, Funari RR, Klein EL. Validity of the Michigan Alcoholism Screening Test (MAST) for the detection of alcohol-related problems among male geriatric outpatients. Am J Geriatr Psychiatry 2001 Jan; 9(1): 30-4. 34. Fonda S, Herzog R. Documentation of physical functioning measured in the Health and Retirement Study and the asset and health dynamics among the oldest old study. Ann Arbor 2004.
35. Katz S, Ford AB, Moskowitz RW, Jackson BA, Jaffe MW. Studies of Illness in the Aged. The Index of ADL: a standardized measure of biological and psychosocial function. J Am Med Assoc 1963 Sep 21; 185(12): 914-9. 36 Lawton MP, Brody EM. Assessment of older people: self-maintaining and instrumental activities of daily living. Gerontologist 1969 Jan; 9(3): 179-86. 37. Guralnik JM, Simonsick EM, Ferrucci L, Glynn RJ, Berkman
LF, Blazer DG, et al. A short physical performance battery assessing lower extremity function: association with self-reported disability and prediction of mortality and nursing home admission. J Gerontol 1994 Mar; 49(2): M85-94. Received on: 04/23/2015
Section 2000 2006 2010 A Personal information 1. age; 2. nationality; 3. ethnicity; 4. schooling;
5. housing condition (alone or accompanied);
6. Changes in family housing or structure in the last five years;
7. religiosity; 8. nuptiality.
1. greater detail in changes related to housing or family structure in the last five years;
2. questions related to religiosity.
1. maintenance of the 2006 additions.
B Cognitive evaluation
1. Memory self-assessment MEEM abbreviated 23; 2. Pfeffer’s questionnaire for functional activities19.
1. Inclusion of the full MEEM24 and verbal fluency test25.
1. inclusion of the clock test26.
C
Health state
1. Chronic self-reported diseases (SAH, DM, heart disease, cerebrovascular disease, chronic respiratory disease, joint disease); 2. occurrence of falls and their consequences;
3. sensory alterations (visual and auditory);
4. Geriatric Depression Scale- short version27,28;
5. Mini Nutritional Assessment29; 6. Geriatric Oral Health Assessment Index (GOHAI)30; 7. health habits (smoking and alcohol intake);
8. previous conditions (early conditions).
1. review and expansion of items related to chronic diseases;
2. assessment of frailty17; 3. evaluation of self-reported frailty31;
4. evaluation of chronic pain; 5. evaluation of fecal and urinary incontinence and constipation;
6. evaluation of the presence of skin lesions;
7. Michigan Alcoholism Screening Test (MAST)32,33; 8. International Physical Activity Questionnaire (IPAQ)20-22;
9. sexuality; 10. vaccination;
11. quality of life (SF12)12.
1. maintenance of the 2006 additions and inclusion of: a. immunological evaluation;
b. sexually transmitted diseases and hepatitis; c. sleep evaluation; d. anemia;
e. nutritional assessment.
D
Functional state
1. mobility assessment 34; 2. Katz Functional Independence Assessment (ADLs)35;
3. Evaluation of instrumental activities of daily living of Lawton (IADLs)36;
4. use of assistive technology; 5. aid received in the performance of ADLs.
1. maintenance of items used in 2000 and inclusion of: a. functional independence measure (FIM);
b. assessment of advanced activities of daily living (AADLs);
c. information related to the aid received.
1. maintenance of the 2006 additions.
E
Medications
1. listing of all medications used, prescriber, means of acquisition and cost.
1. greater detail regarding the use of medications; 2. information on
administration and storage of medications.
1. maintenance of the 2006 additions.
Annex 1. Collection instruments in 2000, 2006 and 2010.
Annex 1. Continuation.
Section 2000 2006 2010
F Use and access to health services
1. health services in the four months prior to the interview.
1. adaptation to the Brazilian reality and expansion of information with emphasis on inequities and access difficulties.
1. maintenance of the 2006 additions;
2. Inclusion of home care.
G
Family and social support network
1. evaluation of the home support network; 2. evaluation of the extradomiciliar support network, including children who do not live with the elderly, brothers and sisters, other relatives and friends; 3.Community contribution: aid provided and received.
1.inclusion of assessment of family functionality through family APGAR 13 for the elderly and
caregivers;
2. extension of information related to the aids provided and received by the elderly.
1. maintenance of the 2006 additions.
H
Labor history and income
1. current and past labor history;
2. occupational disease; 3. sources of income; 4.perception of sufficiency of income for own expenses.
1. maintenance of items from 2000.
1. maintenance of items from 2000.
J Housing conditions
1. type and conditions of housing.
1.expansion of information regarding housing and environment;
2. environmental risk assessment.
1. Maintenance of 2006 additions;
2. inclusion of evaluation of the presence of domestic animals.
K
Anthropometry
1. measurement of limbs and skinfolds;
2. evaluation of manual gripping force (dynamometer).
1. maintenance of items
from 2000. 1. maintenance of items from 2000.
L
Functional tests
1. balance, mobility and flexibility tests.
1. maintenance of tests carried out in 2000 and inclusion ofShortPerformance Score(SPS)37.
1. maintenance of 2006 additions;
M
Mistreatment –
1.inclusion of mistreatment assessment using the Puerto Rican Elderly: Health Condiciones de salud de los adultos de edad mayor em Puerto Rico(PRECHO).
1. maintenance of 2006 additions;
N Caregiver evaluation
–
1. assessment of family caregivers overload - Zarit Scale 14,15;
2. Family APGAR to caregivers13.
1. maintenance of the 2006 additions and greater detailing of the caregivers’ profile.