Universidade Trás-os-Montes e Alto Douro
Influence of sequential fermentations with
non-Saccharomyces and non-Saccharomyces cerevisiae on the
colour of red winemaking
Versão Final
Dissertação de mestrado em Engenharia Agronómica
Cátia Martins Leitão
Professor António Morata
Professor Virgílio Falco
Universidade Trás-os-Montes e Alto Douro
Influence of sequential fermentations with non-Saccharomyces and
Saccharomyces cerevisiae on the colour of red winemaking
Versão Final
Dissertação de mestrado em Engenharia Agronómica
Cátia Martins Leitão
Professor António Morata Professor Virgílio Falco
Composição do Júri: ___________________________________________________________________________ ___________________________________________________________________________ ___________________________________________________________________________ ___________________________________________________________________________ Vila Real, 2019
As doutrinas apresentadas neste trabalho são da exclusiva responsabilidade do autor. É autorizada a reprodução parcial desta tese apenas para efeitos de investigação, mediante
declaração escrita do interessado, que a tal se compromete. Universidade Trás-os-Montes e Alto Douro
O autor:
__________________________________ Cátia Martins Leitão
Orientação
Orientador
___________________________________________________________________________ Professor Antonio Morata
Universidad Politécnica de Madrid
Co-orientador
Professor Virgílio Falco
ix
Acknowledgements
Gostaria de começar por expressar o meu agradecimento ao professor António Morata pela oportunidade de poder trabalhar na sua equipa e pelo conhecimento que me foi transmitindo ao longo das aulas. Agradeço também à professora Maria Antónia Bañuelos por toda disponibilidade e ajuda demonstrada ao longo da realização deste trabalho e pela simpatia que sempre teve comigo.
Um muito obrigada ao professor Virgílio Falco por ter aceite ser co-orientador deste trabalho, pelo tempo dedicado durante a revisão e pelas críticas ao mesmo.
Obrigada a todos os professores que fizeram parte do meu percurso académico. Um especial agradecimento ao professor Gilberto Igrejas pela amizade e conselhos e à professora Elena Benavente pela disponibilidade, ajuda e simpatia demonstrada. Os dois foram fundamentais para que este trabalho se proporcionasse.
Quero também demonstrar o meu sincero agradecimento aos elementos da equipa do laboratório de microbiologia e aos elementos da equipa do laboratório de tecnologia de alimentos da Escuela Técnica Superior de Ingeniería que tive o prazer de conhecer. Obrigada pela simpatia, disponibilidade e auxílio ao longo da minha experiência laboratorial.
Ao Derek, à Terah e ao Carlos, o meu sincero obrigada. Sem vocês a experiência teria sido muito diferente (Ta-ka-ra-tak!!). Obrigada pelo companheirismo, pelo apoio e, mais importante, pela vossa amizade.
Um enorme obrigada à minha família pelo apoio em todas as minhas decisões, mesmo que isso lhes dê muitas dores de cabeça. Obrigada Sílvia, pelo investimento contínuo que muito contribui para aquilo que sou. Obrigada por nunca me falhares.
Ao Nuno. Obrigada pelo apoio constante e por me tornares numa pessoa melhor todos os dias. Por fim, obrigada a todos aqueles que celebram as minhas vitórias. Os meus amigos. Aos velhos e aos novos, aos nacionais e aos internacionais, aos que estão mais perto e àqueles que só a distância física separa. Existe um bocadinho de cada um de vocês em mim. Obrigada por tudo aquilo que bem ou mal me ensinam.
x
xi
Abstract
Selected strains of non-Saccharomyces can positively contribute to improve red wine colour by the production of stable pigments thanks to the differences in its metabolism.
The main aim of this work was to evaluate the influence of sequential fermentations with
non-Saccharomyces and S. cerevisiae at two different temperatures on red wine colour and identify
the genus of four strains used on the oenological assay by molecular biology techniques. Physical-chemical parameters and anthocyanin profile were analysed on final wines.
Molecular biology techniques were used to determine the yeast genus of IPSMA6, R20VL4, 21A110 and 15C6 strains. Nucleotide sequences of these strains were compared with available DNA sequences in GenBank using BLAST. Strain 21A110 and R20VL4 were identify as
Hanseniaspora, strain IPSMA6 was identify as Lachancea and strain 15C6 was identify as Metschnikowia.
Respecting to the oenological assay, results showed that the yeast specie/strain used in sequential fermentation has substantial influence on the formation of stable compounds. Moreover, the lower temperature during fermentation improved the anthocyanin profile. Yeast selection and its characterization is important to improve the colouring matter of wine and, consequently, wine quality.
Keywords:
Sequential fermentation; Yeast/strain selection; Saccharomyces cerevisiae;
xiii
List of contents
1. Literature review ... 1
1.1. Red wine colour ... 1
1.2. Colour stabilization... 2
1.3. Wine yeasts and sequential fermentations ... 5
1.4. Identification and selection of non-Saccharomyces yeasts ... 6
1.5. Characterization of non-Saccharomyces yeasts studied ... 7
1.5.1. Schizosaccharomyces pombe ... 7 1.5.2. Saccharomycodes ludwigii ... 7 1.5.3. Torulaspora delbrueckii ... 7 1.5.4. Metschnikowia pulcherrima ... 8 1.5.5. Lachancea thermotolerans ... 8 1.5.6. Hanseniaspora uvarum ... 9
2. Materials and Methods ... 11
2.1. Molecular biology... 11
2.1.1. Identification of the unknown yeasts ... 11
2.2. Oenological assay ... 12
2.2.1. Yeast strains and fermentation media ... 12
2.2.2. Micro fermentations ... 13
2.2.3. Finished wines analysis ... 14
3. Results and Discussion ... 16
3.1. Yeast genus identification ... 16
3.2. Fermentations ... 19
3.2.1. Experiment 1 – 25 ºC ... 19
3.2.2. Experiment 2 – 18 ºC ... 20
xiv 3.3.1. Experiment 1 – 25 ºC ... 20 3.3.2. Experiment 2 – 18 ºC ... 23 3.4. Analysis of anthocyanins ... 25 3.5. Colour assessment ... 28 3.6. Considerations ... 29 4. Conclusion ... 30 5. Citations ... 31 6. Supplement ... 37
xv
List of figures
Figure 1. Evolution of anthocyanins and tannins extraction during fermentation. MpF – Maceration prior to fermentation; AF – Alcoholic fermentation; PfM – Post-fermentation maceration ... 2 Figure 2. Chemical structures of grape anthocyanins ... 2 Figure 3. Formation of vitisins A and B... 3 Figure 4. Formation of vinylphenolic pyranoanthocyanins by using yeasts with HCDC activity ... 4 Figure 5. Schematic representation of the fungal ribosomal 18S rRNA gene and ITS regions with primer binding locations ... 6 Figure 6. Agarose gel of the of the PCR-amplified rDNA region of 21A110 and 7VA (positive control). (a) 0,2 µl of PCR product; (b) 2 µl of PCR product. MM - 100 bp DNA ladder; NC - negative control. ... 16 Figure 7. Agarose gel of the PCR-amplified rDNA region of IPSMA6, 15C6 and R20VL4. (a) 2 µl of PCR product; (b) 5 µl of PCR product. MM - 100 bp PCR Molecular Ruler; NC - negative control. ... 16 Figure 8. Agarose gel of the PCR-amplified rDNA region of 21A110, IPSMA6, 15C6 and R20VL4 after DNA purification. MM - 100 bp PCR Molecular Ruler. ... 17 Figure 9. Fermentative potential of the sequential fermentations of S. uvarum (S6U), S. pombe (938), S. ludwigii (979), T. delbrueckii (291), M. pulcherrima (M.p.), L. thermotolerans (L.t.),
L. thermotolerans (L.31), Lachancea (IPSMA6), Hanseniaspora (R20VL4), Hanseniaspora
(21A110), Metschnikowia (15C6) with S. cerevisiae (7VA), at 25 °C (Experiment 1). ... 19 Figure 10. Fermentative potential of pure fermentations with S. uvarum (S6U), S. pombe (938),
S. ludwigii (979) and sequential fermentations of T. delbrueckii (291), M. pulcherrima (M.p.), L. thermotolerans (L.t.), L. thermotolerans (L.31), Lachancea (IPSMA6), Hanseniaspora
(R20VL4), Hanseniaspora (21A110), Metschnikowia (15C6) with S. cerevisiae (7VA), at 18 °C (Experiment 2). ... 20 Figure 11. Physical-chemical parameters of wine samples fermented at 25 °C (Experiment 1). Mean ± STD (n=3). A - Ethanol (% v/v); B – pH; C – Glucose (g/l); D – Fructose (g/l); E – Malic Acid (g/l); F – Lactic Acid (g/l); G – Total Acidity (g/l); H – Volatile Acidity (g/l). 7VA (S. cerevisiae, control); S6U (S. uvarum); 938 (S. pombe); 979 (S. ludwigii); 291 (T.
xvi
R20VL4 (Hanseniaspora); 21A110 (Hanseniaspora); M.p. (M. pulcherrima); 15C6 (Metschnikowia). ... 22 Figure 12. Physical-chemical parameters of wine samples fermented at 18 °C (Experiment 2). Mean ± STD (n=3). A - Ethanol (% v/v); B – pH; C – Glucose (g/l); D – Fructose (g/l); E – Malic Acid (g/l); F – Lactic Acid (g/l); G – Total Acidity (g/l); H – Volatile Acidity (g/l). 7VA (S. cerevisiae, control); S6U (S. uvarum); 938 (S. pombe); 979 (S. ludwigii); 291 (T.
delbrueckii); L.t. (L. thermotolerans); L.31 (L. thermotolerans); IPSMA6 (Lachancea);
R20VL4 (Hanseniaspora); 21A110 (Hanseniaspora); M.p. (M. pulcherrima); 15C6 (Metschnikowia). ... 24 Figure 13. HPLC-DAD chromatogram obtained of S. cerevisiae (strain 7VA; replica 1). ... 25 Figure 14. Pigments present in wines of experiment 1, at 25 °C (1) and wines of experiment 2, at 18 C (2), expressed as [mg/l]. Mean ± STD (n=3). A – Glycosylated anthocyanins (green) and acylated anthocyanins (blue); B – Pyranoanthocyanins (involve vitisins and vinyl phenolic compounds); C – Polymeric compounds; D – Total anthocyanins. 7VA (S. cerevisiae, control); S6U (S. uvarum); 938 (S. pombe); 979 (S. ludwigii); 291 (T. delbrueckii); L.t. (L.
thermotolerans); L.31 (L. thermotolerans); IPSMA6 (Lachancea); R20VL4 (Hanseniaspora);
21A110 (Hanseniaspora); M.p. (M. pulcherrima); 15C6 (Metschnikowia). ... 27 Figure 15. Vitisin A, vitisin B and vinylphenolic pyranoanthocyanins compounds present in wines of experiment 1, at 25 °C (1) and wines of experiment 2, at 18 C (2), expressed as [mg/l]. Mean ± STD (n=3). A – Vitisin A; B – Vitisin B; C – Vinylphenolic pyranoanthocyanins. 7VA (S. cerevisiae, control); S6U (S. uvarum); 938 (S. pombe); 979 (S. ludwigii); 291 (T.
delbrueckii); L.t. (L. thermotolerans); L.31 (L. thermotolerans); IPSMA6 (Lachancea);
R20VL4 (Hanseniaspora); 21A110 (Hanseniaspora); M.p. (M. pulcherrima); 15C6 (Metschnikowia). ... 28
xvii
List of tables
Table 1. DNA quantification of 21A110, 1PSMA6, 15C6 and R20VL4 samples ... 18 Table 2. Length of region 5.8S-ITS sequence of 21A110, 1PSMA6, 15C6 and R20VL4 samples and homology with GenBank sequences ... 18
xix
List of abbreviations
bp Base pair
BLAST Basic Local Alignment Search Tool
CFU Colony-forming unit
DNA Deoxyribonucleic acid
FTIR Fourier Transform Infrared
HCDC Hydroxycynamate decarboxylase
HPLC-DAD High Performance Liquid Chromatography - Diode Array Detection
ITS Internal transcribed spacer
M3G Malvidin-3-O-glucoside
nt Nucleotide
PCR Polymerase Chain Reaction
RFLP Restriction Fragment Length Polymorphism
rRNA Ribosomal Ribonucleic Acid
TAE Tris-acetate-ethylenediaminetetraacetic acid
U Enzyme unit
YPD Yeast extract-peptone-dextrose
7VA Saccharomyces cerevisiae
S6U Saccharomyces uvarum
938 Schizosaccharomyces pombe 979 Saccharomycodes ludwigii 291 Torulaspora delbrueckii M. p. Metschnikowia pulcherrima L. t. Lachancea thermotolerans L. 31 Lachancea thermotolerans 21A110 Hanseniaspora IPSMA6 Lachancea 15C6 Metschnikowia R20VL4 Hanseniaspora
1
1. Literature review
1.1. Red wine colourWine quality can be determined by a mixture of sensory (colour, aroma and mouth feel) and chemical (pigments, aromatic profile and flavour molecules) analyses. The very first wine impression is visual; it gives information about winemaking techniques, variety, aging, oxidation and stabilization, being the colour one of the most important quality parameter for red wine [1]–[3].
Several components from grapes that contribute for the sensorial properties such as colour, flavour and mouthfeel, among which stand out many polyphenols, are extracted during the fermentation process [4], [5].
The most relevant phenolic compounds that contribute for wine quality are anthocyanins and condensed tannins. Anthocyanins are polyphenols present in grape skins and, more unusually, in the flesh (‘teinturier’ grape varieties) that are responsible for the colour of red wine. Condensed tannins (proanthocyanidins) participate in astringency, bitterness, have antioxidant capacity and also affect the colour [4].
The process to obtain the red colour is complex, involving maceration of the grape skins during alcoholic fermentation coexisting a biochemical phenomenon, sugar metabolization into ethanol, CO2 and other secondary products and physicochemical phenomenon such extraction
and diffusion. Anthocyanins and tannins are extracted together with others polyphenols from red grapes to musts during the maceration process [5], [6].
Polarity of the medium changes during fermentation. At the beginning, the must is basically acidified water and sugars that results in a polar medium where is verified a maximum extraction of anthocyanins, due to the molecule positive charge. In the course of fermentation, due to ethanol production the medium becomes more apolar that favours the extraction of tannins (apolar molecules) and anthocyanins concentration decrease until stabilization (Figure 1). The changes on the medium polarity are influenced by the yeast kinetic. Factors such temperature, pH, different yeasts, must composition, grape variety and ripeness affect this extraction phenomenon [5].
2
There are some techniques to improve the extraction of anthocyanins and tannins such as mechanical operations (e.g. delestages and pumping over), cold pre-fermentative maceration and the use of pectolytic enzymes [5], [7].
1.2. Colour stabilization
Vitis vinifera L. grapes contain the anthocyanins delphinidin, cyanidin, petunidin, peonidin and
malvidin (Figure 2). Grape anthocyanins or monomeric anthocyanins are very unstable and can be degraded by oxidation, precipitation and adsorbed by yeast cell walls causing colour loss.
These molecules are glycosylated in position 3 which can be acylated to form acetyl, caffeoyl and p-coumaroyl derivatives by the formation of esters at glucose position 6 [8]. However, they Figure 2. Chemical structures of grape anthocyanins [61]
Figure 1. Evolution of anthocyanins and tannins extraction during fermentation. MpF – Maceration prior to fermentation; AF – Alcoholic fermentation; PfM – Post-fermentation maceration [4].
3
quickly condense or combine to create more complex and stable pigments as vitisins A and B and other pyranoanthocyanins and polymeric pigments [6], [9].
During fermentation, yeasts excrete several metabolites such as pyruvic acid, acetaldehyde, acetone and α-ketoglutaric acid that condense with grape anthocyanins to form pyranoanthocyanins [10].
Pyruvic acid and acetaldehyde are two important compounds because these metabolites are electrophilic and spontaneously condense with grape anthocyanins, mainly malvidin-3-O-glucoside (M3G), originating vitisins A and B respectively (Figure 3).
The quantity excreted of each metabolite depends on the yeast strain. However, their concentration varies during fermentation. As the concentration of acetaldehyde increases during fermentation, reaching a maximum in the end, pyruvic acid reaches a maximum in the fourth-fifth day of fermentation and then reduce until stabilize in the end [5].
There is other group of pyranoanthocyanins, the hydroxyphenyl compounds type, named vinylphenolic pyranoanthocyanins. These compounds are produced from the reaction between anthocyanins and vinyl phenolic compounds. Vinyl phenolic compounds could be present in must or released from the yeasts with hydroxycynamate decarboxylase (HCDC) activity (Figure 4) [10].
4
Pyranoanthocyanins pigments possess a heteroaromatic pyrin ring that improves the stability of wine colour at different pH. These compounds are more orange than grape anthocyanins. They show a hypsochromic shift in their maximum absorbance. For example, as the maximum absorbance for M3G is 528 nm, for vitisins A and B are approximately 512 and 495 nm, respectively. Also, their chemical structure increases their stability under oxidising conditions because of the double pyrano structure that increase the number of possible resonant forms. These properties of pyranoanthocyanins are responsible for colour stability of wines [5], [11]. Another group of stable pigments are polymeric pigments. These pigments are formed through the condensation of anthocyanins and pyranoanthocyanins with tannins. This type of reaction has been considered as a natural chemical process that is slow and occur during aging. However, formation of polymeric pigments during must fermentation has been considered. Polymeric compounds can be formed faster because of acetaldehyde that can be an intermediate molecule that favours the reaction. [3], [5].
Several studies of Saccharomyces and non-Saccharomyces yeast species have been demonstrating the metabolic, physiologic and structural features in order to improve the formation of stable pigments, pyruvic acid and acetaldehyde production or HCDC activity. Figure 4. Formation of vinylphenolic pyranoanthocyanins by using yeasts with HCDC activity [59]
5
1.3. Wine yeasts and sequential fermentations
Yeasts play a fundamental role in wine fermentation. Saccharomyces cerevisiae is the main microorganism involved in the alcoholic fermentation, known as the wine yeast. However, it is a non-sterile process and many other species of yeasts belonging to non-Saccharomyces genera are present in the early stages of fermentation contributing for organoleptic characteristics of final wines [5], [12], [13].
Yeasts present in grape musts are originated from the vineyard and the grapes, and from the winery environment. During the first days of a spontaneous fermentation exists a wide variability of yeasts species like Hanseniaspora/Kloeckera and Candida species, followed by several species to the genera Metschikowia and Pichia, and occasionally Brettanomyces,
Kluyveromyces, Schizosaccharomyces, Torulaspora, Rhodotorula, Zygosaccharomyces and Cryptococcus genera. This scenario is followed by the progressive dominance of S. cerevisiae
[12]–[15].
In the past, non-Saccharomyces yeasts were considered undesirable spoilage yeasts in terms of the production of undesirable metabolites resulting negatively in sensory properties on wine. Beyond that, most of them showed low fermentation kinetics and low sulphur dioxide (SO2)
resistance. By the inoculation of starter cultures and addition of SO2, winemakers could reach
a good control of the process, eliminating or minimizing the influence of yeasts other than the strain of S. cerevisiae they inoculated [12], [13], [16].
However, select strains can positively impact on the winemaking process, playing relevant roles in the metabolic impact, anthocyanin composition and aroma complexity [5], [12], [13], [16]. Native spontaneous fermentations can produce high-quality wines with regional character providing differentiation and increasing their market value. However, this method is not always reliable or predictable and can lead to stuck or sluggish fermentations, resulting in inconsistencies in wine quality. Nevertheless, this method is still used by small wineries. On the other hand, starter culture fermentations offer the advantages of a more predictable and rapid process. Providing a more consistent product in quality it may be more attractive for larger commercial wineries. Despite the numerous of S. cerevisiae and S. bayanus strains available as commercial preparations, the use of this starter cultures may be lack the complexity of flavour and vintages variability caused by indigenous yeasts [12], [13].
Wine industry is currently demanding new yeast strains in order to innovate and improve wine quality. Mixed or sequential fermentations with selected non-Saccharomyces and
6 Saccharomyces yeasts emulates spontaneous fermentation in which several yeast species from
grape participate without running the risks of stuck fermentations or wine spoilage. Moreover, it can potentiate the synthesis of acetaldehyde, pyruvic acid and other important compounds for colour stability. This practice is linked to new challenges such as the selection of suitable
non-Saccharomyces strains [5], [12], [16].
1.4. Identification and selection of non-Saccharomyces yeasts
The identification and classification of yeasts have traditionally been based on morphological, physiological and biochemical traits. However, it was often proved to be insufficient to identify yeasts at the species level. In the recent years, different techniques of molecular biology have been applied to identify wines yeast species [5], [17]–[19].
Amongst them, restriction fragment length polymorphism (RFLP) or sequence analysis of the 5.8S rRNA gene (Figure 5) and its flanking internal transcribed spacer regions (ITS1 and ITS2) have been used by several authors [14], [17]–[20]. Differences in the ITS region can be used to discriminate between yeast species, since they show high interspecific polymorphism. Moreover, these techniques are relative ease of manipulation and have high reproducibility [18], [20].
For the selection of non-Saccharomyces yeasts there are basic criteria to study. These include the properties that affect the performance of the fermentation process (high fermentative power, SO2 tolerance, low volatile acidity, etc); properties that determine wine quality (production of
desirable metabolites, affect positively wine colour and flavour, etc); and properties related to the commercial production of wine yeasts (relation between cost of production and large-scale cultivation, tolerance of the stresses during the industrial process, etc) [5], [12].
Figure 5. Schematic representation of the fungal ribosomal 18S rRNA gene and ITS regions with primer binding locations [63]
7
1.5. Characterization of non-Saccharomyces yeasts studied 1.5.1. Schizosaccharomyces pombe
S. pombe species have the ability to complete alcoholic fermentation, though slower than most
commercial strains of S. cerevisiae. It is highly appreciated in colder regions because of its ability to lower the malic acid content in wine, thanks to its particular metabolism of maloalcoholic fermentation. However, few commercial strains are available because of its high acetic acid production, approximately 1 g/L. In order to reduce the negative effects, mixed and sequential cultures with Saccharomyces have been used as also the selection of more appropriate strains of S. pombe [5], [21], [22].
Studies with S. pombe have showed its ability to lower gluconic acid [23], [24], reduce 4-ethylphenol in wine [25] and lower the formation of ethyl carbamate because of its urease activity [26], [27]. Additionally, Schizosaccharomyces produces a high quantity of pyruvic acid (a vitisin A precursor) as also have hydroxycinnamate decarboxylase activity that favours the formation of vinylphenolic pyranoanthocyanins [10], [22].
Therefore, identifying suitable S. pombe strains could enhance wine sensory parameters, especially those related to wine colour stability.
1.5.2. Saccharomycodes ludwigii
Saccharomycodes ludwigii is a good fermenter with a relevant fermentation purity which means
that it has the capacity to minimized volatile acidity production during fermentation [5]. Additionally, it is rarely associated with grape musts but appears to be a common contaminant of sulphited musts because of its high resistance to SO2 [28]. This species is characterized by
the secondary products formed such as acetoin, ethyl acetate and acetaldehyde. Respecting to acetaldehyde, S. ludgwii shows an inverse correlation of acetaldehyde versus ethanol production [29].
According to Paola Domizio et al. [30], at appropriate inoculum ratios, S. ludgiwii may be utilized to positively affect wine aroma and complexity without being detrimental for S. cerevisiae growth and fermentative activity.
1.5.3. Torulaspora delbrueckii
Torulaspora delbrueckii is the best studied, commercialized and utilized non-Saccharomyces
yeast specie at the industrial level. Fermentative power of T. delbrueckii is low, normally ranging from 7 to 10 %v/v ethanol but shows a high fermentation purity, which means that can
8
be used in mixed or sequential culture with S. cerevisiae with the purpose of reducing acetic acid content in wines [31].
T. delbrueckii is known to have a positive effect on the mouthfeel and aromatic properties of
final wines by producing higher levels of fruity esters, thiols and terpenes. Besides, it exhibits low production of acetaldehyde, acetoin, acetate, and ethyl acetate [31], [32].
Respecting to the acetaldehyde compound, it may explain the lower final levels of total sulfur dioxide observed in some fermentation studies using this yeast, since acetaldehyde combines with sulfur dioxide [32]. Moreover, and consequently, a lower production of stable colour forms as vitisins B, when fermentation is performed by T. delbrueckii [33].
Bañuelos et al. [34] observed increases in vitisins A, due to the more highly developed glycerol-pyruvic pathway reported for this species and few milligrams per liter of vinylphenolic pyranoanthocyanins. These observations are very valuable for selecting appropriate T.
delbrueckii [33].
1.5.4. Metschnikowia pulcherrima
Metschnikowia pulcherrima is a first stage yeast specie in fermentation, reaching approximately
4 %v/v of ethanol [5]. M. pulcherrima is attracting attention in wine industry by its positive effects on the taste and aroma of alcoholic beverages [35]. In mixed cultures, M. pulcherrima can decrease the volatile acidity. Moreover, it increases the production of medium chain fatty acids, higher alcohol, esters, terpenols and glycerol [36], [37]. Furthermore, it was reported that
M. pulcherrima produces β-glucosidase which is able to release aromatic compounds from
odourless grape juice under winemaking conditions [38]. However, it is also responsible for the degradation of anthocyanins [39].
1.5.5. Lachancea thermotolerans
L. thermotolerans (formerly known as Kluyveromyces thermotolerans) has the ability of
biological acidification since it is a L-lactic acid producer. Due to its metabolism, L.
thermotolerans enhances the total acidity and reduces the pH of final wines, when used in mixed
fermentations with S. cerevisiae [40], [41]. Moreover, it shows a higher concentration of fruity esters, giving a better sensorial impression [41].
Benito, A. et al. [42] have showed a higher content of anthocyanins when used in mixed fermentation with S. cerevisiae and S. pombe, relating to a low anthocyanin absorption by L.
9
1.5.6. Hanseniaspora uvarum
The apiculate yeast Hanseniaspora uvarum (anamorph Kloeckera apiculata) is one of the yeast species more predominant on the external surface of grape berries as also in the first stage of spontaneous fermentation [43]. These yeast species are important in the production of volatile compounds and can contribute positively on the aromatic profile of wines when used in mixed fermentations [44], [45]. H. uvarum has the capacity to produce primary metabolites as glycerol and acetaldehyde as also higher alcohols and volatile esters [46].
11
2. Materials and Methods
The work method was divided in two subjects: molecular biology and oenological assay. The principal aim of this study was to evaluate the influence of sequential fermentation with
non-Saccharomyces and S. cerevisiae in wine colour and for that was prepared an oenological assay.
However, there were four strains of unknown yeast species that were identified previously before the oenological assay. Because of that, this chapter starts with the materials and methods used in yeast genus identification, following the oenological assay with twelve yeast species.
2.1. Molecular biology
2.1.1. Identification of the unknown yeasts
Four unknown yeast strains (1PSMA6, R20VL4, 21A110 and 15C6) were subjected to a molecular biology study for genus identification.
2.1.1.1. DNA extraction and PCR reaction
Fresh yeast colony was used to inoculate 5 ml of liquid yeast extract-peptone-dextrose (YPD) medium and start the DNA extraction protocol (protocol details on supplement).
The extraction protocol was followed by a 50 µl PCR reaction mix containing 25 µM primer ITS 1 (5’ TCCGTAGGTGAACCTGCGG 3’), 25 µM primer ITS 4 (5’ TCCTCCGCTTATTGATATGC 3’), 1,25 U/reaction TaKaRa Taq™ kit from Takara Bio Inc. (Shiga, Japan), 2 µl of yeast DNA and sterile and distilled water. PCR was performed in a Perkin-Elmer thermocycler with the following conditions: initial denaturation at 94°C for 2 min; 35 cycles of denaturing at 94°C for 30 s, annealing at 55°C for 30 s and extension at 72°C for 2 min; and a final extension at 72°C for 7 min.
Detection of PCR-amplified product was performed by electrophoresis on a 1% (w/v) agarose gel. Different volumes of the PCR-amplified products were used to verify the most adequate conditions to observe bands.
A volume of 3 µl of the molecular weight marker was run in parallel to approximate PCR-amplified product size. The molecular weight markers used were 100 bp DNA ladder from NIPPON Genetics Europe (Dueren, Germany) and 100 bp PCR Molecular Ruler from BIO-RAD Laboratories (California, USA).
A volume of 2 µl of gel loading solution was loaded into each lane and electrophoresis gels were run with 1 x TAE buffer, at 80 volts on. DNA stain used was SYBR Safe from Invitrogen (Carlsbad, CA, USA).
12
After electrophoresis, gels were visualized and photographed.
Saccharomyces cerevisiae (7VA) were used as a positive control and a sample without DNA
as a negative control.
2.1.1.2. DNA purification, quantification and sequencing
All PCR-amplified products were submitted to a DNA purification using mi-PCR Purification Kit (Metabion International AG, Planegg, Germany), followed by DNA quantification using DeNovix DS-11 FX spectrophotometer (DeNovix Inc, Wilmington, DE, USA).
PCR-amplified products were sent in purple Eppendorf® tubes to Secugen (Madrid, Spain) following the application instructions, with 20 ng/µl DNA concentration and using 1 µl of ITS 1 or ITS 4 primers, at 5 µM concentration.
Sequences were visualized and edited using SnapGene Viewer version 3.3.4 (GSL Biotech LLC, Chicago).
2.1.1.3. Bioinformatic analysis
Sequence search was performed using the BLAST standard nucleotide-nucleotide basic local alignment search tool (National Center for Biotechnology Information (NCBI), Library of Medicine, Bethesda, MD, USA). Only the sequence matching with more than 98% of identity were considered to identify the yeast genus.
2.2. Oenological assay
2.2.1. Yeast strains and fermentation media 2.2.1.1. Yeasts strains
Twelve yeast strains were used in this work, eight of them were known species and four were unknown species. The known yeasts used were: Saccharomyces cerevisiae (7VA);
Saccharomyces uvarum (S6U); Schizosaccharomyces pombe (938); Saccharomycodes ludwigii
(979); Torulaspora delbrueckii (291); Metschnikowia pulcherrima (M. p.); Lachancea
thermotolerans (L.t.) and Lachancea thermotolerans (L.31). The unknown species, isolated in
Rías Baixas and Ribera del Duero appellation, were named by the research team of Laboratorio de Tecnologia de Alimentos (E.T.S.I. Agronomos, Madrid) as 1PSMA6, R20VL4, 21A110 and 15C6. These unknown species were used in molecular genetic studies for genus determination.
13
2.2.1.2. Yeasts propagation
To obtain isolated colonies, all strains (kept in test tubes) were streaked in a solid YPD medium and incubated during 48 h at 25 °C. Single colonies were selected and inoculated in liquid YPD medium during 24 h at 25 °C (more information about solid and liquid YPD medium on supplement). To obtain homogenous active populations (106 CFU/ml) at the beginning of the fermentation, 100 µl of each strain were added to 5 ml of liquid YPD medium and grown for 24 h at 25 °C, twice in succession.
Before first and second inoculation, microbial load was calculated for each strain/each sample, respectively, using dilution technique.
2.2.1.3. Must reconstitution
Must concentrate of Airen variety was diluted down to 23.8 °Brix (about a rate of 1/3 dilution) and pH levels were adjusted to 3.53 using tartaric acid. The red must was obtained by adding enocyanin. The commercial name of this product is Grape Color Powder EV-12 (Secna Group, Valência, Spain). The grape varieties used in this product are Bobal, Tempranillo and Tintorera. The enocyanin concentration added to the must was 3 g/L, followed by the filtration in a sterile environment with Thermo-Fischer Scientific Nalgene disposable filter, pore size 0.20 μm. Filtering was preferred instead of autoclave to prevent must composition degradation by high temperatures.
2.2.2. Micro fermentations
A micro fermentation assay was carried out in 10 ml volume glass vials filled with 8 ml of must, inoculated with 160 µl of inoculated YPD media of each yeast strain with populations between 107 and 5x10⁷ CFU/ml. Glass vials were closed with rubber stoppers and a needle was inserted to allow the outflow of gas. All glass vials, stoppers and needles used were previously sterilized in autoclave at 120 °C for 20 min and all the procedure was done in sterile environment. All micro fermentations were performed in triplicate for each yeast species at two different temperatures. The experiment 1 was proceed at 25 ºC and the experiment 2 was proceed at 18 ºC. In the experiment 1 all strains were assessed in sequential fermentation with S. cerevisiae (7VA) to test the sequential fermentation effect. In the experiment 2 all strains were assessed in sequential fermentation with S. cerevisiae (7VA) excepting strains S6U, 938 and 979 that were assessed in pure fermentation because of the capability to reach at least 12 % v/v of alcohol
14
[30], [47], [48]. Sequential fermentation were preferred instead of mixture fermentation to ensure the effects of the non-Saccharomyces yeasts [45].
The second inoculation with 7VA was carried out seven and eleven days after start of the fermentation for experiment 1 and 2, respectively.
The fermentative potential was calculated using the formula: FP (% v/v) = (1,3*100*Δp)/50, from the difference between initial and final weight (Δp) in 50 ml microfermentations. The variations in weight for each vial were recorded until reaching a steady weight using a Metler-Toledo AJ100 precision balance, with precision to four decimals points of a gram [5].
2.2.3. Finished wines analysis 2.2.3.1. Infrared spectroscopy
OenoFOSSTM (FOSS Iberia, Barcelona, Spain) analyser uses Fourier Transform Infrared (FTIR) technology to quantify multiple parameters in finished wines as ethanol, lactic and malic acid, glucose, fructose, glucose/fructose, pH, total and volatile acidity as well as the density. Wine constituents concentrations are predicted through the Fourier transform mathematical model based on the absorbed light in the wine sample (more details on P/N 1026589, Issue 2GB, October 2013).
2.2.3.2. Anthocyanin analysis by liquid chromatography
Anthocyanins, pyranoanthocyanins and polymeric pigments were identify using HPLC-DAD Agilent 1200 (Palo Alto, California, USA). Gradients of solvent A (water/formic acid, 95:5, v/v) and B (methanol/formic acid, 95:5, v/v) were used in a C18 column (50×4.6 mm; particle size 2.7 μm) with the following gradient of solvent B (1 ml/min): 15% to 50 % from time 0 to 2 min; 50% from time 10 to 12 min and finally from 50% to 15% from time 12 to 13 min. Detection was performed by scanning in the 250–600 nm range. Quantification was performed by comparison against an external standard at 525 nm and expressed as a function of the concentration of malvidin-3-O-glucoside (M3G) [9], [49]. The different anthocyanins were identified by their retention times and by comparing the UV–Visible spectrum with data in the literature [9], [50], [51]. Peaks were manually integrated.
The volume injected into the HPLC apparatus were 50 µl of sterile filtered test sample. The detection limit was 0.1 mg/L. Each wine sample was done in triplicate.
15
2.2.3.3. Colour determination
The colour of red wine was determined using a spectrophotometer 8453 from Agilent Technologies™ (Palo Alto, CA, USA) with a photodiode array detector and the use of a 1mm path length quartz cell. Absorbance at 420, 520 and 620 nm was measured and used to calculate colour intensity, as the sum of absorbance at the three wavelengths, and hue, as the ratio between the absorbance at 420 nm and 520 nm, of all fermented wine samples [52], [53].
2.2.3.4. Statistical Analysis
Means and standard deviations were calculated using Microsoft Excel 2016 algorithms (Microsoft Corporation, Redmond, Washington, USA).
Statistical analysis was done using PC Statgraphics Centurion XVII v.17.2.04 (Statpoint Technologies, The Plains, VA, USA). ANOVA tests and Multiple Range tests were performed using a level of significance of p ≤ 0.05.
16
3. Results and Discussion
3.1. Yeast genus identification
Strains 21A110, 1PSMA6, 15C6 and R20VL4 were isolated in Rías Baixas and Ribera del Duero appellation by the research team of Laboratorio de Tecnologia de Alimentos (E.T.S.I. Agronomos, Madrid). These four strains were used in the oenological assay and, at the same time, a genus identification assay was conducted.
The genus of strains 21A110, 1PSMA6, 15C6 and R20VL4 were determined by sequencing the region amplified by ITS1 and ITS4 primers, that includes the 5.8S rRNA gene and its flanking internal transcribed spacer regions (ITS1 and ITS2). The ITS region show low intraspecific variability and high interspecific polymorphism, allowing a reliable identification of yeast species [18], [54].
After DNA extraction, the electrophoretic profile was determined by an agarose gel electrophoresis. Different concentrations of DNA samples were used to test the optimal concentration to see the profile.
Figure 6. Agarose gel of the of the PCR-amplified rDNA region of 21A110 and 7VA (positive control). (a) 0,2 µl of PCR product; (b) 2 µl of PCR product. MM - 100 bp DNA ladder; NC - negative control.
Figure 7. Agarose gel of the PCR-amplified rDNA region of IPSMA6, 15C6 and R20VL4. (a) 2 µl of PCR product; (b) 5 µl of PCR product. MM - 100 bp PCR Molecular Ruler; NC - negative control.
17
It was possible to verify a large length variation, ranging from 300 to 900 bp approximately. Regarding the electrophoretic profile represented on figure 6, using a volume of 0,2 µl of the PCR product (21A110(a) and 7VA(a)), it was possible to visualize the band with more accuracy and better intensity. This result suggested a high DNA concentration in samples. Respecting to figure 7, the electrophoretic profile of samples where a volume of 5 µl of PCR product was used resulted in an intense and thicker band. Consequently, it was harder to determine the approximate length of the PCR products. A volume of 2 µl, in this case, was better to visualize and determined the size of the PCR products.
In order to prepare samples for sequencing, PCR products were submitted to a DNA purification using mi-PCR Purification Kit. DNA presence was confirmed through a gel electrophoresis.
On figure 8 is represented the electrophoretic profile of 21A110, IPSMA6 and R20VL4 samples. Band length ranged between 600 to 800 bp. It was not possible to see the electrophoretic profile of 15C6 sample which can be explained by DNA degradation or by excessive running time for a small sized fragment.
On table 1 is possible to observe the results of DNA quantification. Strain 21A110 showed the highest DNA concentration, as it was possible to detect by electrophoresis, and strain 15C6
Figure 8. Agarose gel of the PCR-amplified rDNA region of 21A110, IPSMA6, 15C6 and R20VL4 after DNA purification. MM - 100 bp PCR Molecular Ruler.
18
showed the lowest DNA concentration. It was not possible to see the band on electrophoretic profile of 15C6 sample however it was possible to confirm the presence of DNA on sample.
Table 1. DNA quantification of 21A110, 1PSMA6, 15C6 and R20VL4 samples
PCR-amplified products ng/µl
21A110 84,513
IPSMA6 54,204
15C6 43,600
R20VL4 51,380
Following the instructions and protocols of Secugen (Madrid, Spain), 21A110, 1PSMA6, 15C6 and R20VL4 samples were sent to sequencing. The sequences were compared with available DNA sequence databases using BLAST. Yeast genus were determined with more than 98% of identity.
Table 2. Length of region 5.8S-ITS sequence of 21A110, 1PSMA6, 15C6 and R20VL4 samples and homology with GenBank sequences
Sample Primer Yeast genus Sequenced fragment (nt) Identity (%) GenBank Accession Number 21A110 ITS 1 Hanseniaspora 710 100 KY103574.1
IPSMA6 ITS 1 Lachancea 672 99 KY076618.1
15C6 ITS 1 Metschnikowia 325 98 KY104204.1
19
3.2. Fermentations
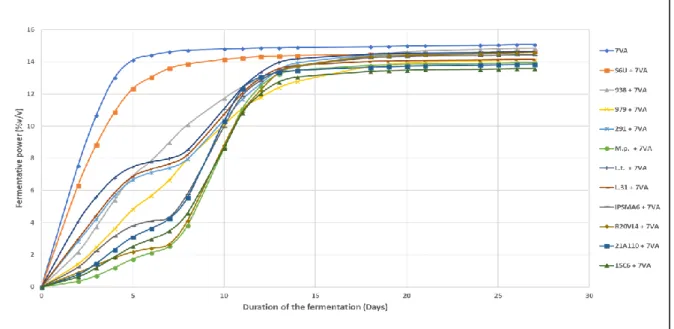
Fermentations were kept for 27 days to maximize the use of all sugars in both experiments (experiment 1 at 25 ºC and experiment 2 at 18 ºC). Fermentative potential was calculated [5] and represented on figures 9 and 10, for experiment 1 and 2, respectively.
3.2.1. Experiment 1 – 25 ºC
The second inoculation was made on the seventh day of fermentation. It is possible to observe that all fermentations were stabilized after day 20. As expected, S. cerevisiae (7VA) was the first to finish fermentation. It is also possible to observe that the non-Saccharomyces yeasts, with the exception of strains 938 and 979, were stabilizing before second inoculation with different ethanol production. Based on their fermentative potential, it is possible to classify these strains in three groups. A strong fermenters group with 7VA (S. cerevisiae) and S6U (S.
uvarum); an intermediate group with 938 (S. pombe), 979 (S. ludwigii), L.t. (L. thermotolerans),
L.31 (L. thermotolerans) and 291 (T. delbrueckii) and a weakest group including IPSMA6 (Lachancea), 21A110 (Hanseniaspora), 15C6 (Metschnikowia), M.p. (M. pulcherrima) and R20VL4 (Hanseniaspora).
Figure 9. Fermentative potential of the sequential fermentations of S. uvarum (S6U), S. pombe (938), S. ludwigii (979), T. delbrueckii (291), M. pulcherrima (M.p.), L. thermotolerans (L.t.), L. thermotolerans (L.31), Lachancea (IPSMA6), Hanseniaspora (R20VL4), Hanseniaspora (21A110), Metschnikowia (15C6) with S. cerevisiae (7VA), at 25 °C (Experiment 1).
20
3.2.2. Experiment 2 – 18 ºC
In this experiment, S. uvarum (S6U), S. pombe (938) and S. ludwigii (979) strains were assessed in pure fermentation. The second inoculation in the sequential fermentation trials was made on the eleventh day of fermentation. At a lower temperature, the latency time increased and the fermentation speed decreased, resulting in a less intense fermentative process [55].
As in experiment 1, S. cerevisiae (7VA) was the first to finish fermentation, although it took approximately 15 days more to finish fermentation than experiment 1.
Figure 10. Fermentative potential of pure fermentations with S. uvarum (S6U), S. pombe (938), S. ludwigii (979) and sequential fermentations of T. delbrueckii (291), M. pulcherrima (M.p.), L. thermotolerans (L.t.), L. thermotolerans (L.31), Lachancea (IPSMA6), Hanseniaspora (R20VL4), Hanseniaspora (21A110), Metschnikowia (15C6) with S. cerevisiae (7VA), at 18 °C (Experiment 2).
3.3. Major compounds
Ethanol (%v/v), pH, residual sugars (glucose and fructose), malic acid, lactic acid, tartaric acid (total acidity) and acetic acid (volatile acidity) were determined for each trial using the FTIR at the end of fermentation (Figure 11 and 12 and table A and B on supplement).
3.3.1. Experiment 1 – 25 ºC
Comparing with S. cerevisiae (7VA), S. pombe + S. cerevisiae (938 + 7VA) showed the highest ethanol production (13,8 %v/v). This result may be explained through its maloalcoholic fermentation, converting some malic acid into ethanol [55], [56]. Hanseniaspora + S. cerevisiae (21A110 + 7VA), Metschnikowia + S. cerevisiae (15C6 + 7VA) and M. pulcherrima + S.
21 cerevisiae (M. p. + 7VA) trials showed the lowest amount of ethanol production and the highest
amount of glucose in the end of fermentation.
Comparing 21A110 + 7VA, 15C6 +7VA and M.p. + 7VA trials with control (7VA), the difference in glucose content is less than 1 g/l and the difference in ethanol content is 0,5 to 1 % v/v. Hereupon, there is a slight lower ethanol content in fermentations done with those strains in sequential fermentation with S. cerevisiae [57].
With the exception of S. uvarum (S6U), all fermentations showed lower fructose content than control (7VA). Some non-Saccharomyces yeast species such as Hanseniaspora uvarum [58] are known as fructophilic because they consume fructose faster than glucose. Fermentations with fructophilic non-Saccharomyces and S. cerevisiae can increase the efficiency in sugars metabolization. It is important to highlight that L. thermotolerans (L.31) ended fermentation
with no residual fructose.
Malic acid concentration values are lower for fermentations with L. thermotolerans (L.31) and
S. pombe (938) species. Both fermentations resulted in less than 1 g/l of malic acid. These
results were expected for fermentations with S. pombe (938) because of its maloalcoholic fermentation [47]. Consequently, 938 + 7VA trial showed the highest pH value (3,88) and the lowest total acidity (3,45 g/l). S. pombe (938) is a promising candidate to be used in reducing acidity of wines produced in cold regions.
On the other hand, L. thermotolerans + S. cerevisiae (L.31 + 7VA) had the lowest malic acid content, also showing the ability to reduce malic acid in wines, and the highest amount of lactic acid (6,5 g/l), resulting in the highest total acidity (8,57 g/l). L. thermotolerans (L.31) could be used to produce more acidic wines in warm regions from low acidic musts [42].
Regarding volatile acidity (VA), Hanseniaspora + S. cerevisiae (R20VL4 + 7VA) showed the highest value (0,79 g/l), with 1,6 times the production of VA than control 7VA (0,49 g/l), exceeding the acceptable limit of any viable commercial yeast. The S. pombe + S. cerevisiae (938 + 7VA), T. delbrueckii + S. cerevisiae (291 + 7VA), L. thermotolerans + S. cerevisiae (L.t. + 7VA), Hanseniaspora + S. cerevisiae (21A110 + 7VA) and Metschnikowia + S.
cerevisiae (15C6 + 7VA) trials showed significantly lower volatile acidity production than
control 7VA, registering values as low as 0,2 g/l.
All but S. uvarum + S. cerevisiae (S6U + 7VA) and Hanseniaspora + S. cerevisiae (R20VL4 + 7VA), sequential fermentations had lower values of VA than S. cerevisiae (7VA). These results may help to remove the spoilage stigma of non-Saccharomyces by the selection of appropriate strains of each yeast specie with low production of acetic acid.
22
Figure 11. Physical-chemical parameters of wine samples fermented at 25 °C (Experiment 1). Mean ± STD (n=3). A - Ethanol (% v/v); B – pH; C – Glucose (g/l); D – Fructose (g/l); E – Malic Acid (g/l); F – Lactic Acid (g/l); G – Total Acidity (g/l); H – Volatile Acidity (g/l). 7VA (S. cerevisiae, control); S6U (S. uvarum); 938 (S. pombe); 979 (S. ludwigii); 291 (T. delbrueckii); L.t. (L. thermotolerans); L.31 (L. thermotolerans); IPSMA6 (Lachancea); R20VL4 (Hanseniaspora); 21A110 (Hanseniaspora); M.p. (M. pulcherrima); 15C6 (Metschnikowia).
23
3.3.2. Experiment 2 – 18 ºC
Comparing with S. cerevisiae (7VA), T. delbrueckii + S. cerevisiae (291 + 7VA) showed the highest ethanol production (13,87 %v/v). S. pombe (938) did not finish the fermentation. It showed the lowest ethanol production (12,35 %v/v) as also as the highest amount of residual sugars. Besides the fact that lower temperature are responsible for slower fermentation, S.
pombe has slower fermentation kinetics than S. cerevisiae [47], [55]. L. thermotolerans (L.31
+ 7VA) showed no fructose content and on the other hand, at a lower temperature,
Hanseniaspora + S. cerevisiae (R20VL4 + 7VA) had a higher content of residual fructose.
As expected, S. pombe (938) showed the lowest concentration value for malic acid (0,75 g/l) and consequently the pH value was higher (3,92).
L. thermotolerans + S. cerevisiae (L.31 + 7VA) showed the highest concentration of lactic acid
(4,8 g/l) and consequently the highest total acidity (8,2 g/l) and lowest pH (3,21).
Concerning VA, Hanseniaspora + S. cerevisiae (R20VL4 + 7VA) showed the highest concentration (1,15 g/l) as it did in experiment 1. Also control (7VA) showed a higher concentration (0,68 g/l) in this experiment. For these trials and for Hanseniaspora + S.
cerevisiae (21A110 + 7VA) and Metschnikowia + S. cerevisiae (15C6 + 7VA) there was an
increase of VA with the lower temperature.
At a lower temperature (experiment 2 at 18 °C) residual sugars content were lower and consequently ethanol content was slightly higher, excepting for Hanseniaspora + S. cerevisiae (R20VL4 + 7VA) trial. During must preparation, no nutrients were added. This may have difficulted the end of fermentations that showed a higher glucose and fructose content.
Fermentations trials with Metschnikowia showed lower acid malic content than control (7VA). Also strain L.31 (L. thermotolerans) showed a great potential for acid malic degradation.
24
Figure 12.Physical-chemical parameters of wine samples fermented at 18 °C (Experiment 2). Mean ± STD (n=3). A - Ethanol (% v/v); B – pH; C – Glucose (g/l); D – Fructose (g/l); E – Malic Acid (g/l); F – Lactic Acid (g/l); G – Total Acidity (g/l); H – Volatile Acidity (g/l). 7VA (S. cerevisiae, control); S6U (S. uvarum); 938 (S. pombe); 979 (S. ludwigii); 291 (T. delbrueckii); L.t. (L. thermotolerans); L.31 (L. thermotolerans); IPSMA6 (Lachancea); R20VL4 (Hanseniaspora); 21A110 (Hanseniaspora); M.p. (M. pulcherrima); 15C6 (Metschnikowia).
25
3.4. Analysis of anthocyanins
Anthocyanins were identified by their retention times and grouped in anthocyanins, pyranoanthocyanins and polymeric pigments.
Anthocyanin group included two subgroups of glycosylated and acylated anthocyanins. Acylated anthocyanins included acetyl, caffeoyl and p-coumaroyl derivatives. Pyranoanthocyanins included vitisins type and vinylphenolic pyranoanthocyanins (Figure 13).
Figure 14 illustrated the anthocyanins composition and figure 15 illustrated the vitisin A, vitisin B and vinylphenolic pyranoanthocyanin content of the fermentations trials of both experiments. More data on table C, D, E, and F on supplement.
Respecting to glycosylated and acylated anthocyanins, all fermentations trials in experiment 2 (Figure 14 – 2A) showed a higher content when compared with experiment 1 (Figure 14 - 1A). The control S. cerevisiae (7VA) had the double content of glycosylated and acylated anthocyanins (24,45 ± 1,78 mg/l; 9,56 ± 0,83 mg/l) when compared with experiment 1 (11,85 ± 0,63 mg/l; 3,74 ± 0,12 mg/l).
Regarding the pyranoanthocyanins content, S. pombe showed the highest values in experiment 1, at 25 °C, in sequential fermentation (Figure 14 - 1B) as also in experiment 2, at 18 °C, in pure fermentation (Figure 15 - 2B) (2,21 ± 0,35 mg/l and 5,51 ± 0,18 mg/l, respectively). In Figure 13. HPLC-DAD chromatogram obtained of S. cerevisiae (strain 7VA; replica 1).
26
both experiments, no vinylphenolic pyranoanthocyanins were synthesized (Figure 15 – 1C, 2C).This higher pyranoanthocyanins content may be explained by the synthesis of vitisins, especially type A since S. pombe strains were described as good producers of pyruvic acid and consequently of vitisins type A (Figure 15) [10], [16]. Moreover, sequential fermentation with
Hanseniaspora strain R20VL4 had the second highest content of pyranoanthocyanins in both
experiments. The amount of visitin A (Figure 15 - A) was the main responsible for its high pyranoanthocyanins content (Figure 14 - B). These results showed that red wines fermented with these strains could have higher colour stability. Although S. pombe (938) showed better potential to commercial use than Hanseniaspora (R20VL4) because of its lower values of volatile acidity.
S. uvarum (S6U) had the lowest concentration of pyranoanthocyanins in both experiments and
no vinylphenolic pyranoanthocyanins were synthesized (Figure 15) since its HCDC activity is insignificant [59]. Also T. delbrueckii (291) is HCDC negative. Although vinylphenolic pyranoanthocyanins was detected in experiment 1, they were formed by S. cerevisiae (7VA) [49].
Polymeric compounds are formed through the condensation of anthocyanins with tannins. They are associated with the aging of wine, however they can be formed faster and that vary according to the concentration of the precursors and the yeast species used [3].
In experiment 1 (Figure 14 - 1C), L. thermotolerans + S. cerevisiae (L.31 + 7VA) had the highest (0,26 ± 0,05 mg/l) content of polymeric compounds however, in experiment 2 (Figure 14 - 2C), it showed a slight decrease. In S. pombe + S. cerevisiae (938 + 7VA) trial there was no synthesis of this type of compounds. According to Chen K. et al.[16], S. pombe 938 strain in sequential fermentation with S. cerevisiae (7VA) showed, between other non-Saccharomyces strains, the highest content of polymeric compounds. However, that was not verified in this experiment. On the other hand, this strain (938) at 18 °C, showed the presence of this type of compounds when in pure fermentation. S. cerevisiae (7VA) showed a huge increasing in polymeric compounds in experiment 2 as also as strain S6U in pure fermentation and strain R20VL4 in sequential fermentation (Figure 14 – 2C).
Regarding figure 14 – 1D (experiment 1), all trials showed a lower content of total anthocyanins than S. cerevisiae (7VA), excepting Lachancea + S. cerevisiae (IPSMA6 + 7VA) that showed a slight higher content of total anthocyanins. However, in experiment 2, only sequential fermentations with Metschnikowia strains had a slightly lower content when compared with S.
27
control. Comparing both experiments, it was possible to verify that at a lower temperature (experiment 2) the content of total anthocyanins doubled.
The production and release of fermentation metabolites are greatly affected by temperature [60]. Results suggested that slower fermentations may have less loss of anthocyanins compounds and can improve the synthesis of more stable compounds. Additionally, the use of non-Saccharomyces, depending on each specie and strain, in sequential fermentations with S.
cerevisiae may improve the colouring matter through the production of more stable compounds.
Figure 14. Pigments present in wines of experiment 1, at 25 °C (1) and wines of experiment 2, at 18 C (2), expressed as [mg/l]. Mean ± STD (n=3). A – Glycosylated anthocyanins (green) and acylated anthocyanins (blue); B – Pyranoanthocyanins (involve vitisins and vinyl phenolic compounds); C – Polymeric compounds; D – Total anthocyanins. 7VA (S. cerevisiae, control); S6U (S. uvarum); 938 (S. pombe); 979 (S. ludwigii); 291 (T.
28 delbrueckii); L.t. (L. thermotolerans); L.31 (L. thermotolerans); IPSMA6 (Lachancea); R20VL4 (Hanseniaspora); 21A110 (Hanseniaspora); M.p. (M. pulcherrima); 15C6 (Metschnikowia).
Figure 15. Vitisin A, vitisin B and vinylphenolic pyranoanthocyanins compounds present in wines of experiment 1, at 25 °C (1) and wines of experiment 2, at 18 C (2), expressed as [mg/l]. Mean ± STD (n=3). A – Vitisin A; B – Vitisin B; C – Vinylphenolic pyranoanthocyanins. 7VA (S. cerevisiae, control); S6U (S. uvarum); 938 (S. pombe); 979 (S. ludwigii); 291 (T. delbrueckii); L.t. (L. thermotolerans); L.31 (L. thermotolerans); IPSMA6 (Lachancea); R20VL4 (Hanseniaspora); 21A110 (Hanseniaspora); M.p. (M. pulcherrima); 15C6 (Metschnikowia).
3.5. Colour assessment
The colour intensity as well as the hue were determined for all fermentations trials for both experiments.
Concerning colour intensity, no significant differences between the two experiments were observed. At 18 °C, S. pombe (938) in pure fermentation had the highest value. Regarding hue, there are no significant differences in all trials. Nevertheless, hue values in the experiment 1, at 25 °C, were slightly higher (Table G and H on supplement).
29
3.6. Considerations
The sterile filtering gave no need of SO2 addition to combat other microorganisms and therefore
was not used. Although SO2 resistance should be an essential characteristic of a commercial
wine yeast, this molecule is capable of bonding covalently with pyruvate and acetaldehyde inhibiting the reaction of this compound with grape anthocyanins to form vitisins [60].
The dilution of musts reduced various aspects of the must condition which could possibly have an effect on yeast metabolism. Hereupon, these parameters need to be further analysed with these strains of yeasts.
S. pombe (938) showed a great potential to produce less acidic wines. On the opposite, there is L. thermotolerans (L.31) that showed great potential to produce great amounts of lactic acid
and increase total acidity. This could be advantageous for warm climates. Both strains have good potential to produce higher anthocyanins content.
Besides the increase of VA at 18 ºC, non-Sacharomyces, excepting strain R20VL4, showed lower VA than S. cerevisiae.
In traditional winemaking, higher temperatures, pumping overs, etc are used to favour the extraction of anthocyanins and tannins. However, in this work was shown that in experiment 2, at 18 ºC, had higher anthocyanins content. Since lower temperatures preserve the aromas, pre-fermentative cold maceration could be an option to extract anthocyanins, preserving the aromas and preventing fermentative stops [60].
30
4. Conclusion
Here was demonstrated that the controlled use of selected non-Saccharomyces and
Saccharomyces strains in sequential fermentation could have several advantages over pure S. cerevisiae inoculated fermentations if the appropriate species and strain are used. Studies like
this one contribute for the selection of more appropriate yeast species and strains to improve colour stability of red wine by means of producing more precursors to form stable pigments compounds like pyranoanthocyanins and polymeric pigments.
Moreover, it was demonstrated that the lower temperature during fermentation allowed to obtain a higher anthocyanin content and improved colour profiles. Pre-fermentative cold maceration could be a good option to obtain a higher anthocyanin content and preserve desire aromas.
High anthocyanin levels are connected to a better colour quality, improved mouthfeel and a better aging potential.
Further research is required to understand the mechanisms of how these yeasts interact in the ecosystem of the must when in sequential fermentations.
31
5. Citations
[1] F. Palomero, P. Bertani, B. F. de Simón, E. Cadahía, S. Benito, A. Morata, J. A. Suárez-Lepe, “Wood impregnation of yeast lees for winemaking,” Food Chem., vol. 171, pp. 212–223, 2015.
[2] A. Morata, M. C. Gómez-Cordovés, J. Suberviola, B. Bartolomé, B. Colomo, and J. A. Suárez, “Adsorption of Anthocyanins by Yeast Cell Walls during the Fermentation of Red Wines,” pp. 4084– 4088, 2003.
[3] C. Escott, A. Morata, I. Loira, W. Tesfaye, and J. A. Suarez-Lepe, “Characterization of polymeric pigments and pyranoanthocyanins formed in microfermentations of non-Saccharomyces yeasts,” J. Appl. Microbiol., vol. 121, no. 5, pp. 1346–1356, 2016.
[4] P. Ribéreau-Gayon, Y. Glories, A. Maujean, and D. Dubourdieu, Handbook of Enology, The Chemistry of Wine: Stabilization and Treatments: Second Edition, vol. 2. 2006.
[5] J. A. Suárez-Lepe and A. Morata, Levaduras para vinificación en tinto. AMV Ediciones, 2015.
[6] A. Morata, I. Loira, J. M. Heras, M. J. Callejo, W. Tesfaye, C. González, J. A. Suárez-Lepe, “Yeast influence on the formation of stable pigments in red winemaking,” Food Chem., vol. 197, pp. 686–691, 2016.
[7] G. González-Neves, G. Gil, G. Favre, C. Baldi, N. Hernández, and S. Traverso, “Influence of winemaking procedure and grape variety on the colour and composition of young red wines,” South African J. Enol. Vitic., vol. 34, no. 1, pp. 138–146, 2013.
[8] L. W. Wulf and C. W. Nagel, “High-pressure liquid chromatographic separation of anthocyanins in Vitis vinifera.,” Am. J. Enol. Vitic., vol. 29, pp. 42–49, 1978.
[9] J. Bakker and C. F. Timberlake, Isolation, Identification, and Characterization of New Color-Stable Anthocyanins Occurring in Some Red Wines, vol. 45. 1997.
[10] A. Morata, S. Benito, I. Loira, F. Palomero, M. C. González, and J. A. Suárez-Lepe, “Formation of pyranoanthocyanins by Schizosaccharomyces pombe during the fermentation of red must,” Int. J. Food Microbiol., vol. 159, no. 1, pp. 47–53, 2012.
[11] J. Bakker and C. F. Timberlake, “Isolation, Identification, and Characterization of New Color-Stable Anthocyanins Occurring in Some Red Wines,” J. Agric. Food Chem., vol. 45, no. 1, pp. 35–43, 1997. [12] G. H. Fleet, “Wine yeasts for the future,” FEMS Yeast Res., vol. 8, no. 7, pp. 979–995, 2008.
[13] B. Padilla, J. V. Gil, and P. Manzanares, “Past and future of non-Saccharomyces yeasts: From spoilage microorganisms to biotechnological tools for improving wine aroma complexity,” Front. Microbiol., vol. 7, no. MAR, pp. 1–20, 2016.
[14] M. Combina, A. Elía, L. Mercado, C. Catania, A. Ganga, and C. Martinez, “Dynamics of indigenous yeast populations during spontaneous fermentation of wines from Mendoza, Argentina,” Int. J. Food Microbiol., vol. 99, no. 3, pp. 237–243, 2005.
[15] L. Granchi, D. Ganucci, A. Messini, D. Rosellini, and M. Vincenzini, “Dynamics of yeast populations during the early stages of natural fermentations for the production of Brunello di Montalcino wines,” Food Technology and Biotechnology, vol. 36, no. 4. pp. 313–318, 1998.
[16] K. Chen, C. Escott, I. Loira, J. M. del Fresno, A. Morata, W. Tesfaye, F. Calderon, J. A. Suarez-Lepe, S. Han, S. Benito, “Use of non-Saccharomyces yeasts and oenological tannin in red winemaking: Influence
32
on colour, aroma and sensorial properties of young wines,” Food Microbiol., vol. 69, pp. 51–63, 2018. [17] F. J. Las Heras-vazquez, L. Mingorance-cazorla, F. R. Ã, and J. Mar, “Identification of yeast species from
orange fruit and juice by RFLP and sequence analysis of the 5 . 8S rRNA gene and the two internal transcribed spacers,” Group, vol. 3, pp. 3–9, 2003.
[18] B. Esteve-Zarzoso, C. Belloch, F. Uruburu, and A. Querol, “Identification of yeasts by RFLP analysis of the 5.8S rRNA gene and the two ribosomal internal transcribed spacers,” Int. J. Syst. Bacteriol., vol. 49, no. 1, pp. 329–337, 1999.
[19] J. Sabate, J. Cano, B. Esteve-Zarzoso, and J. M. Guillamón, “Isolation and identification of yeasts associated with vineyard and winery by RFLP analysis of ribosomal genes and mitochondrial DNA,” Microbiol. Res., vol. 157, no. 4, pp. 267–274, 2002.
[20] A. Renard, P. Gómez di Marco, M. Egea-Cortines, and J. Weiss, “Application of whole genome amplification and quantitative PCR for detection and quantification of spoilage yeasts in orange juice,” Int. J. Food Microbiol., vol. 126, no. 1–2, pp. 195–201, 2008.
[21] I. Loira, A. Morata, P. Comuzzo, M. J. Callejo, C. González, F. Calderón, J. A. Suárez-Lepe, “Use of Schizosaccharomyces pombe and Torulaspora delbrueckii strains in mixed and sequential fermentations to improve red wine sensory quality,” Food Res. Int., vol. 76, pp. 325–333, 2015.
[22] A. E. Mylona, J. M. Del Fresno, F. Palomero, I. Loira, M.A. Bañuelos, A. Morata, F. Calderón, S. Benito, J.A. Suárez-Lepe, “Use of Schizosaccharomyces strains for wine fermentation-Effect on the wine composition and food safety,” Int. J. Food Microbiol., vol. 232, pp. 63–72, 2016.
[23] R. A. Peinado, J. C. Mauricio, M. Medina, and J. J. Moreno, “Effect of Schizosaccharomyces pombe on aromatic compounds in dry sherry wines containing high levels of gluconic acid,” J. Agric. Food Chem., vol. 52, no. 14, pp. 4529–4534, 2004.
[24] R. A. Peinado, O. Maestre, J. C. Mauricio, and J. J. Moreno, “Use of a Schizosaccharomyces pombe mutant to reduce the content in gluconic acid of must obtained from rotten grapes,” J. Agric. Food Chem., vol. 57, no. 6, pp. 2368–2377, 2009.
[25] F. Palomero, K. Ntanos, A. Morata, S. Benito, and J. A. Suárez-Lepe, “Reduction of wine 4-ethylphenol concentration using lyophilised yeast as a bioadsorbent: Influence on anthocyanin content and chromatic variables,” Eur. Food Res. Technol., vol. 232, no. 6, pp. 971–977, 2011.
[26] M. W. Lubbers, S. B. Rodriguez, N. K. Honey, and R. J. Thornton, “Purification and characterization of urease from Schizosaccharomyces pombe,” Can. J. Microbiol., vol. 42, no. 2, pp. 132–140, 1996. [27] C. A. Uthurry, F. Varela, B. Colomo, J. A. Suárez Lepe, J. Lombardero, and J. R. García Del Hierro,
“Ethyl carbamate concentrations of typical Spanish red wines,” Food Chem., vol. 88, no. 3, pp. 329–336, 2004.
[28] M. Chandra, I. Oro, S. Ferreira-Dias, and M. Malfeito-Ferreira, “Effect of ethanol, sulfur dioxide and glucose on the growth of wine spoilage yeasts using response surface methodology,” PLoS One, vol. 10, no. 6, pp. 1–15, 2015.
[29] M. Ciani and F. Maccarelli, “Oenological properties of non-Saccharomyces yeasts associated with wine-making,” World J. Microbiol. Biotechnol., vol. 14, no. 2, pp. 199–203, 1998.
[30] P. Domizio, C. Romani, L. Lencioni, F. Comitini, M. Gobbi, I. Mannazzu, M. Ciani, “Outlining a future for non-Saccharomyces yeasts: Selection of putative spoilage wine strains to be used in association with
![Figure 2. Chemical structures of grape anthocyanins [61]](https://thumb-eu.123doks.com/thumbv2/123dok_br/15915019.1093150/22.892.234.659.125.420/figure-chemical-structures-grape-anthocyanins.webp)
![Figure 3. Formation of vitisins A and B [62]](https://thumb-eu.123doks.com/thumbv2/123dok_br/15915019.1093150/23.892.108.789.417.558/figure-formation-vitisins-b.webp)
![Figure 4. Formation of vinylphenolic pyranoanthocyanins by using yeasts with HCDC activity [59]](https://thumb-eu.123doks.com/thumbv2/123dok_br/15915019.1093150/24.892.111.786.125.596/figure-formation-vinylphenolic-pyranoanthocyanins-using-yeasts-hcdc-activity.webp)
![Figure 5. Schematic representation of the fungal ribosomal 18S rRNA gene and ITS regions with primer binding locations [63]](https://thumb-eu.123doks.com/thumbv2/123dok_br/15915019.1093150/26.892.114.784.687.815/figure-schematic-representation-fungal-ribosomal-regions-binding-locations.webp)