Faculdade de Engenharia da Universidade do Porto
Development of immunosensors for detection of
degenerative diseases biomarkers
Mariana Macedo Magalhães
Faculdade de Engenharia da Universidade do Porto
Development of immunosensors for detection of
degenerative diseases biomarkers
Mariana Macedo Magalhães
Dissertation
Master in Biomedical Engineering
Supervisor: Prof.Dra. Maria do Carmo da Silva Pereira
Co-Supervisor: Prof.Dra. Simone Barreira Morais
iv
Resumo
A doença de Parkinson (PD) é uma doença neurodegenerativa comum e debilitante que afeta principalmente a população com mais de sessenta anos. A PD atinge 6 milhões de pessoas em todo o mundo e muitos indivíduos com Parkinson não são diagnosticados ou são mal diagnosticados, especialmente num estágio preliminar da doença. Assim, uma deteção precoce desta doença é pertinente.
Uma vez que não existem testes laboratoriais atualmente definitivos para fins de diagnóstico, o desenvolvimento de imunossensores para a deteção de biomarcadores de Parkinson é de grande interesse.
Os corpos de Lewy são inclusões intraneuronais que caracterizam a doença de Parkinson. O principal componente dos corpos de Lewy é a proteína α-sinucleína que desempenha um papel importante na propagação desta doença neurodegenerativa. Portanto, a-sinucleína é um potencial biomarcador para esta doença neurodegenerativa.
Os imunossensores eletroquímicos têm vantagens significativas em relação à sensibilidade, especificidade, precisão e exatidão quando comparados com outros biossensores. Estes imunossensores combinam a sensibilidade dos métodos eletroquímicos com a especificidade inerente das imunorreações.
Nanomateriais, como nanotubos de carbono e lipossomas, podem melhorar o desempenho do transdutor e proporcionar uma imobilização adequada para o anticorpo α-sinucleína. A voltametria cíclica, a voltametria de onda quadrada e a espectroscopia de impedância eletroquímica são geralmente as técnicas utilizadas para caracterizar e avaliar a construção do imunossensor.
O objetivo deste estudo foi o desenvolvimento de um imunossensor eletroquímico para deteção de α-sinucleína. O biossensor desenvolvido é baseado num elétrodo de carbono vítreo modificado com nanotubos de carbono e lipossomas. Após esta modificação ter sido realizada, o anticorpo foi incorporado para o reconhecimento da a-sinucleína. O imunossensor desenvolvido mostra que a diminuição percentual da corrente de pico Fe(CN)63-/4- é logaritmicamente proporcional
à concentração de α-sinucleína, que pode ser detetada numa ampla gama de concentrações de 10 a 200 ng/mL com um limite de deteção de 10 ng/mL.
vi
Abstract
Parkinson´s disease (PD) is a common and debilitating neurodegenerative disorder mostly
affecting the aging population over sixty. PD afflicts 6 million people worldwide and many individuals with Parkinsonism are undiagnosed or misdiagnosed, especially in an earlier disease stage. Thus, an earlier detection of this disease is pertinent.
Since there are no currently definitive laboratory tests for diagnostic purposes, the development of immunosensors for detection of Parkinson’s biomarkers is of great interest.
Lewy bodies (LBs) are intraneuronal inclusions that characterize Parkinson’s disease. The major component of Lewy bodies is the protein α-synuclein that plays an important role in the propagation of this neurodegenerative disease. Therefore, α-synuclein is a potential biomarker for this neurodegenerative disorder.
Electrochemical immunosensors have significant advantages concerning sensitivity, specificity, accuracy and precision when compared with other biosensors. These immunosensors combine the sensitivity of electrochemical methods with the inherent specificity of immunoreactions. Nanomaterials, such as carbon nanotubes and liposomes, can improve the transducer performance of the biosensor and provide a suitable immobilization platform for α-synuclein antibody. Cyclic voltammetry, square-wave voltammetry and electrochemical impedance spectroscopy are usually the techniques used to characterize and evaluate the immunosensor construction.
The purpose of this study was the development of an electrochemical immunosensor for α-synuclein detection. The developed sensor is based on a glassy carbon electrode modified with carbon nanotubes and liposomes to improve the biosensor performance. After this modification has been done, the antibody was embedded to later recognize α-synuclein.
Under optimal conditions, the developed immunosensor shows that the percentage decrease of the Fe(CN)63-/4- peak current is logarithmically proportional to the α-synuclein concentration, which
can be specifically detected over a wide range of 10 to 200 ng/mL with a detection limit of 10 ng/mL.
Acknowledgements
First of all, I would like to express my gratitude to my supervisors Prof.Dra. Maria do Carmo Pereira and Prof.Dra. Simone Barreira Morais, for all the support and advice throughout this project and for learning opportunities.
Moreover I would like to thank to all members from GRAQ, especially to the electrochemical group, Pedro Carneiro and Filipa Gomes for the constant availability and support. I am also grateful to Joana Loureiro from LEPABE for her help in the liposomes synthesis and antibody treatment.
Finally, I would like to give thanks to my parents, sister, boyfriend, family and friends for giving me the encouragement throughout this project and for their daily and irreplaceable support.
This work was in part funded by projects (i) POCI-01-0145-FEDER-006939 (Laboratório de Engenharia de Processos, Ambiente, Biotecnologia e Energia, UID/EQU/00511/2013) and through project UID/QUI/50006/2013 (Laboratório Associado para a Química Verde- Tecnologias e Processos Limpos) - funded by FEDER through COMPETE2020 - Programa Operacional Competitividade e Internacionalização (POCI) – and by national funds through FCT - Fundação para a Ciência e a Tecnologia and (ii) NORTE-01-0145-FEDER-000005 – LEPABE-2- ECO-INNOVATION, funded by FEDER - Fundo Europeu de Desenvolvimento Regional, through COMPETE2020 – Programa Operacional Competitividade e Internacionalização (POCI) and Programa Operacional Regional do Norte (NORTE2020).
Content List
Resumo………..iv
Abstract ... vi
Acknowledgements ... ix
Content list ... xii
List of Figures ... xiii
List of Tables ... xvii
List of Abbreviations and Symbols ... xix
1 Background Motivation and Project Guideline……….……1
1.1 Motivation ……….. ………1
1.2 Objectives ………..……….1
1.3 Structure of the report ………..………..2
2 State of the art ……..……….3
2.1 Parkinson´s disease ... 3
2.2 Biomarkers for Parkinson´s disease ... 4
2.3 Biosensors ... .5
2.3.1 Electrochemical Immunosensors ………. 6
2.3.1.1 Nanobiomaterials based immunosensors ………. … 7
2.3.1.1.1 Gold Nanoparticles………..8 2.3.1.1.2 Silver Nanoparticles ………..8 2.3.1.1.3 Carbon Nanotubes ………..9 2.3.1.1.4 Liposomes ………..9 2.3.1.2 Antibody-antigen interaction ………...10 2.3.1.3 Immunoassays ……….11
2.3.1.4 Antibody immobilization techniques ………..12
2.3.1.5 Electrochemical Immunosensors for α-synuclein ………..13
3 Electrochemical Concepts……….……….17
3.1 Electrochemical techniques ……….……17
3.1.1 Cyclic Voltammetry ……….….18
3.1.2 Square-Wave Voltammetry ……….19
3.1.3 Electrochemical Impedance Spectroscopy ……….……….…..20
4 Materials and Methods……….22
4.1 Materials……….22
4.2 Electrochemical assay ……….22
4.3 Pre-treatment of the working electrode ……….23
4.4 Drop-cast of single wall carbon nanotubes………..23
4.5 Synthesis, stability and drop cast of liposomes ………..23
4.6 Antibody immobilization ………...26
4.7 α-synuclein detection ………..26
xii
5.1 Characterization of the GC and Au electrode surface………..29
5.2 Modification with carbon nanotubes of the GC and Au electrode……….………...31
5.3 Characterization of liposomes………..33
5.3.1 Deposition of liposomes onto the SWCNTs/GC electrode……….…35
5.4 Antibody immobilization onto the LP/SWCNTs/GC electrode……….36
5.5 α-synuclein detection….……….38
6 Conclusion and Future Directions ……….……….42
List of Figures
Figure 1- Comparison of the substantia nigra in a healthy individual to that in Parkinson’s disease [1]……….. 4 Figure 2 – Typical elements of a Biosensor [2]………6
Figure 3- Schematic representation of the “Y”-shaped structure of an antibody [3]. ………11
Figure 4- Schematic representation of (a) competitive-type immunoassay and (b) non-competitive (sandwich-type) immunoassay format [3]……...12
Figure 5- Scheme of the photoelectrochemical immunosensor developed by Yauri et al. [4]. ………14
Figure 6- Scheme of the electrochemical immunosensor designed by Yauri et al.[5]. ………15
Figure 7 – Typical excitation signal for Cyclic Voltammetry [6]………18
Figure 8 - Theoretical cyclic voltammogram for a reversible case [7]. ………19
Figure 9 - Excitation waveform and current sampling points for Osteryoung squarewave [7]. ………20
Figure 10 – Nyquist plot arising from the Randles circuit [8]………..21
Figure 11 – Randles equivalent circuit for a simple electrochemical system [9]. ………21
Figure 12- Cyclic voltammogram of the bare GC electrode in 0.5 M H2SO4 aqueous solution at 0.2025
V.s-1 scan rate……….30
Figure 13- Cyclic voltammogram of the bare Au electrode in in 0.5 M H2SO4 aqueous solution at
xiv
Figure 14- Comparison of the square-wave voltammograms before (Au) and after the modification with SWCNTs (SWCNTs/Au). Profiles obtained in a 0.1 mol.L-1 PBS solution pH=7.4 containing 5.0 mM
Fe(CN)63-/4- at 0.2025 V.s-1 scan rate……….31
Figure 15- Comparison of the square-wave voltammograms before (GC) and after the modification with SWCNTs (SWCNTs/GC). Profiles obtained in a 0.1 mol.L-1 PBS solution pH=7.4 containing 5.0 mM
Fe(CN)63-/4- at 0.2025 V.s-1 scan rate……….31
Figure 16- Peak height (A) of bare GC electrode (1) and SWCNTs/GC electrode (2). Profiles obtained in a 0.1 mol.L-1 PBS solution pH=7.4 containing 5.0 mM Fe(CN)
63-/4- at 0.2025 V.s-1 scan rate. Error bars
correspond to duplicates.………...32 Figure 17- SEM image of bare GC electrode (left) and modified SWCNTs/GC electrode (right) prepared with a 2 µL of SWCNTs suspension……….32 Figure 18- Zeta size distribution of liposomes……….34 Figure 19- Zeta potential of liposomes………..34 Figure 20- Percentage peak current reduction for different immobilization times a) 15, b) 20 and c) 30 minutes with a ratio of liposomes of 1:10 (V/V). Other experimental conditions: 0.1 mol.L-1 PBS
solution pH=7.4 containing 5.0 mM Fe(CN)63-/4- at 0.2025 V.s-1 scan rate. Error bars correspond to
duplicates………..35 Figure 21- Percentage peak current reduction for a proportion of liposomes a) 1:10000, b) 1:1000, c) 1:500, d) 1:100, e) 1:50, f) 1:30 with an immobilization time of 20 minutes. Profiles obtained in a 0.1 mol.L-1 PBS solution pH=7.4 containing 5.0 mM Fe(CN)
63-/4- at 0.2025 V.s-1 scan rate. Error bars
correspond to duplicates……….……….36 Figure 22- Percentage peak current reduction for LP/SWCNTs/GC modified electrode with different antibody concentrations: a) 10 µg/mL, b) 7 µg/mL and c) 5 µg/mL. Profiles obtained in a 0.1 mol.L-1
PBS solution pH=7.4 containing 5.0 mM Fe(CN)63-/4- at 0.2025 V.s-1 scan rate. Error bars correspond to
duplicates……….………..37 Figure 23- Square-wave voltammograms obtained for LP/SWCNTs/GC (blue) and 10 µg/mL Anti-α-Syn/LP/SWCNTs/GC (red). Profiles obtained in a 0.1 mol.L-1 PBS solution pH=7.4 containing 5.0 mM
Fe(CN)63-/4- at 0.2025 V.s-1 scan rate………37
Figure 24- Square-wave voltammograms obtained for bare GC (Blue), SWCNTs/GC (red), LP/SWCNTs/GC (Green), Anti-α-Syn/LP/SWCNTs/GC (purple), BSA/Anti-α-Syn/LP/SWCNTs/GC (Pink). Profiles obtained in a 0.1 mol.L-1 PBS solution pH=7.4 containing 5.0 mM Fe(CN)
63-/4- at 0.2025 V.s-1
scan rate……….39 Figure 25- Nyquist plots of electrochemical impedance spectra for bare GC (Blue), SWCNTs/GC (red), LP/SWCNTs/GC (Green), Anti-α-Syn/LP/SWCNTs/GC (purple), BSA/Anti-α-Syn/LP/SWCNTs/GC (Pink) and α-Syn/BSA/Anti-α-Syn/LP/SWCNTs/GC (Orange). Profiles obtained in a 0.1 mol.L-1 PBS solution
Figure 26- The several steps for the immunosensor construction………40 Figure 27- Calibration curve of α-syn obtained with the developed immunosensor. Profiles obtained in a 0.1 mol.L-1 PBS solution pH=7.4 containing 5.0 mM Fe(CN)
63-/4- at 0.2025 V.s-1 scan rate. Error bars
correspond to duplicates………..41
xvi
List of Tables
List of Abbreviations and Symbols
List of abbreviations
α-syn α-synuclein Ab Antibody
AgNPs Silver nanoparticles AuE Gold electrode
AuNPs Gold nanoparticles BSA Bovine serum albumin CSF Cerebrospinal fluid CV Cyclic Voltammetry DLS Dynamic light scattering
EIS Electrochemical impedance spectroscopy GC Glassy carbon
GPES General purpose electrochemical system IgG Immunoglobulin G
LBs Lewy Bodies
LDV Laser Doppler velocimetry LOD Limit of detection
LOQ Limit of qualification LP Liposomes
mAb Monoclonal antibodies MWCNTs Multi-wall carbon nanotubes NDs Neurodegenerative diseases NPs Nanoparticles
NSB Non specific binding pAb Polyclonal antibodies PD Parkinson Disease
SEM Scanning electron microscope SWCNTs Single-wall carbon nanotubes SWV Square Wave Voltammetry
xx
1
Chapter 1
Background Motivation and Project
Guideline
1.1. Motivation
Parkinson’s disease (PD) is the second most common neurodegenerative disorder. Almost 6 million people worldwide and about 13 thousands just in Portugal are suffering from Parkinson [10], [11]. Parkinson’s disease is viewed as an increasingly prevalent and progressive disabling neurodegenerative disease that begins years before diagnosis can be made [12], [13]. The physical symptoms that currently characterize the Parkinson disease only appear in advanced stages. An urgent need exists to develop early diagnostic biomarkers for two reasons, first to intervene at the onset of disease and second to monitor the progress of therapeutic interventions that may slow or stop the course of the disease [14]. Thus, the development of a laboratory test for an earlier diagnosis that will allow therapy and disease progress prevention is of great interest [14]. Because of their high specificity and sensitivity, electrochemical immunosensors are extremely useful for diagnostic uses [15].
1.2. Objectives
The aim of this research is to develop an electrochemical immunosensor for detection of α-synuclein, a Parkinson’s disease biomarker, in order to promote an earlier diagnosis of this neurodegenerative disease. The biosensor construction is based on a glassy carbon (GC) electrode modified with carbon nanotubes and liposomes to improve the biocompatibility, sensitivity and
2
for immobilization of the α-synuclein antibody. The immunosensor construction comprises three main steps:
1. Modification of the electrode surface (GC) with single-wall carbon nanotubes (SWCNTs) to create an immobilization platform (SWCNTs/GC) for the biological recognition element and further enhancement of the current signal.
2. Modification of the SWCNTs/GC electrode with liposomes (LP/SWCNTs/GC).
3. Immobilization of the antibody onto the liposomes/SWCNTs modified electrode for the specific recognition of α-synuclein (Anti-α-Syn/LP/SWCNTs/GC).
4. The final stage is to assess the electroanalytical parameters.
1.3. Structure of the report
This work is divided in 6 chapters.
In chapter 1, the key issues are introduced, as well as, the motivation and the main objectives of the work.
In chapter 2, the theoretical aspects about the main topics of this work are presented. The following topics are discussed: Parkinson’s disease, biomarkers for the early diagnosis of the disease, the characteristics of biosensors and the importance of nanomaterials in the development of biosensors.
In chapter 3, the three electrochemical techniques used to characterize and evaluate the construction of the proposed immunosensor are described.
In chapter 4, the reagents, equipments and methods used in the performed experiments are reported.
Chapter 5 presents the results obtained and their discussion. The topics include the characterization of the glassy carbon electrode, the modification with SWCNTs and liposomes, antibody immobilization and finally detection of α-synuclein.
3
Chapter 2
State of the art
2.1. Parkinson´s disease
Neurodegenerative diseases (NDs) are incurable conditions that result in progressive degeneration or loss of neurons in the affected individuals [16]. Parkinson´s disease is the second most common neurodegenerative movement disorder after Alzheimer’s disease and its relentless progression results in severe disability [16]–[18].
PD affects approximately 1% of people over the age of 65 and approximately 4% of the population aged over 80 years [11], [19]. More than 90% of PD cases are sporadic and associated with unknown causes, while 10% represent familial inherited forms resulting from mutations in genes involved in the disease [20].
PD is currently diagnosed based on clinical symptoms, which include tremor, muscle rigidity, bradykinesia, drooping posture, drooling and walking difficulty. In addition to the motor symptoms, mental disorders like depression or psychosis, and autonomic and gastrointestinal dysfunction may occur; all of these disorders considerably impair the quality of life of PD patients [11], [18], [19]. As the disease progresses, the cognitive ability may decreased [17].
The main pathological finding associated with the motor deficits of PD is degeneration of the dopaminergic neurons of the pars compacta of the substantia nigra leading to loss of dopamine in the striatum [17] (figure 1). Clinical symptoms develop after loss of 70–80% of dopamine neurons in
4
PD is characterized pathologically by selective cell loss, astrocytic gliosis and the presence of Lewy neurites as well as Lewy bodies in surviving cells. These pathognomonic changes represent intraneuronal inclusions found in affected brain regions. The major constituent of Lewy bodies has been identified as α-synuclein (α-syn), a lipophilic phosphoprotein [16]. Alpha-synuclein is normally present in the presynaptic terminals of most neurons [20].
The diagnosis of PD currently relies on clinical assessment, with the application of diagnostic criteria. The clinical PD complex consists of the motor syndrome together with a number of non-motor symptoms. Nevertheless, the diagnosis of PD can be difficult, in particular at initial presentation when clinical symptoms are subtle or little specific or only early premotor symptoms might be present [21]. Therefore, it is necessary the development of new and effective techniques for an earlier therapy and disease prevention [22].
2.2. Biomarkers for Parkinson´s disease
With the advent of systems biological concepts there has been a huge interest in biological factors, or biomarkers that can be measured and which allow the identification of individuals at risk. According to its definition by the US National Institutes of Health, a biomarker represents a “characteristic that is objectively measured and evaluated as an indicator of normal biologic processes, pathogenic processes, or pharmacologic responses to a therapeutic intervention”. Biomarkers facilitate early diagnosis, disease prevention, drug target identification, and drug response [11], [23].
5
An ideal PD biomarker should meet the following qualifications: high sensitivity and specificity validated by neuropathological examination, satisfactory test–retest reproducibility, easy accessibility, non-invasive, inexpensive and offer the ability to monitor disease progression without being biased by age, compensatory mechanisms, or treatments [24], [25].
Researchers have identified numerous potential biomarkers that may aid in the differential diagnosis of PD and/or tracking disease progression. Clinical, genetic, blood and cerebrospinal fluid (proteomics, transcriptomics, metabolomics), protein based, biochemical and neuroimaging biomarkers may provide useful tools in the diagnosis of PD and in measuring disease progression and response to therapies. Many potential biomarkers in PD show great promise; however, they need to be assessed for their sensitivity and specificity over time in large and varied samples of patients with and without PD [11], [25], [11].
To date α-synuclein was shown to be the most acceptable potential biomarker for PD [19], [21], [24] but it still needs more investigation and more studies to fortify this idea. In this study α-syn is the biomarker that will be explored.
α-synuclein is the major component of Lewy bodies (the pathologic hallmark of PD); it can be readily measured in plasma, and increased levels of α-synuclein oligomers in plasma appear to have good specificity (85%) for detecting PD compared with controls in some studies. PD patients appear to have increased expression of α-syn in their skin fibroblasts, a potentially easily accessible tissue [11], [26].
α-synuclein has been found in a variety of tissues including blood, urine, cerebrospinal fluid (CSF), saliva, vagus nerve, sympathetic and stellate ganglia, gastrointestinal tract, cutaneous autonomic nerves and submandibular gland [14], [24]. Thus, the quantification of extracellular α-syn in body fluids could be used as a biomarker in order to develop diagnostic tests for PD.
Therefore, α-syn has been intensely researched as a PD biomarker due to the fact that it is a key protein in Lewy bodies, the pathological hallmark of PD and mutations or multiplication of its gene are known to cause familial PD [24], [25].
2.3. Biosensors
Biosensor technology has received heightened interest over the past decade, since it is a promising candidate for lower detection limits with rapid analysis time at relatively low cost [27]. A biosensor is commonly defined as an analytical device that uses a biological recognition system to target molecules or macromolecules which converts a biological response into a quantifiable and processable signal [27]–[29]. A biosensor presents a synergistic combination of biotechnology and microelectronics [30].
6
The purpose of a biosensor is to provide rapid, real-time, accurate and reliable information about the analyte. Ideally, it is a device that is capable of responding continuously, reversibly, and does not perturb the sample [27].
A biosensor consists of three main elements, a bioreceptor, a transducer, and the signal processing system, as shown in Figure 2. The goal is to combine the high sensitivity and selectivity of biological sensing for analytical purposes in various fields of research and technology [27].
The bioreceptor is able to identify the stimulus and can be constructed using enzymes, antibodies, cells, tissues, nucleic acids, peptides, and aptamers. The transducer unit converts this stimulus to a useful output and can be electrochemical, optical, piezoelectric, magnetic or calorimetric. Lastly, the signal processing system involves amplification and display of the output in an appropriate format [27], [31].
Biosensors can be classified in different categories depending either by the type of biological signaling mechanism or by the type of signal transduction they employ [27].
2.3.1 Electrochemical Immunosensors
Immunosensors are antigen-antibody based affinity biosensors, which are highly sensitive and specific. Immnunosensors are of great value for use in clinical testing, since they combine the inherent specificity of immunoreactions with high sensitivity and convenience of physical transducers. Also, in electrochemical immunosensors antibody acts as a bioreceptor and antigen acts as a target analyte and transducer can be able to quantify the antigen concentration by using amperometric, potentiometric, impedimetric or conductometric signals [15], [32], [33].
The greatest advantage of immunosensors is related to selectivity and affinity of the antibody-antigen reaction [34]. The highly specific binding between the antibody and the antibody-antigen involves different types of interaction forces, essentially hydrophobic and electrostatic interactions, van der Waals forces and hydrogen bonding. High specificity is obtained by the molecular recognition of target analytes (generally the antigens) by antibodies (biological recognition element) to form a
7
stable complex on an immunosensor or on the surface of an immunoassay system. On the other hand, sensitivity depends on several factors including the use of high affinity analyte-specific antibodies, their orientation after being immobilized on the immunoassay or immunosensor surface and the appropriate detection system for measuring the analytical signal [35]–[37].
Electrochemical immunosensors are used as care devices since they are portable, simple, easy to use, cost effective and disposable in most cases. Compared with traditional immunoassay methods, electrochemical immunosensors are specific, simple and convenient, and can offer multi target analyses and miniaturization [15], [32], [33]. This technology gains practical usefulness from a combination of selective biochemical recognition with the high sensitivity of electrochemical detection [38].
2.3.1.1. Nanomaterials based immunosensors
Nanotechnology plays an important role in the development of biosensors, since it has generated new innovative materials such as nanoparticles [39]–[41], nanotubes [42], [43], and nanowires [44], [45] which improve the sensitivity and performance of biosensors through new signal transduction technologies [46]–[48].
Nanomaterials attractiveness depends not only on their ability to act as effective immobilization matrices, such as enhancement the long-term stability of bioelectrochemical devices, but also on their intrinsic and unique features (nanoscale dimensions, high surface-area-to-volume ratio, large surface tension force, large catalytic effects and extreme mechanical strength) [49],[46], which provide them unique and different properties compared to other materials.
Nanomaterials provide a suitable microenvironment for proteins immobilization, maintaining their bioactivity, and at the same time facilitating electron transfer between their redox center and electrode surfaces, what have to led to an intensive use of different nanostructured materials for the construction of electrochemical biosensors [50].
Nanostructured surfaces enhance the performance of bioassays due the fact that allow the improvement of biosensors properties and additional increases in their sensitivity by providing high surface areas enabling attachment of a large number of capture antibodies and by facilitating better access of protein analytes to these antibodies [51],[52].
The main advantages of nanomaterials based biosensors are low-background current, high signal-to-noise ratio, and fast electron transfer, including an increase amount of immobilized biomolecules, with consequent increase on the sensitivity of the biosensors [53].
8
A wide variety of nanostructures have been actively investigated for their applications in biosensors, gold and silver nanoparticles and liposomes are three of them that will be further discussed.
2.3.1.1. 1. Gold Nanoparticles
Gold nanoparticles (AuNPs) are one of the most commonly used nanomaterials in biosensors development. AuNPs have received great attention due to their excellents properties, such as ability to permit fast electron transfer between a wide range of electroactive species and electrode materials, high surface-to-volume ratio, high surface energy, biocompatibility and high conductivity essential for sensors based on electrical detection systems. Moreover, AuNPs have attractive optical, electronic, thermal and catalytic properties and also potential applications in the fields of biology, chemistry, medicine, physics and material science. In addition to all this, gold nanoparticles are chemically stable, easy to functionalize and non-toxic [54],[55]–[57].
Synthesis of AuNPs was reported firstly in 1857 by Faraday [57] but the first method for the preparation of AuNPs in aqueous solution was introduced by Turkevich. In this method, AuNPs are prepared by reducing tetrachloroauric acid (HAuCl4) with sodium citrate in boiling water [58], [59].
2.3.1.1.2. Silver Nanoparticles
Silver NPs have attracted great attention in recent years, besides they have characteristics of noble metal nanoparticles also have unique properties of excellent catalytic activity, biocompatibility, low toxicity and antibacterial properties. Recent investigations found that performance of the sensors strongly depended on the distribution, size and shape of AgNPs on the electrode surface [60]. Silver NPs have been substantially employed to detect a variety of biological markers, what makes them be one of the most promising modern analytical methodologies [61].
Synthesis of AgNPs was reported firstly by Lee and Meisel in 1982. To date a large number of methods has already been developed to synthesize AgNPs. In one of them, AgNPs are prepared via reduction of AgNO3 by sodium citrate. Briefly, 16 μL of 0.5 M AgNO3 aqueous solution are introduced
into 10 mL of 1% sodium citrate solution under stirring. Then the resulting mixture is heated to 100 º C and keeps at this temperature for 60 minutes [62], [63].
Other way to synthesis of silver nanoparticles was reported previously by Mulfinger et al. in 2007. On this method, an aliquot of 5 mL silver nitrate (1.0 mM) is added drop-by-drop to 15.0 mL of 2 mM sodium borohydride solution at 0 °C. The reaction mixture is stirred vigorously on a magnetic stirrer. The solution turns to light yellow after the addition of 2 mL of silver nitrate. The AgNPs could be stored in a dark bottle (4 °C) for several weeks [64].
However, the method more simple to synthesize these nanoparticles is based on electrodeposition. In this method, AgNPs are electrochemically deposited on the electrodes using
9
chronoamperometry in 1.0 mM AgNO3 solution, deaerated by bubbling with nitrogen at potential of
0.0 V (vs. Ag|AgCl|KCl (3 M)) for 180 s [60].
2.3.1.1.3. Carbon Nanotubes
Carbon nanotube (CNT) is one form of carbon, name is derived from their size, since the diameter of a CNT is on the order of a few nanometers (approximately 50,000 times smaller than the width of a human hair) [65].
The atoms are arranged in hexagons, the same arrangement as in graphite. The structure of CNT consists of enrolled cylindrical graphitic sheet (called graphene) rolled up into a cylinder with diameter of the order of a nanometer [65].
The two main types of CNT are the single (SWCNTs) and multi-walled (MWCNTs). A single-walled carbon nanotubes (SWCNTs) can be considered to be formed by the rolling of a single layer of graphite (called a graphene layer) into a cylinder. In turn, Multi-walled carbon nanotubes (MWCNTs) consist of multiple layers of graphite rolled in on themselves to form a tube shape with different diameters. The length and diameter of these structures differ a lot from those of SWCNTs and, of course, their properties are also very different [65]. In this work, SWCNTs were used.
Carbon nanotubes (CNTs) are often used in the construction of electrochemical sensors due to their extraordinary properties including high strength and flexibility, high thermal and electrical conductivity, small size with large surface areas, excellent electron transfer rates, and low density [66], [67],[68],[69].
CNTs tend to aggragate due to the strong van der waals forces between nanotubes, leading thus to the poor solubility of CNTs in water and other solvents, which limits the preparation and application of CNT solutions. Among other strategies, dispersion of CNTs in organic solvents, such as dimethylformamide (DMF), has been demonstrated to be effective and capable of produce a stable dispersion [69].
2.3.1.1.4. Liposomes
Liposomes are spherical vesicles composed of a phospholipid bilayer surrounding an aqueous cavity [43], [66], [70]–[73]. This unique structure inherently provides liposomes with a powerful capability for encapsulating hydrophilic, hydrophobic or amphiphilic molecules or nanoparticles [66], [70], [74], [75].
Liposomes are utilized as versatile carriers of chemicals, biomolecules and nanoparticles, finding applications in drug delivery, chemical and biological sensors and also received considerable attention for use as a substrate in sensors for chemical and biological detection [74].
The liposomes, combining its properties with the appropriate signal amplification strategies and transduction techniques could realize enormous signal amplification and achieve ultrasensitive assays [66], [70], [74], [75].
10
In the biosensor fields, liposomes find special application in signal amplification, due to their excellent carrier properties for encapsulation of signal marker compounds across a wide spectrum of sensing modalities. Particular focus was made on the coupling of liposomes with popular sensor materials (enzymes, metal nanoparticles, quantum dots) for highly sensitive and selective detection of chemical and biological species [66], [70], [74], [75].
In addition, liposomes also provide a very flexible, cell membrane-like environment where biological molecules can retain their structure and bioactivity. Moreover, as a versatile immunoassay label, liposome has a large internal volume and outer surface area where thousands of reporter molecules can be entrapped or immobilized and the release of reporter molecules from liposome is controllable [73].
Due of the unique lipid bilayer structure, liposomes showed better advantages over other biostructures in biosensor fabrication such as biocompatibility, stability, easy preparation and modification [74].
2.3.1.2. Antibody-antigen interaction
The central principle of all immunosensors is the high specific recognition of antigens by antibodies to form a stable complex. Antigens can be a variety of different molecules, from proteins to DNA, lipids, etc. In turn, antibodies are a family of glycoproteins known as immunoglobulins (Ig), which are produced by the organism in response to a foreign substance, namely antigen. Five distinct classes of glycoproteins exist in humans (IgA, IgG, IgM, IgD, and IgE), being that IgG is the most abundant class (about 70%) and the most often used in immunoanalytical techniques [3], [76].
Antibodies can be of two types, polyclonal (pAb) and monoclonal (mAb). The first have an affinity for the target antigen and are directed to different binding sites, with different binding affinities. On the other hand, the monoclonal antibodies are produced by cloned cell line, showing higher sensitivity and selectivity than polyclonal antibodies. For this reason, mAb are particularly suitable for the use in immunosensors [73],[74].
Figure 3 shows a representation of the “Y”-shaped structure of an antibody. The open arm portion of the “Y” shape is commonly denoted as F(ab)2, while the non-antigenic binding site in the
base portion is denoted to as Fc. Antigen binding occurs at the ends of two arms (Fab units), between the heavy chain and the light chain. This two types of polypeptide chains (light and heavy) are held together by disulfide linkages [73],[74].
11
2.3.1.3. Immunoassays
Immunoassay is the predominant analytical technique for quantitative measurements, based on the highly specific molecular recognition reaction of antigens by antibodies [3], [34].
The technique consists of heterogeneous and homogeneous immunoassays. In the heterogeneous immunoassays, the antibody or antigen is immobilized on a solid carrier, while homogeneousimmunoassays take place in the solution phase [3], [34].
There are two possible immunoassay formats, “non-competitive” or “competitive”. In a competitive immunoassay (figure 4-(a)) the unlabeled analyte competes with the labeled antigen for a limited number of antibody-binding sites. Quantitative analysis can be obtained by determining the amount of labeled analyte that interacted at the binding sites. The electrochemical responses obtained from the labeled antigens are inversely proportional to the concentration of the target antigen [3], [34].
On the other hand, in a non-competitive immunoassay (figure 4-(b)), also known as a sandwich-type immunoassay, the sample analyte is captured by an excess of a capture antibody, separating it from the bulk sample. The captured analyte is then exposed to a secondary antibody (Ab2), which will only bind to the existing capture antibody-analyte complex. In this format of immunoassay the signal is directly proportional to the analyte concentration [3], [34].
An important issue in immunoassays is the minimization of nonspecific binding (NSB) of interfering species in samples such as serum or blood, as well as NSB of the labeled Ab2 that arises
12
when this signal producing species is bound to non-antigen sites on the sensor. NSB is usually minimized by washing with a cocktail that includes casein or bovine serum albumin (BSA) and detergents in NSB blocking steps [3], [34].
2.3.1.4. Antibody immobilization techniques
In the construction of immunosensors, the immobilization procedures of the antibodies on the surfaces of transducers are an important step. The manner in which a antibody is immobilized onto a solid phase is a critical aspect that requires careful consideration in the design of an immunosensor system, whether it is competitive or non competitive [15][3].
The amount of the immobilized immune molecules on the surface, their conformational stability, remaining activity after the immobilization procedure and their orientation on the transducer surface clearly have a direct impact on the level of stability, sensitivity and longevity of an immunosensor [3], [77].
There are several methods for the preparation of oriented antibody molecular layers on the surface of the transducer including physical and chemical adsorption. These commonly used immobilization strategies are described below.
The simplest immobilization strategy of antibodies is physical immobilization based on the adsorption of proteins onto electrode surface via non-covalent interactions. Some of the forces involved with the adsorption of antibodies are hydrogen bonds, hydrophobic interaction, van der Waals and electrostatic forces. However, physical immobilization is considered to be non-specific,
Figure 4- Schematic representation of (a) competitive-type immunoassay and (b) non-competitive
13
as no reaction occurs between residues and often results in an unpredictable number of inaccessible antigen-binding sites, possible denaturation and very low stability. Therefore, covalent immobilization are typically preferred [78], [79].
Covalent bonds are mostly formed between side-chain-exposed functional groups of proteins with suitably modified electrodes, resulting in an irreversible binding and producing a high surface coverage. The general chemical immobilization method involves immobilization of Abs or other proteins based on the reaction between amino residues on the protein and groups on the sensing surface that can react with amines [79].
Self-assembled monolayers (SAMs) is a frequently method used in covalent immobilization [80]–[83]. During the self-assembly process, the constituent subunits (atoms, molecules, biomolecules, simple biological structures, etc) combine in such a way that they form a secondary, more complex structure with fewer degrees of freedom. SAM represents an easy way to provide a convenient, flexible, and simple system to tailor the interfacial properties of metals, metal oxides, and semiconductors and link materials with totally different physical and chemical properties. SAMs is the most important method and most extensively studied, because of their promising and current applications on several fields of nanotechnology. Self assembly of thiol and dithiol on metals, particularly on gold have attracted considerable attention due to their easy preparation that can be done both in gas and liquid phase [80], [81].
Covalent and noncovalent immobilization of antibodies has been extensively reviewed [3], [77], [84]. Covalent immobilization presents great advantages in the fabrication of electrochemical immunosensors. Nevertheless, the affinity efficiency of immobilized proteins and consequently the performance of the immunosensor can be improved by two main approaches, the oriented immobilization and the utilization of nanomaterials [78], [79].
Oriented immobilization means that the capture probes are immobilized in such a way that antibodies recognition sites (Fab) are uniformly arranged and exposed to the sample solution [79]. A method to ensure proper orientation is the EDC/NHS based coupling method that converts antibody into NHS ester intermediate, which is highly reactive, forming peptide bond with amine functionalized surface which facilitates Ab immobilization [78]. This immobilization method have been applied in several studies ([4], [85]–[87]).
2.3.1.5. Electrochemical immunosensors for α-synuclein
After an extensive survey on several scientific platforms, six original research articles were found about biosensors for α-syn [4], [5], [88]–[91], but only two of this group of six were about electrochemical immunosensors for this protein [4], [5].
Yauri An et al. [4] designed a photoelectrochemical immunosensor for the detection of α-syn using Au-doped TiO2 nanotube arrays. This design coupled a primary antibody to the surface of the
14
sensitivity of the method and the signal amplification were improved by the attachment of Ab2-Au-GOx bioconjugates, featuring a secondary antibody, Ab2.This immunosensor exhibited a linear range from 0.050 to 100 ng.mL-1 and a limit of detection (LOD) of 34 pg.mL-1. The scheme of the sensor is
represented in figure 5. This immunosensor for α-synuclein had good performance with excellent stability, high sensitivity and reproducibility.
Figure 5- Scheme of the photoelectrochemical immunosensor developed by Yauri et al. [4].
One year later, the same authors, Yauri et al. [5], developed a different electrochemical immunosensor design for α-synuclein based on dual signal amplification strategy.
This method captured α-syn on the surface of the PAMAM-Au nanocomposite, which was immobilized on the surface of the electrode via covalent binding through the carboxyl groups of the modified poly-o-aminobenzoic acid (poly-o-ABA) glassy carbon electrode and the amino groups of PAMAM-Au.
This developed strategy showed an excellent performance with stability and high sensitivity. This immunosensor exhibited a linear range from 20 to 200 pg.mL-1 and a LOD of 14.6 pg.mL-1. The
15
17
Chapter 3
Electrochemical Concepts
3.1 Electrochemical techniques
Electrochemical techniques are powerful and versatile analytical techniques that offer high sensitivity, simplicity, accuracy, and precision as well as large linear dynamic range, with relatively low-cost instrumentation, portability and providing information about kinetics and thermodynamics [92], [93].
These electrochemical analyses commonly require the use of three electrodes- the working electrode, the reference electrode and the counter electrode- and also a contacting solution (electrolyte) [94]. The working electrode is where the reaction of interest occurs [92]. Saturated calomel or silver chloride are used as reference electrodes and inert conducting materials (platinum wire or graphite rod) are used as the auxiliary electrode [95]. The three electrodes are connected to a potentiostat, an instrument which controls the potential of the working electrode and measures the resulting current [92].
18 In my research I will work with Cyclic Voltammetry, square-wave voltammetry and electrochemical impedance spectroscopy.
3.1.1. Cyclic Voltammetry
Cyclic Voltammetry (CV) is the technique that is widely used for acquiring qualitative information about electrochemical reactions [92].
For this technique, a simple potential wave form that is used often in electrochemical experiments is the linear wave form, that is, the potential is continuously changed as a linear function of time. The rate of change of potential with time is referred to as the scan rate. The CV method is a potentially controlled electrochemical experiment in which the direction of the potential is reversed at the end of the first scan. The waveform is usually the form of an isosceles triangle. The results are plot as current against voltage and it is called voltammogram (Figure 7). The important parameters of CV scan are the magnitude of the peak current and the peak potentials. The obtained voltammogram is informative concerning the oxidation and reduction reactions from which the required information can be acquired [92], [96].
In the forward scan, a cathodic peak is obtained and in the backward, an anodic peak appears. For a reversible process, the cathodic and anodic peak currents are equal in magnitude (|ipc|=|ipa|), as shown in Figure 8. The difference between the two peak potentials increases by decreasing the reversibility [97].
Its main advantage in electroanalysis is its ability to characterize an electrochemical system [7]
19
3.1.2. Square-Wave voltammetry
Square-wave voltammetry (SWV) is a powerful electrochemical technique that can be applied for analytical, kinetic and mechanistic studies [7], [92]. SWV is a large amplitude differential technique in which a waveform composed of symmetrical square wave is applied to the working electrode. The form of SWV is typically based on the so-called Osteryoung square-wave [98]. Figure 9 shows the excitation waveform used in Osteryoung SWV [7].
The current response is sampled twice during each square-wave cycle, once at the end of the forward pulse, and once at the end of the reverse pulse. Using this technique is possible to generate three possible current potentials plots- forward current versus potential, reverse current versus potential or difference current versus potential [92], [98].
SWV provides several advantages to the electroanalyst. First, the application of the SWV waveform is that the detrimental effects of charging current are reduced and so the scan rate can be increased drastically. The greater advantage of SWV is that a response can be found at a high effective scan rate, thus reducing the scan time. Because of this advantage, SWV is employed more often than other pulse techniques. The other advantage of SWV, the difference of currents is larger than either forward or reverse current, so the height of the peak is usually quite easy to read, thus increasing the accuracy [92], [98].
SWV has an advantage over CV in the following three areas: a) Speed: SWV effectively removes the background current from the measurement and it allows to program higher scan rates. For faster measurements and/or investigate faster reactions; b) Sensitivity: SWV can detect micromolar concentrations of electroactive species. In contrast, CV can detect only millimolar concentrations; c) Dynamic Range: The dynamic range of a detection system is defined as its ability to respond to both high and low concentrations of electroactive species. Since SWV effectively
20 removes the background current from a measurement, it has a wide dynamic range. This allows you to use concentration as an experimental variable [7].
3.1.3. Electrochemical Impedance Spectroscopy
Electrochemical Impedance Spectroscopy (EIS) can be used as a label-free detection tool from many biosensors. Appropriate surface modification allows the electrode to selectively interact with target analytes or to form host-guest complexes. EIS sensitively analyses the interactions of modified electrodes with analytes, producing measurable electric signals. The impedance methods can be used for analyte detection [99].
EIS is based on the perturbation of a system at equilibrium by a small amplitude AC potential wave form (typically 5-10 mV). It is therefore fundamentally different from the two large amplitude techniques discussed above in that the perturbations to the system under study are small. Another advantage of EIS is that a range of different experimental time scales are examined within the one experiment by examining the impedance of the system over a range of frequencies [9].
The impedance spectrum (Nyquist plot), which provides visual insight into the systems dynamics, consists of a semicircle at high frequencies and a straight line at low frequencies, as shown in Figure 10. The Randles circuit of this system, composed by resistors and capacitors is showed in Figure 11. RCt is the charge-transfer resistance; Cd is the double-layer capacitance; ZW is the Warburg
impedance and Rs is the solution-phase resistance. At lower frequencies the impedance is
diffusion-controlled, whereas at high frequencies, the impedance is determined by slow electron transfer kinetics [8], [93].
21
Figure 11 –Randles equivalent circuit for a simple electrochemical system [9].
22
Chapter 4
Materials and Methods
4.1 Materials
Alumina suspension (γ-Al2O3) 1.0 µm, 0.3 µm and 0.05 µm were purchased from Gravimetria
(Spain). All other chemicals were of analytical reagent grade. Sulfuric acid (H2SO4, 98%) and absolute
ethanol were purchased from Panreac (Spain). Potassium ferrocyanide (K4[Fe(CN)6].3H2O), potassium
ferricyanide (K3Fe(CN)6), potassium phosphate monobasic (KH2PO4), sodium phosphate dibasic
(Na2HPO4), sodium chloride (NaCl) and potassium chloride (KCl) were purchased from Riedel-de Haën
(Germany). SWCNTs and human antigen α-synuclein (S7820) were purchased from Sigma-Aldrich (Steinheim, Germany). Mouse monoclonal to α-Synuclein (1 mg.mL-1) IgG (ab27766) was purchased
from Abcam (U.K.). Ultrapure water (18.2 MΩ.cm-1 resistivity) was produced by a Milli-Q Simplicity
185 system (Millipore, Molsheim,France). Nitrogen (99.999%) was obtained from LINDE (Portugal). Weight measurements were performed using an analytical balance (Mettler Toledo) with a 0.00001 g precision. Eight inches polishing microcloth (Buehler U.S.A.) was used to perform the mechanical cleaning of the working electrode.
4.2. Electrochemical assay
The voltammetric measurements were realized using an Autolab electrochemical system (Eco Chemie, The Netherlands) equipped with PGSTAT-30 and General Purpose Electrochemical system for Windows (GPES) software and NOVA Impedance spectroscopy (NOVA). The electrochemical cell was
23
mounted using a conventional three-electrode cell which included a glassy carbon electrode (GC, surface area 0.071 mm2, Metrohm, The Netherlands) as a working electrode, a Ag|AgCl|KClsat
reference electrode and a platinum counter electrode. The supporting electrolyte for the electrochemical studies was a solution of 5 mM K3[Fe(CN)6]/K4[Fe(CN)6]. Posteriorly, this solution was
diluted with phosphate buffer solution prepared with NaCl, KCl, Na2HPO4.H2O, KH2PO4 (PBS, 0.1
mol.L-1, pH 7.4).
Experiments were performed by CV, SWV and EIS using Fe(CN)63-/4- as electroactive indicator.
CV measurements were made using a scan rate of 0.005 V/s. SWV assays were performed by varying the potential from -0.25 to 1.1 V at a 0.2025 V/s scan rate and at a frequency of 50 Hz. EIS measurements were performed using a set potential of 0.2 V and a frequency range from 10-1 to 105
Hz with an amplitude perturbation of 5 mV.
4.3. Pre-treatment of the working electrode
The glassy carbon electrode was carefully polished with alumina suspensions 1.0, 0.3 and 0.05 µm using microcloth pads to obtain a mirror-like surface and then rinsed with ultrapure water. Next, the glassy carbon electrode was cleaned with absolute ethanol in ultrasonic bath during 5 minutes. For the electrochemical activation of the surface, the electrode was cycled from 0.0 to +1.6 V in 0.5 mol.L-1 H
2SO4 solution at 100 mV.s-1. This step was also used to ensure the cleanliness of the electrode,
applying successive cycling until obtaining a typical glassy carbon voltammogram.
4.4. Drop cast of single wall carbon nanotubes
A suspension of SWCNT 1 mg.ml-1 was prepared in DMF, added by drop-casting on the surface
of the electrode and set to dry for approximately 30 minutes, in a 50º C oven to form a SWCNT film. The amount of SWCNT suspension to modify the electrode was the previously optimized value of 2.0 µL.
4.5. Synthesis, Stability and drop cast of liposomes
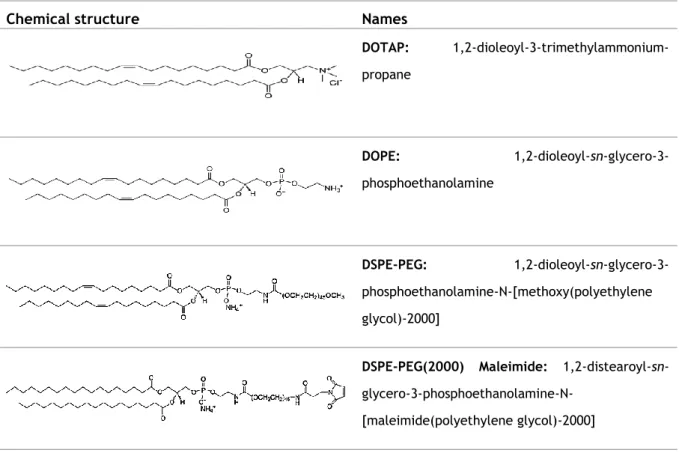
All the lipids were purchased from Avanti Polar Lipids: DOTAP (1,2-dioleoyl-3-trimethylammonium-propane (chloride salt), MW 698.542), DOPE (1,2-dioleoyl-sn-glycero-3-phosphoethanolamine, MW 744.034), DSPE-PEG2000
(1,2-distearoyl-sn-glycero-3-phosphoethanolamine-N-[amino(polyethylene glycol)-2000] (ammonium salt), MW 2790.49), DSPE-PEG2000-mal (1,2-distearoyl-sn-glycero-3-phosphoethanolamine-N-[maleimide(polyethylene
24 The chemical structure of the phospholipids is shown in table 4.1. The pegylated phospholipids have a molecular weight of approximately 2000 Da in order to confer stability to the liposomes without significantly vary their size.
Table 4.1: Chemical structure of the lipids used to prepared liposomes
Liposomes were prepared by the classical method of the lipid film hydration [100]. DOTAP, DOPE, DSPE-PEG2000, DSPE-PEG2000-mal were dissolved in chloroform (Mw 119.38, Sigma-Aldrich), at
the molar ratio of 70:74.5:5.7:735.4, and the solvent was evaporated to dryness with a nitrogen stream in a rotary evaporator. The resultant dried lipid film was dispersed in HEPES (10 mM, pH=7.4, Sigma-Aldrich) with a final lipid concentration of 10 mM and the mixture was vortexed to yield LMV (multilamellar vesicles). In order to obtain SUVs (small unilamellar vesicles), the suspension was sonicated during 1 min, with a pulse on 10 seconds and a pulse off 15 seconds.
The stability of the liposomes was analyzed through the size and zeta potential variation. The size of the liposomes was measured by dynamic light scattering (DLS) technique at room temperature. Zeta potential was also measured for the same samples by the laser doppler velocimetry (LDV) method. The measurements were performed in a Malvern Zetasizer instrument.
The zeta potential of dispersed colloidal particles can be measured by electrophoresis. The electric force causes the particle to move in relation to a stationary liquid at a constant velocity. The ratio of the velocity to the electric field 𝐸 is the electrophoretic mobility,𝜇𝐸. The mobility is
Chemical structure Names
DOTAP: 1,2-dioleoyl-3-trimethylammonium-propane DOPE: 1,2-dioleoyl-sn-glycero-3-phosphoethanolamine DSPE-PEG: 1,2-dioleoyl-sn-glycero-3-phosphoethanolamine-N-[methoxy(polyethylene glycol)-2000]
DSPE-PEG(2000) Maleimide:
1,2-distearoyl-sn- glycero-3-phosphoethanolamine-N-[maleimide(polyethylene glycol)-2000]
25
𝑞 =
4𝑛𝜋
𝜆
𝑠𝑖𝑛
𝜃
2
𝑅
𝐻=
𝑘
𝐵𝑇
6𝜋𝜂𝐷
converted into zeta potential, 𝜁 , using the Smoluchowski equation 4.1, where 𝜂 is the viscosity of the solution and 𝜀 is the permittivity of the solution.
(4.1) DLS, also referred to as quasi-elastic light scattering, enables the determination of particle size and size distribution in dispersions. This method is based on the fluctuations in the intensity of light scattered by a small volume of a solution in the microsecond time range which are directly related to the Brownian motion of the solute [101]. Submicrometer size particles in suspension exhibit significant random motion because of collisions with the molecules of the surrounding liquid medium (Brownian motion). As a result, when light irradiates a colloidal dispersion, the phases of the scattered waves fluctuate randomly in time. The time dependence of the intensity fluctuations, calculated from the autocorrelation function of the scattered intensity, can be related to the diffusion coefficient of the particles. For a monodisperse system, the normalized autocorrelation function, g^((1)), is an exponential decay,
𝑔(1)(𝑡′) = 𝑒𝑥𝑝(−𝛤𝑡′) , (4.2) where 𝑡′ is the decay time of the autocorrelation function, 𝛤 is the decay constant, which is related to the diffusion coefficient 𝐷 by
D = Γ
q2 , (4.3)
where 𝑞 is the scattering wave vector, which depends on the wavelength of the light source, 𝜆, the solvent refractive index, 𝑛, and the angle of detection, 𝜃.
, (4.4)
The hydrodynamic averaged intensity radius of the particles, 𝑅𝐻, can be calculated from the diffusion coefficient 𝐷, using the Stokes-Einstein relation
(4.5)
where 𝑘𝐵 is the Boltzmann constant, 𝑇 the absolute temperature and 𝜂 is the viscosity of the medium. This relation is the basis of the particle size determination by dynamic light scattering, but it is valid only for monodisperse particles.
After the liposomes are made, fresh liposomes solution were diluted in HEPES buffer and then a suitable amount was added by drop-casting on the surface of the electrode and set to dry for approximately 20 minutes, in a 4º C. The amount of liposomes suspension to modify the electrode was 5.0 µL, since it proved to be enough to cover the electrode surface. The immobilization time was
𝜁 =
𝜂𝜇
𝐸𝜀
26 optimized, as well as the concentration of the solution using different concentrations 1:30, 1:50, 1:100, 1:500, 1:1000 and 1:10000 (V/V).
4.6. Antibody immobilization
Antibody selective α-synuclein was immobilized on the lipossomes using thiol (-SH) groups. A mixed solution containing 1 μL of EDTA (0.28 mol.L-1), 82.6 μL of 2-iminothiolane (0.006 mM) and monoclonal antibody against α-synuclein was prepared in PBS; the volume of PBS added to the antibody was the necessary to make up a volume of 110.6 μL. The prepared solution reacted for 50 minutes at room temperature. Then 389.4 μL of PBS were added to the solution in order to make up a volume of 500 μL needed for the next purification step. Then, the resulting solution was purified by passing it through a sephadex PD MiniTrap G-25 column (GE Healthcare), following the gravity protocol. Then the column was eluted with 1.0 mL of PBS and the eluate was collected to an eppendorf. Three concentrations of antibody in PBS were tested (5 μg/mL, 7 μg/mL and 10 μg/mL). The LP/SWCNTs/GC modified electrodes were immersed in 250 μL of the different antibody solutions, reacted for 2 hours at room temperature and then were incubated at 4 °C for 12 hours.
Finally, the remaining non-specific binding sites on the electrode surface were blocked with BSA at 4ºC for 5 minutes. For that purpose, two concentrations of BSA were tested 1.0% and 0.5% (w/v).
4.7. α–synuclein detection
Lastly, after antibody immobilization, the Anti-α-Syn/LP/SWCNTs modified electrode was immersed in 250 μL of α-Syn solution for 5 minutes at room temperature. The antigen solutions were prepared in PBS (0.1 M, pH=7.4). In this study, six concentrations of α-Syn (10, 30, 50, 100, 150 and 200 ng.mL-1) were used. To analyze the results, inhibition percentages (IR, %) corresponding to the selected antigen concentration were calculated by the following equation 4.6:
%𝐼𝑅 = [1 − (𝐼𝑝
𝐼𝑝0)] 𝑥 100 , (4.6) where Ip0 and Ip are the peak currents before and after the incubation of the immunosensor with the
antigen solution.
The detection (LOD) and qualification (LOQ) limits were determined (4.7 and 4.8) through the standard deviation of the intercepts and the average of slopes of the straight lines from the analytical curves [99]. The LOD is the minimum concentration from which it is possible to detect the presence of the desired compound, with a certain statistical certainty, i.e., with a precision and accuracy. All measurements were made, at least, in duplicate.
LOD =
3Sy x
27
LOQ =
10Sy x
b
(4.8) where b represents the intercept of the regression line and Sy/x is the standard deviation in the y-direction.
29
Chapter 5
Results and discussion
5.1. Characterization of the GC and Au electrode surface
The electrode surface of the tested unmodified working electrodes (GC and Au) was qualitatively evaluated by cyclic voltammetry to ensure that it was properly cleaned and could be used in the next stages. The GC electrode was scanned 10 times through CV from 0.0 V to +1.6 V vs. Ag/AgCl reference electrode in 0.5 M H2SO4. The obtained voltammogram is presented in
figure 12 andrepresents no evidence of Faradaic processes, which is typical of a “clean” surface as the current only causes accumulation of electrical charge. The increase in current at potentials higher than 1.2 V is due to the dissociation of water [100],[101].
30
The attained cyclic voltammogram for Au electrode (figure 13) in the selected range of potentials include: the electrochemical double layer region, the formation of a monolayer of oxide (and its subsequent reduction), and the beginning of the reduction of protons (of the solvent) [102].The voltammogram obtained is in agreement with the typical and characteristic one found in literature [102]. In the first region (0 – 0.86 V), the current is associated with charging of the double layer capacitance (which itself may vary with potential) [102]. In the second region (0.86 – 1.63 V), surface oxidation/reduction processes occur; then in response to a change of potential with time, a faradaic current flows through the interface [102]. In figure 13, the voltammogram exhibited one broad oxidation peak at 1.37 V, attributed to the formation of Au surface oxides, and a sharp reduction peak at 0.900 V due to subsequent removal of the oxides.
-4.00E-06 -2.00E-06 0.00E+00 2.00E-06 4.00E-06 6.00E-06 8.00E-06 1.00E-05 1.20E-05 1.40E-05 0 0.5 1 1.5 2 i/ A E/V
Figure 12- Cyclic voltammogram of the bare GC electrode in 0.5 M H2SO4 aqueous solution at 0.2025 V.s-1 scan
rate. -3.50E-05 -3.00E-05 -2.50E-05 -2.00E-05 -1.50E-05 -1.00E-05 -5.00E-06 0.00E+00 5.00E-06 1.00E-05 1.50E-05 0 0.5 1 1.5 2 i/ A E/V
Figure 13- Cyclic voltammogram of the bare Au electrode in in 0.5 M H2SO4 aqueous solution at 0.2025 V.s-1
31
5.2. Modification with carbon nanotubes of the GC and Au
electrode
In this work, four different glassy carbon electrodes were studied and as mentioned previously the redox pair Fe(CN)63-/4- was used as electrochemical indicator to characterize the performed
modifications.
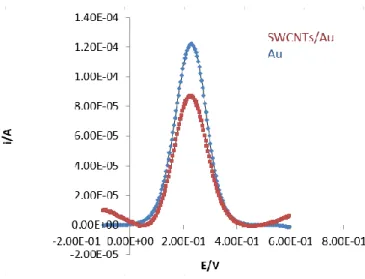
At this stage, the objective was to select the most appropriate electrode to modify with SWCNTs. In order to improve the response of the system, the surface of the GC and Au electrode was modified with SWCNTs. According to literature data, the GC electrode provides a hydrophobic surface, which stabilizes the SWCNTs film. The main role of the SWCNTs is the enhancement of the current signal, for this reason, modification with SWCNTs proved to have a positive effect on the GC electrode (figure 15) but not in Au electrode (figure 14). Thus, the selected electrode for the proposed immunosensor construction was GC electrode.
Figure 14- Comparison of the square-wave voltammograms before (Au) and after the modification with SWCNTs
(SWCNTs/Au). Profiles obtained in a 0.1 mol.L-1 PBS solution pH=7.4 containing 5.0 mM Fe(CN)
63-/4- at 0.2025 V.s -1 scan rate.
Figure 15- Comparison of the square-wave voltammograms before (GC) and after the modification with SWCNTs
(SWCNTs/GC). Profiles obtained in a 0.1 mol.L-1 PBS solution pH=7.4 containing 5.0 mM Fe(CN)
63-/4- at 0.2025 V.s -1 scan rate.
32
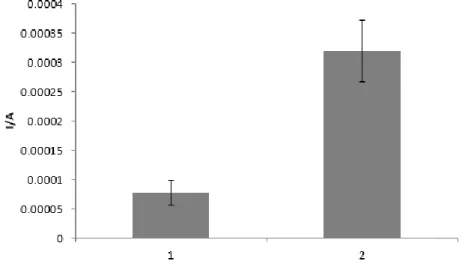
The percentage increase of the peak was studied using SWV. Four different GC electrodes were tested. The mean peak height results before and after modification with SWCNTs can be observed in the figure 16. The peak height on the SWCNTs/GC electrodes is 314% greater than the peak height on the GC electrodes, which proves the excellent conductivity characteristics of SWCNTs.
Figure 17 displays a SEM image of bare GC and surface modified with 2 µL of SWCNTs suspension. The surface of the modified SWCNTs/GC electrode is completely covered with SWCNTs, producing a very uniform distribution of the suspension over the electrode surface.
Figure 16- Peak height (A) of bare GC electrode (1) and SWCNTs/GC electrode (2). Profiles obtained in a 0.1
mol.L-1 PBS solution pH=7.4 containing 5.0 mM Fe(CN)
63-/4- at 0.2025 V.s-1 scan rate. Error bars correspond to
duplicates.
Figure 17- SEM image of bare GC electrode (left) and modified SWCNTs/GC electrode (right) prepared with a 2 µL
33
5.3. Characterization of liposomes
The liposomes prepared by the classical method of the lipid film hydration exhibited a mean hydrodynamic size of 283 nm and a mean zeta potential of 32 mV, as it can be seen in the results of
34 DLS (figure 18) and LDV (figure 19), respectively. The stability of the liposomes was studied for 4 days.
On the second day, the zeta potential decreased to 26 mV and on the third day to 21 mV while the size increased to 304 nm and to 312 nm, respectively. Thus, fresh liposomes were prepared every two days.
Figure 18- Zeta size distribution of liposomes.
![Figure 1- Comparison of the substantia nigra in a healthy individual to that in Parkinson’s disease [1]](https://thumb-eu.123doks.com/thumbv2/123dok_br/15719488.1070305/29.892.242.647.109.427/figure-comparison-substantia-nigra-healthy-individual-parkinson-disease.webp)
![Figure 5- Scheme of the photoelectrochemical immunosensor developed by Yauri et al. [4]](https://thumb-eu.123doks.com/thumbv2/123dok_br/15719488.1070305/39.892.127.779.254.586/figure-scheme-photoelectrochemical-immunosensor-developed-yauri-et-al.webp)
![Figure 6- Scheme of the electrochemical immunosensor designed by Yauri et al.[5].](https://thumb-eu.123doks.com/thumbv2/123dok_br/15719488.1070305/40.892.141.790.156.426/figure-scheme-electrochemical-immunosensor-designed-yauri-et-al.webp)
![Figure 7 – Typical excitation signal for Cyclic Voltammetry [6].](https://thumb-eu.123doks.com/thumbv2/123dok_br/15719488.1070305/43.892.295.634.731.912/figure-typical-excitation-signal-cyclic-voltammetry.webp)
![Figure 9 - Excitation waveform and current sampling points for Osteryoung squarewave [7]](https://thumb-eu.123doks.com/thumbv2/123dok_br/15719488.1070305/45.892.299.610.189.422/figure-excitation-waveform-current-sampling-points-osteryoung-squarewave.webp)
![Figure 11 – Randles equivalent circuit for a simple electrochemical system [9].](https://thumb-eu.123doks.com/thumbv2/123dok_br/15719488.1070305/46.892.286.588.121.317/figure-randles-equivalent-circuit-a-simple-electrochemical-system.webp)