Article
J. Braz. Chem. Soc., Vol. 23, No. 11, 1989-1996, 2012. Printed in Brazil - ©2012 Sociedade Brasileira de Química 0103 - 5053 $6.00+0.00
A
*e-mail: [email protected]
A Multi-Syringe Flow System for Monitoring Moderately Fast Chemical Reactions
Víctor Cerdà,a Carlos Ubide*,b and Juan Zuriarrainb
aDepartament de Química, Facultad de Ciències, Universitad de les Illes Balears,
Carretera de Valdemossa, km 7.5, Mallorca, Spain
bDepartament de Química Aplicada, Facultad de Química, Universidad del País Vasco,
UPV/EHU, 20018-San Sebastián, Spain
O modo zona de interrupção da técnica de análise por injecção em fluxo baseada em multiseringas (MSFIA) foi explorado para monitoramento de reações moderadamente rápidas. O desempenho da MSFIA se baseia na utilização de duas câmaras de mistura eficientes (uniões cruzadas) e um motor que impulsiona uma barra que empurra um número de seringas que fornecem tempos mortos de cerca de 20 ms. A bem-conhecida geração de bromo a partir de uma mistura de bromato-brometo em meio ácido é utilizada como sistema químico. A taxa encontrada (3,9 ± 0,7 mol-3 L3 s-1) concorda com valores apresentados na literatura. Reagentes em statu
nascendi também foram produzidos e usados uma vez. Como exemplo, bromo foi gerado e usado imediatamente na bromação de ácido salicílico, evitando a manipulação de produtos químicos perigosos; a taxa encontrada (5,5 ± 0,8 mmol-1 L s-1) concorda com valores fornecidos na literatura. A metodologia é uma alternativa fácil para o sistema tradicional de fluxo interrompido utilizado em reações moderadamente rápidas.
The zone stopping mode of the multi-syringe flow injection analysis (MSFIA) technique was exploited for monitoring of moderately fast reactions. The performance of MSFIA relies on the use of both efficient mixing chambers (cross unions) and a motor that propels a bar pushing up a number of syringes to provide dead times of about 20 ms. The well-known bromine generation from a bromate-bromide mixture in acidic medium is used as chemical system. The rate constant found (3.9 ± 0.7 mol-3 L3 s-1) agrees to values given in literature. Reagents in statu nascendi were also produced and used at once. As an example, bromine was generated and immediately used in the bromination of salicylic acid, avoiding the handling of dangerous chemicals; the rate constant found (5.5 ± 0.8 mmol-1 L s-1) agrees to the values given in literature. The methodology is an easy alternative to the traditional stopped-flow apparatus used in moderately fast reactions.
Keywords: multi-syringe flow analysis, zone stopping, bromine generation, bromine-salicylic acid reaction
Introduction
Multi-syringe flow injection analysis (MSFIA) was introduced as a kind of flow injection analysis (FIA) in which high precision syringe pumps are used instead of peristaltic pumps.1 This makes unnecessary the
use of flexible tubing, avoiding tube squashing, their replenishment and recalibration of the system. MSFIA has been used to solve a wide range of analytical problems and in some circumstances the reaction kinetics plays an important role. Measurements can be taken either in continuous or zone stopping mode and this is possible because of the
precise timing of fluidic manipulations. Summing up, flow injection methods (and related techniques) have had a relevant acceptance over the last 35 years for analytical applications2,3 and seem to be an active area of research
for the next years.4 However, some expectations on the
use of FIA for reaction rate measurements (kinetic studies) have not been fulfilled, even though its possibilities and potentialities were announced a few years after the technique blooming.5
One of the most popular methods to follow rapid reactions is the stopped-flow technique.6 A comprehensive
study on the development of this methodology can be found in the literature.7 The drive mechanism is frequently
gas and measurements can be taken after a time as low as 10-4 s, though the usual range is 1 ms to 10 s. Stopped-flow
apparatus are expensive, but simpler and more economic stopped-flow spectrometer accessories are available nowadays with dead times of 8-10 ms. In the case of FIA, peristaltic pumps are used to propel liquids through the system and dead times down to 150 ms were estimated,5
which is significantly higher than stopped-flow technique. On the contrary, the drive mechanism in MSFIA is an electric motor that propels a bar pushing syringes, and when the stopped-flow mode is used, dead times lower than FIA but higher than the stopped-flow technique can be expected. The system can be purchased at a moderate cost. The relevant features of a MSFIA system to follow rapid reactions are the mixing chamber and the value of dead times that can be obtained with the drive mechanism. Both features will rule the application field.
The present work explores the possibilities of MSFIA as a technique for zone stopping measurements aiming at reaction kinetic studies. The very well-known bromide-bromate reaction in acidic medium is used as chemical system, the mixing conditions are studied, the rate law is confirmed in different conditions and the rate constant is calculated and compared with the values given in literature in order to validate the use of the methodology. Also the use of MSFIA for handling dangerous reagents, through in situ
generation of unstable species, is assessed by means of the monitoring of the rapid bromination of salicylic acid (SA) after bromine generation in the MSFIA system.
Experimental
Reagents and equipments
All chemicals were of analytical reagent grade and doubly distilled water was used throughout. For bromine generation studies, a standard sulfuric acid solution (1 mol L-1 approximately) was prepared and standardized
with NaOH previously standardized with potassium hydrogen phthalate. Solutions of 2.7 mol L-1 sulfuric acid and
SA in 2.7 mol L-1 sulfuric acid were also used for studies of
the bromine-SA reaction. Working solutions were prepared by dilution with water. Stock bromate (0.200 mol L-1) and
bromide (1.00 mol L-1) solutions either in 0.222 mol L-1
sulfuric acid (bromine generation) or 2.7 mol L-1 sulfuric
acid (bromine-SA reaction) were prepared from the solids. The instrumentation (Figure 1) consisted of a Crison 4S multi-syringe (multiburette) with 5,000 motor steps and three-port solenoid valves (NResearch CSAT031, at 12 V) installed at the head of 2.5, 5.0 or 10.0 mL syringes that connected them either with the reagent solutions or with
the tubing to detector. An Ocean Optics USB 2000 CCD (charge coupled device) spectrometer furnished with a DH 2000 UV-Vis light source was used as detector. A flow-through cell with 1.0 cm path length and 1.5 mm i.d. (18 µL volume) was also used. The tubing material was Teflon®. Experimental data were acquired with the
computer coupled to both the spectrophotometer and the multiburette. The room temperature was 27 ºC.
Software
The MSFIA system in Figure 1 was controlled with a commercial application (AutoAnalysis®, SCIWARE-SL)
that ruled the multi-syringe, the solenoid valves and the stectrophotometer operation as well as the data acquisition. The solenoid valves connected the syringes either to the solution vessels (reservoirs) (OFF) or to the system (ON). The “priming” movements of syringes (see ahead) take the plungers to the end (full to pick up or empty to dispense). After any flow step, a 2 s waiting time was allowed for flow stabilization.
Least squares regression fitting (either linear or non-linear) was made with the software package TableCurve®.
Bromine generation
Initially, the system was filled with KBrO3, KBr and
H2SO4 solutions from reservoirs (Table 1, steps 1-2).
The solenoid valve in syringe A3 changed to position ON, sulfuric acid was dispensed to the system and a blank measurement was taken in the spectrophotometer (steps 4-6). Syringes got full of the solutions in reservoirs (step 7); then, in the dispense mode, bromine is formed with solutions in syringes A2 and A4; the flow was stopped and bromine generation was monitored (steps 7-14). Steps 8 and 12 gave stability and reproducibility to the measurement. The system was cleaned with sulfuric acid and all the syringes stayed full (steps 15-16). After step 16, either the bromine generation could be replicated or the solution in reservoirs could be changed for data acquisition in different conditions.
Bromine-salicylic acid reaction
The steps were similar to those related to bromine generation and the same considerations can be made, but now, the four syringes were operative (Table 2).
Procedures
Bromine generation
The manifold in Figure 1 was used, but the beaker with SA, the syringe A1 and the dotted tubing were not operative. The beaker with sulfuric acid (0.222 mol L-1) was only used
with cleaning purposes and to take a blank before every bromine generation. The concentration of bromate and
bromide in beakers in Figure 1 must double those desirable in the initial reaction mixture because of the dilution in the cross union e1 (Figure 1). The bromate-bromide mixture was pushed at a global flow rate of 2.5 mL s-1
(1.25 mL s-1per each channel); after the cross union, e
1,
the reactor was 10 cm long and 0.08 mm i.d., so the volume between the cross union and the flow cell (dead volume) was 0.0503 mL, and the dead timeresulted to be 20 ms. After, the flow was stopped and the spectrophotometer started taking absorbance (Abs) measurements every 0.5 s (integration time), so the first experimental data point was 0.520 s after mixing; afterwards, absorbance data were acquired for a 250 s period of time (about 500 data point
per run). The initial bromate concentration in the reaction mixture was varied between 1 × 10⁻⁴ and 1 × 10⁻³ mol L-1;
the initial bromide concentration was varied between 0.01 and 0.1 mol L-1; the initial sulfuric acid concentration
was varied between 2.14 × 10⁻² and 22.20 × 10⁻² mol L-1.
The ionic strength ranged between 0.14 and 0.34 along the study; this variation is not large and its influence on the rate constant will be low; consequently, the ionic strength was not adjusted. The standard conditions after mixing were: 5 × 10⁻⁴ mol L-1 BrO
3 –
, 0.1 mol L-1 Br–
, 0.222 mol L-1 H
2SO4, ionic strength 0.34 and temperature
of 27 ± 1 ºC; the theoretical concentration of Br2 generated
in those conditions was 1.5 × 10⁻³ mol L-1. For each set of
conditions, three replicates of each run were obtained and only the mean value of the rate constant was considered,
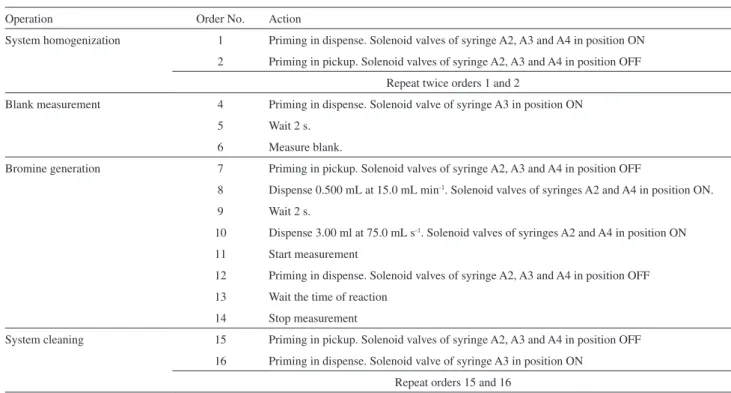
Table 1. Program configuration in Autoanalysis® for automated data acquisition of bromine reaction profiles
Operation Order No. Action
System homogenization 1 Priming in dispense. Solenoid valves of syringe A2, A3 and A4 in position ON
2 Priming in pickup. Solenoid valves of syringe A2, A3 and A4 in position OFF
Repeat twice orders 1 and 2
Blank measurement 4 Priming in dispense. Solenoid valve of syringe A3 in position ON
5 Wait 2 s.
6 Measure blank.
Bromine generation 7 Priming in pickup. Solenoid valves of syringe A2, A3 and A4 in position OFF
8 Dispense 0.500 mL at 15.0 mL min-1. Solenoid valves of syringes A2 and A4 in position ON.
9 Wait 2 s.
10 Dispense 3.00 ml at 75.0 mL s-1. Solenoid valves of syringes A2 and A4 in position ON
11 Start measurement
12 Priming in dispense. Solenoid valves of syringe A2, A3 and A4 in position OFF
13 Wait the time of reaction
14 Stop measurement
System cleaning 15 Priming in pickup. Solenoid valves of syringe A2, A3 and A4 in position OFF
16 Priming in dispense. Solenoid valve of syringe A3 in position ON
regardless the kinetic treatment applied. Bromine evolution was followed at 372 nm in which no other component of the mixture absorbs.
Bromine-salicylic acid reaction
The manifold in Figure 1 was operated including two cross unions, e1 and e2, a fourth syringe, A1, for SA and the knotted reactor, g, but the k connection was not operative. The 2.7 mol L-1 H
2SO4 syringe (A3) was only connected
to the flow cell with cleaning purposes and for base line fixing. Bromine was totally generated in the knotted reactor after the first cross union, e1, mixed in the second cross union, e2, with SA and driven to the flow cell, d. The flow in each channel (BrO3
–
, Br–
, SA) was 0.625 mL s-1,
so the flow arrived at the cell at a rate of 1.875 mL s-1.
Because the tubing length after the second cross union was 10 cm, the dead time resulted to be 26.8 ms; after that, the flow was stopped and the reaction could be followed in the CCD detector at 372 nm in which only bromine absorbs in an appreciable extent. The integration time in CCD detector was fixed at 0.3 s, so the first experimental data point was acquired at 0.327 s after mixing and, then, every 0.3 s for a 50 s period of time (about 167 data points
per run). The SA concentrations were: 5 × 10⁻⁵, 1 × 10⁻⁴,
5 × 10⁻⁴ and 1 × 10⁻³ mol L-1. Other initial conditions
were: 2 × 10⁻⁴ mol L-1 bromine, 0.3 mol L-1 bromide and
temperature of 27 º C. The ionic strength was not adjusted; it has a value around 0.3, but its effect on the reaction rate
must be very low because SA is not charged at the reaction conditions. To make sure that bromine was totally formed, a high acidity (2.7 mol L-1) was used for bromate and
bromide solutions. The concentration of these reagents in the beakers must be four fold the desired concentration in the reaction mixture since they are diluted to their half value in both e1 and e2 cross unions. The SA solution was prepared in 2.7 mol L-1 sulfuric acid and its concentration
in the syringe A1 must double the one desirable in the reaction mixture.
Results and Discussion
If MSFIA is to be used for reaction rate measurements in the zone stopping mode, a very important aspect is to know how fast the technique is able to make a homogeneous reaction mixture that can be monitored with a rapid-response instrumental method. Some considerations on the influence of system dimensioning on the mixing conditions and results obtained can be done. The burette size is not important provided it has enough channels for the desired application. More relevant is the global flow rate at which the sample reaches detector; the limit is dictated by technology and, in this case, it is 2.5 mL s-1 regardless the
number of channels used. In the case of the bromine-SA reaction, the knotted reactor length was optimized to get the complete bromine generation before the cross union e2; afterwards, the flow was stopped at a time optimized using
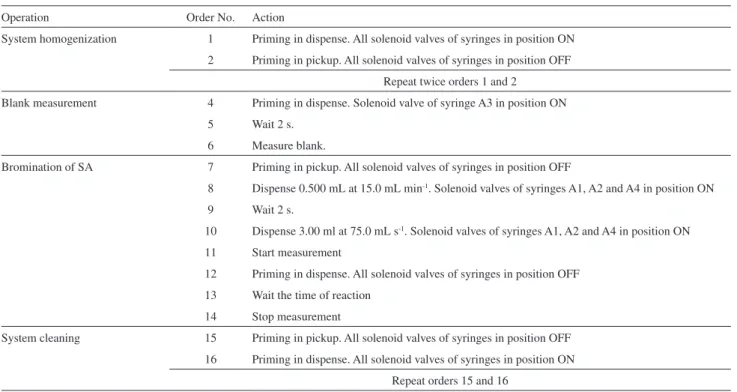
Table 2. Program configuration in Autoanalysis® for automated data acquisition of bromine-SA reaction profiles
Operation Order No. Action
System homogenization 1 Priming in dispense. All solenoid valves of syringes in position ON
2 Priming in pickup. All solenoid valves of syringes in position OFF
Repeat twice orders 1 and 2
Blank measurement 4 Priming in dispense. Solenoid valve of syringe A3 in position ON
5 Wait 2 s.
6 Measure blank.
Bromination of SA 7 Priming in pickup. All solenoid valves of syringes in position OFF
8 Dispense 0.500 mL at 15.0 mL min-1. Solenoid valves of syringes A1, A2 and A4 in position ON
9 Wait 2 s.
10 Dispense 3.00 ml at 75.0 mL s-1. Solenoid valves of syringes A1, A2 and A4 in position ON
11 Start measurement
12 Priming in dispense. All solenoid valves of syringes in position OFF
13 Wait the time of reaction
14 Stop measurement
System cleaning 15 Priming in pickup. All solenoid valves of syringes in position OFF
16 Priming in dispense. All solenoid valves of syringes in position ON
coloring solutions. The influence of temperature always depends on the activation energy of the reactions involved; in any case, some kind of temperature control should be applied if good precision is desirable.
Bromine generation
Solutions were mixed in a first cross union (e1, Figure 1) and the flow reaches the flow cell in 20 ms (see in the Procedures/Bromine generation section). Is the cross union e1 a mixing chamber efficient enough to generate homogeneous reaction mixtures in the experimental conditions? It is known that in flow injection methods the physical dispersion is the mixing force in the carrier stream; when the mixture is not homogeneous, concentration gradients can be present in the flow cell during the stop interval, causing distortion of rate data. On the other hand, no dispersion practically occurs when the flow is stopped. So, if the reaction profiles and the final absorbance value are according to expected for a homogeneous bromine solution, the conclusion must be that a complete and homogeneous reaction mixture has been obtained.
The bromine formation in acidic medium and in excess bromide has the rate law given by:8
(1)
where kobs = kBr[Br–] 0[H
+] 0
2 (2)
(the subscript 0 means initial).
Taking into account that
[BrO3–] = [BrO3–]0 – [Br2]/3 (3)
it can be easily demonstrated that
Absexp = 3eBr2l[BrO3 –]
0 (1 – e–kobst) (4)
where eBr2represents the absorptivity of bromine and l is
the path-length. The expression 3eBr2l[BrO3 –]
0 equals Abs∞ (equilibrium), which is the experimental value once the reaction has gone to completion.
That is, the value of kobs (the apparent first-order rate constant) can be experimentally calculated following [Br2] along time,9 Whenever equation 1 is obeyed,
bromine formation is pseudo-first order on the bromate concentration and first order treatment of experimental data can be applied. Also, if [Br–
]0 or [H +]
0 are varied (but
always in excess), the value of kobs allows the value of
kBr ( the “true” fourth-order rate constant) to be deduced (equation 2).
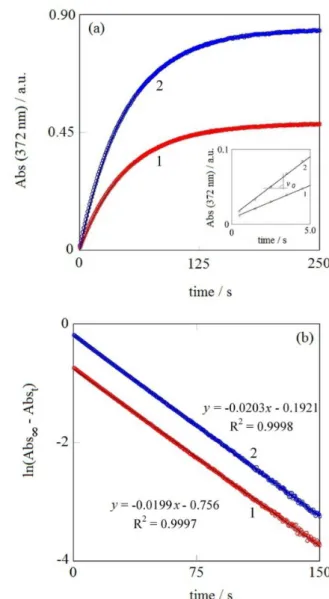
Figure 2a shows the kinetic profiles for two different initial concentrations of bromate, including the way to evaluate the initial reaction rate
v0 = kobs[BrO3–]0 (5)
and from it, the value of both kobs and kBr (equation 2, differential method).
Figure 2b shows the corresponding pseudo first order representation. The value of the absorbance obtained at equilibrium, once the reaction has gone to completion, was always the value expected for a homogeneous bromine solution. Using the values of Abs∞ (equilibrium) obtained from the kinetic runs used in this work, and considering a
Figure 2. (a) Reaction profiles for bromine generation. Initial conditions in the reaction mixture: bromate / (mol L-1): line (1) 3 × 10⁻⁴ and
line (2) 5 × 10⁻⁴, 0.1 mol L-1 bromide, 0.222 mol L-1 H
2SO4 and temperature
bromine production of 100% in each case, the experimental value of eBr2 (372 nm) (absorptivity) obtained was
509 ± 8 mol-1 L cm-1; this value is the same that the one
obtained in batch under the same chemical conditions. As a consequence, it must be concluded that the cross union in Figure 1 provides a complete and homogeneous mixture in detector.
The straight plots in Figure 2b cover more than three half-lives, proving that pseudo-first order is not disrupted, but it is followed all along the run. When experimental data in Figure 2a are fitted to the theoretical equation 4, the values of both Abs∞ and kobs for every run (integral method)
can be obtained. Table 3 collects the initial concentration values for the different runs and the rate constant values calculated (kobs) and deduced (kBr) considering both the initial rate (differential) and the whole profile (integral); the number of averaged runs, in each case, is also given.
The results in Table 3 cover a wide range of concentrations and are obtained using either the first few data points (differential approach) or the whole kinetic profile (integral approach); in any case, the value of kBr
keeps reasonably constant, except the run for 0.021 mol L-1
H2SO4 that should be considered outlier. The mean values
of kBr obtained by integral and differential methods do not differ significantly (t-test, P 0.05) from each other and the following mean value of the rate constant can be given for the whole set of data:
kBr = 3.9 (0.7) mol-3 L3 s-1 (6)
where the standard deviation is given in parenthesis.
The value of kBr in equation 6 should be considered a robust one. A review of kBr values along eighty years can be found in the literature:10 at 25 °C and ionic strength between
0.1 and 1.05, kBr ranged between 1.1 and 3.6 mol-3 L3 s-1 in
different electrolytes (mainly perchlorates). Taking into account the values of temperature (27 ºC) and ionic strength (0.14-0.34) used in the present work, the value of kBr in equation 6 is in good agreement with those precedents. This proves that MSFIA is a confident instrumentation for monitoring moderately fast chemical reactions.
Bromine-salicylic acid reaction
The use of unstable and/or dangerous reagents is an easy task when using MSFIA, because reagents can be generated in minimum amounts and immediately used; this decreases the risk of handling those solutions. As a complement to the monitoring of the bromine generation, the reaction bromine-salicylic acid has been followed. Bromine is completely generated between the cross union e1 and the cross union e2 under proper conditions (Figure 1) and mixed with SA in the cross union e2. The reaction between bromine and SA obeys the following stoichiometry:
3Br2 + SA = SA• 3Br + 3Br –
+ 3H+ (7)
The reaction mixture arrives at the flow cell 27 ms after mixing, the flow is then stopped and the experimental signal can be spectrophotometrically followed. Figure 3a shows some reaction profiles and the way in which the initial rate is evaluated. As it is usual with substitution reactions in the
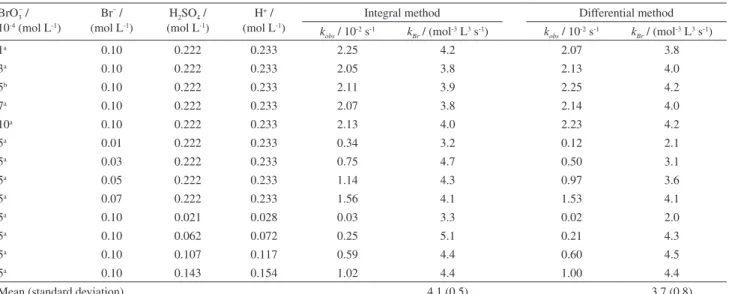
Table 3. Chemical conditions and rate constants obtained (kobs) and deduced (kBr) (see equation 4) from kinetic profiles for bromine generation, at 27 ± 1 ºC; µ (ionic strength) was not adjusted and varies between 0.13 and 0.34
BrO3– / 10-4 (mol L-1)
Br–/
(mol L-1)
H2SO4/ (mol L-1)
H+/
(mol L-1)
Integralmethod Differentialmethod
kobs/ 10-2 s-1 kBr/ (mol-3 L3 s-1) kobs/ 10-2 s-1 kBr/ (mol-3 L3 s-1)
1a 0.10 0.222 0.233 2.25 4.2 2.07 3.8
3a 0.10 0.222 0.233 2.05 3.8 2.13 4.0
5b 0.10 0.222 0.233 2.11 3.9 2.25 4.2
7a 0.10 0.222 0.233 2.07 3.8 2.14 4.0
10a 0.10 0.222 0.233 2.13 4.0 2.23 4.2
5a 0.01 0.222 0.233 0.34 3.2 0.12 2.1
5a 0.03 0.222 0.233 0.75 4.7 0.50 3.1
5a 0.05 0.222 0.233 1.14 4.3 0.97 3.6
5a 0.07 0.222 0.233 1.56 4.1 1.53 4.1
5a 0.10 0.021 0.028 0.03 3.3 0.02 2.0
5a 0.10 0.062 0.072 0.25 5.1 0.21 4.3
5a 0.10 0.107 0.117 0.59 4.4 0.60 4.5
5a 0.10 0.143 0.154 1.02 4.4 1.00 4.4
Mean (standard deviation) 4.1(0.5) 3.7(0.8)
benzene ring, the rate is initially very rapid; afterwards, it slows down, as new bromine atoms enter the ring.11 Here,
the first stages of reaction are, certainly, lost (Figure 3a) owing to the very fast initial reaction rate; however, a plot of the initial experimental rate vs. the initial SA concentration gives a straight line (Figure 3b) showing a first order dependence with respect to the SA concentration in the reaction conditions.
According to literature the following second order rate law is obeyed:
v = kBr–SA[Br2][SA] (8)
where kBr-SA depends on acidity.12 During the initial
stages of reaction (Figure 3a, inset), equation 8 can be written as:
v0 = kobs[SA]0 (9)
being kobs = kBr–SA[Br2] (10)
Equation 9 is represented in Figure 3b. For each point in Figure 3b, the value of kBr-SA can be calculated taking into account the estimated mean value of [Br2]. A mean value of
kBr-SA = 5.5 (0.8) × 103 mol-1 L s-1 (11)
is obtained from data in Figure 3 (estimate of standard deviation is given in parenthesis). This value agrees quite well with the one given in literature:12 4.7 × 10³ mol-1 L s-1,
which was obtained at 25 ºC for similar conditions of acidity (HCl was used) and ionic strength, but using the traditional stopped-flow technique.
Conclusions
The MSFIA technique with a multi-syringe burette and cross unions is easy to use in the zone stopping mode and can be applied to kinetic studies of moderately fast chemical reactions. The technology stays between the classical stopped flow instruments and FIA. This is of general application to practically all characteristics and features. Dead times depend on the driving strength of the pushing bar of multi-syringe, but values of 20 ms can be considered typical; this value stays between the classical stopped-flow instruments and FIA. The technique is completely automated and easy to implement with highly versatile manifold components that can be used for a wide range of automation techniques. Moreover, reagents in
statu nascendi can be generated in the system and used straightforward, minimizing risks of handling some dangerous chemicals. All this, together with the moderate cost of the equipment makes it interesting for kinetic studies.
Supplementary Information
Supplementary information (Figures S1-S4) contains the original profiles of bromine generation (runs in Table 3) and first order plots, including both integral and differential approaches. It is available free of charge at http://jbcs.sbq.org.br as a PDF file.
Acknowledgements
Financial support from MICINN (CTQ2008-06751-C02/BQU, and CTQ2010-15541) and from UPV/EHU (Project GIU07/58) is acknowledged.
Figure 3. (a) Reaction profiles of the bromine-SA reaction for different initial SA concentrations. Initial conditions in the reaction mixture: SA / (mol L-1): line (1) 5
×10-5, line (2) 1 × 10⁻⁴, line (3) 5 × 10⁻⁴ and line (4) 1 × 10⁻³, 2 × 10⁻⁴ mol L-1 Br
2, 2.7 mol L-1 H2SO4, 0.3 mol L-1 Br – and
References
1. Albertús, F.; Horskotte, B.; Cladera, A.; Cerdà, V.; Analyst1999,
124, 1373.
2. Ruzicka, J.; Hansen, E. H.; Anal. Chem. 2000, 72, 212A. 3. Smith, J. P.; Hinson-Smith, V.; Anal. Chem. 2002, 74, 385A. 4. Grudpan, K.; Christian, G. D.; McKelvie, I. D.; Talanta2011,
84, 1200.
5. Hungerford, J. M.; Christian, G. D.; Ruzicka, J.; Giddings, J. C.;
Anal. Chem.1985, 57, 1794.
6. Robinson, B. H. In Investigation of Rates and Mechanisms of Reactions, Part II, 4th ed., vol VI of Techniques in Chemistry;
Bernasconi, C. F., ed.; Wiley-Interscience: New York, USA, 1986, p. 10.
7. Chance, B. In Investigation of Rates and Mechanisms of
Reactions, Part II, vol VI of Techniques in Chemistry;
Bernasconi, C. F., ed.; Wiley-Interscience: New York, USA, 1974, p. 6-62.
8. Espenson, J. H.; Chemical Kinetics and Reaction Mechanisms, 2nd ed.; McGraw-Hill: New York, USA, 2002, p. 5.
9. Espenson, J. H.; Chemical Kinetics and Reaction Mechanisms; McGraw-Hill: New York, USA, 1981, chapter 2.
10. Côrtes, C. E. S.; Faria, R. B.; J. Braz. Chem. Soc. 2001, 12, 775. 11. Rao, T. S.; Mali, S. I.; J. Prakt. Chem. 1974, 316, 1047. 12. Tee, O. S.; Iyengar, N. R.; Org. Chem.1985, 50, 4468.
Submitted: May 3, 2012