The Future of Brick and Mortar And The Myth Of E-Commerce
Author: João Dias
Supervisor: Professor Rute Xavier
Dissertation submitted in partial fulfillment of requirements for the master degree in
management at Universidade Católica Portuguesa, December 2015.
THE FUTURE OF BRICK AND MORTAR AND THE MYTH OF E-COMMERCE 1
Abstract
The Future of Brick and Mortar And The Myth Of E-Commerce
João Dias
Electronic market is one of this decade’s fast growing markets, achieving the milestone of $1 trillion for the first time in the history in 2012. Contrasting with this growing scenario, there is the shopping center industry which has been heavily affected not only by the economic crisis but also to a change in consumers’ habits and mindset. Retail and shopping centers management companies are becoming worried about this trend and the future of their companies. Online shopping provides consumers with ultimate levels of convenience and variety that malls will probably never be able to compete with. Therefore, the main purpose of this dissertation is to find out if online channels are cannibalizing brick and mortar sales. In order to do so, the consumers feelings, expectations and needs to each channels were assessed. As conclusion of the research, contrarily to what is stated across web, we concluded that online channels are not cannibalizing the sales of the brick and mortar industry. They are simply satisfying different needs. Moreover, consumers use online channels as a source of inspiration so that they can later on buy in a shopping center, the product they previously searched online.
O Mercado eletrónico é, provavelmente, um dos mercados que mais cresceu na última década, atingindo em 2012, o marco de 1$ triliões pela primeira vez na história. Por outro lado, a indústria dos centros comercias tem sido fortemente afetada nos últimos anos. O forte decréscimo das vendas deve-se não só à crise económica, mas também a uma mudança de mentalidade e hábitos do consumidor. De facto, esta é uma tendência que tem vindo a preocupar as empresas de retalho e gestão de centros comerciais, uma vez que fazer compras online oferece aos consumidores níveis de conveniência e variedade com os quais nunca serão capazes de competir. Assim sendo, o objetivo desta dissertação é descobrir se os canais online estão efetivamente a canibalizar as vendas dos centros comerciais. Para isso, foram avaliados os sentimentos, necessidades e expectativas do consumidor em relação aos dois tipos de canais. Como conclusão desta pesquisa, ao contrário do que é afirmado na generalidade dos websites, concluí que os canais online não estão a canibalizar as vendas dos centros comerciais. Estão simplesmente a satisfazer necessidades diferentes. Adicionalmente, os canais online são fortemente utilizados por muitos consumidores como fonte inspiracional, para que estes possam comprar nos centros comerciais os produtos que procuraram online.
Keywords: Shopping Centers, Brick and Mortar, Online Shopping, E-Commerce, E-Markets,
THE FUTURE OF BRICK AND MORTAR AND THE MYTH OF E-COMMERCE 2
Contents
Table of Figures ... 3 Equations ... 3 Introduction ... 4 Literature Review ... 6Why do people Shop ... 6
Why do People Shop Online... 7
Difference in Generations ... 9
Research Methodologies ... 11
Research Questions ... 11
Research Tools ... 11
Factorial Analysis ... 12
Tools’ Metric Quality ... 13
Sample Characterization ... 15
Results ... 18
Descriptive Statistics ... 18
Hypothesis Testing ... 22
Full development of findings, arguments, reasoned analysis ... 30
Limitations of the dissertation ... 34
Bibliography ... 36
THE FUTURE OF BRICK AND MORTAR AND THE MYTH OF E-COMMERCE 3
Table of Figures
Figure 1 - KMO and Bartlett's Test ... 13
Figure 2 - Complete Scale Cronbach's Alpha ... 14
Figure 3 - Cronbach's Alpha 2 Dimension ... 14
Figure 4 - Gender Descriptive Statistics ... 15
Figure 5 - Generation Descriptive Statistics ... 15
Figure 6 - Education Descriptive Statistics ... 16
Figure 7 - Net Income Descriptive Statistics... 16
Figure 8 - Internet Usage Descriptive Statistics ... 17
Figure 9 - Source Descriptive Statistics ... 17
Figure 10 - Online Shopping Advantages ... 18
Figure 11 - Online Shopping Disadvantages ... 19
Figure 12 - How Frequent Does Consumer buy THose Products Online ... 19
Figure 13 - Where Do Consumer Prefere to Buy Those Products ... 20
Figure 14 - Channels' Cannibalization ... 21
Figure 15 - Hedonic and Utilitarian Descriptive Statistics ... 22
Figure 16 - Paired Differences Hypothesis Testing Between Shopping Center and Online Shopping Hedonic Value ... 22
Figure 17 - Paired Sample Test Hypothesis Testing Shopping Center and Online Shopping Utilitarian Value ... 23
Figure 18 - Hypothesis Testing Across Gender ... 24
Figure 19 - Women's Hedonic and Utilitarian Value ... 24
Figure 20 - Men's Hedonic and Utilitarian Value ... 25
Figure 21 - Hypothesis Testing Across Generation ... 26
Figure 22 - Generation Y Hedonic and Utilitarian Value ... 26
Figure 23 - Generation X Hedonic and Utilitarian Value, source: survey data ... 27
Figure 24 - Generation Older than X Hedonic and Utilitarian Value, source: survey data ... 27
Figure 25 - Hypothesis Testing Across Internet Familiarity, source: survey data ... 28
Figure 26 - Casual Users Hedonic and Utilitarian Value, source: survey data ... 29
Figure 27 - Regular Users Hedonic and Utilitarian Value, source: survey data ... 29
Figure 28 - Heavy Users Hedonic and Utilitarian Value, source: survey data ... 29
Figure 29 - Correlation Between Online Shopping Hedonic and Utilitarian Value, source: survey data ... 29
Equations
Equation 1 - Cronobach's Alpha ... 14THE FUTURE OF BRICK AND MORTAR AND THE MYTH OF E-COMMERCE 4
1. Introduction
Shopping centers are officially defined as one or more buildings forming a complex of shops representing merchandisers, with interconnected walkways enabling visitors to walk from unit to unit (Cohen, 1996). Contrarily to traditional market, they are planed, promoted and managed in a unified way. Unofficially, they are the heart and soul of communities, the foundation of retail economies, and a social sanctuary for teenagers everywhere.
When we think about shopping centers we make an immediate association to the XXI century buildings and shopping habits but, in fact, shopping centers exist since the ancient Greek and Roman eras. The first established shopping mall was built in Rome nearly 2 000 years ago by Emperor Trajan. It consisted in a semi-circular building built in the city center. It had more than 150 stores that sold a wide variety of products from luxury clothes and silks to spices and fresh food. Apart from that, the shopping center also had several restaurants and bars. All those stores were facing a corridor, allowing customers to see the products which each one was selling.
In the late 80s and 90s, of the XX century, we assisted to an exponential increase of malls. During those 20 years more than 16 000 centers were built in United States alone. By that time, there were also appearing the first factory outlet centers, which become very popular in United States throughout 90’s.
The 90’s were marked by the appearance of entertainment centers. Those were not just a place in which you could shop, they incorporated different forms of entertainment. Shopping Centers started to offer a variety of activities such as live music, cinemas, amusement parks, interactive demonstrations and food courts.
Simultaneously, over the past 20 years, the Internet boom changed the way we buy and sell goods and services.
In late 1995, Jeff Bezos boxed up the first book ever sold on Amazon.com from his garage. Within its first 30 days of business it was already the world’s largest bookstore, selling books in all the U.S. 50 states and 45 countries.
In 1996 Ebay leveled the ecommerce playing field, with only two full-time employees, eBay sold $7.2 million worth of goods. They claimed that you did not have to be an entrepreneur to sell things online. All you had to do was going to your attic, post a listing, and there was a good chance that someone would pay money for your old junk. By 2007, Ebay sold $52.5 billion in auctions, had 220 million registered users and 13,000 employees.
THE FUTURE OF BRICK AND MORTAR AND THE MYTH OF E-COMMERCE 5
Both of them revolutionized the way people can either sell or buy products. Consumers can buy pretty much anything online, from clothes to a moon space. Just type "unusual items for sale" in any search engine, and you will see what comes up.
Electronic market is one of this decade’s fast growing markets, achieving the milestone of $1 trillion for the first time in the history in 2012. Contrasting with this growing scenario, there is the shopping center industry which has been heavily affected not only by the economic crisis but also to a change in consumers’ habits and mindset. Recent forecasts show that until 2030 half the U.S. existent shopping centers to close. Retail and shopping centers management companies are becoming worried about this trend and the future of their companies. Online shopping provides consumers with ultimate levels of convenience and variety that malls will never be able to compete with. They are afraid that the electronic commerce can cannibalize their sales.
The purpose of this study is to explore the influence of different values affecting the shop intentions of consumers, both in ecommerce and in shopping centers, from utilitarian and hedonic point of view. In order to study those components, I am going to try to answer to the following research questions.
RQ1: The consumer behavior component hedonic and utilitarian are the same in shopping centers and online shopping?
RQ1.2: Is there a difference in terms of gender? RQ1.3: Is there a difference in different generations?
RQ1.4: Is there a difference in different types of Internet users?
This thesis is organized in five main chapters. In the next chapter, the literature review, we will cover all the relevant theory in order to answer the research questions. Then, in the third chapter will be presented the methodology adopted. The collected data will be analyzed in the 4th one in which main findings will be presented. Finally, on the last two sections, we are going to discuss those results, present the research limitations and recommendations for further research.
THE FUTURE OF BRICK AND MORTAR AND THE MYTH OF E-COMMERCE 6
2. Literature Review
The first chapter of this thesis is the literature review. In this chapter you will find all relevant theory for our dissertation development. We are going to start by giving you a quick overview why do people shop and cover the most important references of why they shop online. At the end of this chapter you will find more information about differences across generation.
Why do people Shop
When we ask ourselves why do people Shop, the first answer that come to our minds is because they need something that they do not yet possess (Tauber, 1972). But, in fact, the motivation behind shopping is not such a trivial straight forward topic and it has been on the spotlight of consumer behavior research for many years now.
Some of the first researchers studying this subject defined that shopping is a function of the nature of the product (Holton, 1958), the degree of perceived risk inherit to the product class (Cox & Rich, 1964) and level of knowledge about the alternatives (Bucklin, 1966). But this leaves us with the question why do they shop in where they shop stores? Some later research stated that shopping is a function of location, product assortment and store image (Bucklin, 1966) which answered quite well to the previous question. All of those theories seems to complement each other, adding some more complexity to this highly complex problem. However they do not to solve the problem by themselves. Accordingly to (Tauber, 1972), people shop not only for the sake of using the product but also due to the satisfaction obtained during the process, either obtained by personal motives, such as role playing and sensory stimulation, or obtained by social motives, such as status or pleasure of bargaining. His study did not only provided a clear definition of hedonic motivation, but also settled the ground for further discussion about utilitarian and hedonic motivations behind shopping behaviors.
Later on 1982 Hirschman and Holbrook conducted further research extending the previous theory, adding factors that relate with hedonic motivation such as emotion, enjoyment and aesthetics and compared them with utilitarian behaviors. After analyzing the results, they were one of the firsts defining both behavioral components. The utilitarian perspective assumes the buyer as a logical problem solver (Sarkar, 2011). According to (To, et al., 2007), utilitarian motivation shows that shopping starts from a mission or task and the acquired benefit depends on both efficiency and completion of the process. It is described as critical, rational, decision effective, and goal oriented. Whereas, hedonic consumption motivation designates those traits of consumer behavior that relate to the multisensory, fantasy and emotive aspects of product use (Hirschman & Holbrook, 1982). In this later case, shopping is seen as a positive
THE FUTURE OF BRICK AND MORTAR AND THE MYTH OF E-COMMERCE 7
experience in which consumer enjoys an emotionally satisfying experience, regardless of actually making the purchase or not. Consumers who have a strong hedonic component in their motivation are usually seeking an experience rather than utility gained with the product bought. Instead of shopping with a goal, they shop as goal (Babin, et al., 1994). For this reason, hedonic factors have a higher impact on unplanned shopping than the utilitarian ones. Additionally, Chandon et al. (2000) found that hedonic products are characterized for having higher premiums. However, at the same time, those are the first ones that the consumer gives up when faced with the choice pleasure or use (Dhar & Wertenbroch, 2000).
It is also important to refer that, accordingly to Babin et al. (1994), having a high value of one does not mean that they do not produce both hedonic and utilitarian outcomes. One product might produce both, depending entirely on the situation and buyer’s personality (Babin, et al., 1994). And it also does not mean that high (low) level of one does not necessarily produce a low (high) level of the other. One consumer might find one product, which motivated the shopping, trip at an expected exceptionally low price, creating both types of value. Utilitarian value is present because the product acquisition is completed easily. However the hedonic one is also present because of the bargain related hedonic responses. On other hand, one value can also inhibit the other one. For example, factors associated with increased hedonic value, such as heightened affect, may interfere with task performance, resulting in low utilitarian value (Eroglu & Harrell, 1986). Contrarily, a work mentality might distract from what would ordinarily be an enjoyable experience.
Gender and situational factors may also play an important role in the perceived shopping value. Many women perceive Christmas shopping as a painful job while men often enjoy it because they feel less pressured to buy the perfect gift (Fischer & Arnold, 1990). Even if both parties are successful in purchasing a gift, women are expected to report relatively lower levels of hedonic value in this particular situation. Whereas in regular situations is the other way round (Fischer & Arnold, 1990).
Why do People Shop Online
The retail environment is being transformed with the introduction of multichannel operations designed to offer a wider spectrum of retail experiences for consumers to choose from. These multichannel systems offer an array of shopping experiences, and in the process, deliver not only more value, but also different kinds of value (Mathwick, et al., 2001). Although the previous studies give an important theoretical background explaining why people shop, they do not address specifically the online shopping problem. Over the past 20 years, with the
THE FUTURE OF BRICK AND MORTAR AND THE MYTH OF E-COMMERCE 8
Internet boom, attention shifted to the shopping motivation through the online channel, the internet. Internet commerce is defined as the sale and purchase of products and services over the Internet. Internet commerce has the potential to offer customers a better deal compared to purchases by conventional methods (Keeney, 1999).
A number of recent studies have examined these types of motivations, most such studies have identified utilitarian motivation factors as being the main factor for shopping online. Some of these utilitarian factors include product diversity and comparison (Alba, et al., 1997) convenience, information availability (Brown, et al., 2003) and time efficiency (Morganosky & Cude, 2000). Internet has provided fertile soil for new forms of goods and services offering greater accessibility, convenience and time saving (Chu, et al., 2010). In contrast, offline shopping allows physical examination of the products, interpersonal communication and instant gratification, but involves high travel costs and search costs, and often has restrictions on shopping hours.
However as the internet developed and people got more and more used to it, different theories started appearing. Researchers adapted their previous theories to the new internet usability and interaction. They started considering that consumers may seek not only utilitarian benefits, such as ease of-use and satisfactory outcome, but also hedonic benefits, which provide enjoyment of the online experience (Bridges & Florsheim, 2008) similarly to traditional stores. Furthermore, he claims that the sensual simulation and the ability of search are the leading factors in purchase intention. Mathwick et al. (2001) explores the experimental value, and added enjoyment and aesthetics to the list. In 2002, Kim and Shim suggest that consumers who go online to shop are not only gathering information and purchasing products, they are also satisfying needs of experience and emotion, much alike as shoppers in shopping centers. Later in the same year, (Parsons, 2002) proposed a series of nonfunctional, hedonic motivational factors. After the publication of his article, it was possible to identify a change in perspective with the terms hedonic and utilitarian not only being applied to motivations, but to systems and aspects of experience (O'Brien, 2010). This author points out that no matter where customer is shopping, sensual stimulation and freedom to search are the primary shopping motivations for consumers.
However, it is important to mention that when shopping in person in a department store the customer perceives it as less risky because he can personally inspect or test the merchandise (Cox & Rich, 1964). The intangibility of the purchasing seems to play an important role in evaluation difficulty and perceived risk (Laroch, et al., 2005). This implies that certain forms of
THE FUTURE OF BRICK AND MORTAR AND THE MYTH OF E-COMMERCE 9
shopping, such as Internet, are riskier to the consumer than others (Ratnashingham, 1998). Apart from that, some consumers also consider the lack of interpersonal communication, instant gratification and shipping and handling costs as big handicaps of ecommerce (Chu, et al., 2010).
Therefore, depending on consumers’ personality, they may use the two channels differently. Some consumers may use physical stores as the primary shopping channel and the Internet as a supplementary channel, whereas others may follow the reverse pattern. Consequently, the same consumers may exhibit different behaviors when shopping across online and offline channels. (Chu, et al., 2010).
Difference in Generations
Generation theorists postulate that changes in the macro environment influence the profile of people born in a specific time period, imprinting a specific and common purchasing and consumption behavior (Howe & Strauss, 2007). This same author states that a woman with 40 years old today has less in common with 40 year old women across the ages than with the rest of her generation. Therefore, in order to understand better the consumer behavior towards online shopping and shopping centers, it seems imperative to study two different generations, Generation X and Millennials.
Generation X, also commonly known as the lost generation, comprises people born between 1961 and 1980 (Gurau, 2012). This generation is known for disliking hierarchy and faced frequent job changes (Jennings, 2000). Howe & Strauss (2007) describe this generation as savvy with media and information technology. They particularly enjoy change, forming the largest group of entrepreneurs. Apart from that, due to the well-known financial scandals, such as Enron, this generation became skeptical about trusting in companies and job security (Jennings, 2000). They value trust, good communication and challenges, both personally and professionally. Generation X purchases based on traditional search and decision making they also like customer convenience and community relations (Heaney, 2007).
Then we have the Generation Y or Millennials. This group of people born immediately after Generation X and were raised during a period of economic growth and technological progress (Bristow, et al., 2011). Born between 1981 to the early 2000s, they are the most technically literate, educated, affluent, and ethnically diverse (Bristow, et al., 2011). This generation was also defined by the appearance of Nintendo and MTV, which made them very open to chronic boredom, short attention spans, and disruptive behavior. Kumar & Lim (2008) states that the
THE FUTURE OF BRICK AND MORTAR AND THE MYTH OF E-COMMERCE 10
most interesting trait of this generation is that they are technology savvy and highly dependent on complex technology. Having grown up socializing and making purchases online, this generation’s usage of e-commerce will continue to grow along with their discretionary income. For that reason, Millennials have been identified, by Smith (2012), as a driving force behind online shopping. Furthermore, Generation Y are a heavy user of the Internet and they are receptive to the adoption of technological innovations (Bannon, et al., 2011). Also not less relevant is that they often look to peers to determine the value of a product or service. This generation considers the opinions of their peers or fellow consumers to be more credible than traditional media or company sources of information (Smith, 2012). As final remark, they are very brand and fashion conscious. They see a reputable brand as an indicator of one’s status and a way of expressing themselves (Aaker, 1997), therefore willing to pay extra for a preferred reputable brand (O'Cass & Choy, 2008). They earn money to spend rather than save (Bristow, et al., 2011).
THE FUTURE OF BRICK AND MORTAR AND THE MYTH OF E-COMMERCE 11
3. Research Methodologies
The third chapter is the research methodologies, in the beginning of this chapter you can find our research question and sample characterization. Afterwards we give you a quick overview of the methodology we used and we end this chapter by analyzing the quality of the used tools.
Research Questions
RQ1: The perceived value of Shopping Centers and Online Shopping is different in hedonic and utilitarian terms.
RQ2: The gender influences those perceived values.
RQ3: There is a difference on the perceived values when comparing across generations. RQ4: The users’ internet familiarity influences those perceived values.
Research Tools
In order to study this topic, a survey was designed as you can see inappendix 1. This survey starts with a respondents’ internet familiarity. Apart from that it has several descriptive oriented questions such as the advantages and disadvantages of online shopping, which products do consumer usually buy online, where do they prefer to buy several product categories if they are given the option of both channels and, finally, a couple of socio-demographic characterization questions.
However, its most important part is a 23 items 7 point Likert scale. This is the scale where we study both the hedonic and utilitarian components. By using several items to study those two latent variables and not asking it explicitly we are reducing the likability of respondents’ ability to influence the results. Those items were adapted from previously validated studies of Babin et al, 1994 and Sarkar, 2011.
Apart from that, and in order to avoid respondent’s bias, we put some questions in negative (item 50, 52, 54, 55, 60, 61, 63, 66, 73, 75, 77, 78, 83, 84, 86, 89). Those questions were later on reversed into positive items, so that we would be able to interpret them. The reversed questions are identified in our analysis with an “R” in the beginning of variables’ name. For instances, the reverse variable of item “VAR0050” is “RVAR0050”.
THE FUTURE OF BRICK AND MORTAR AND THE MYTH OF E-COMMERCE 12
In order to compare shopping centers and online shopping, the same scale was applied twice, firstly on online shopping, from question 49 to 72, and then on shopping center, from question 72 until 94.
Furthermore, as you can see in number 58 and 81, this survey have two validation question, “This question was designed to test your attention to this survey. Do not answer it”.
Finally, it is important to mention that as the survey’s target was the Portuguese population, it was translated to Portuguese and afterwards validated by Professor Rute Xavier and Professor Rita do Vale.
Factorial Analysis
The factorial analysis technic has its origins in the work of Spearman, 1904. It is a statistical method used to describe the variability between correlated variables in terms of latent constructs, called factors. This allows the creation and refinement of theories.
The factorial analysis can be one of two types, exploratory or confirmatory. When the researcher has no particular expectations of neither the number or nature of the factors, the exploratory approach is used. On other hand we have the confirmatory approach, when the researcher uses this method he has a priori several assumptions, expectations and theories he would like to test.
In order to prove that there were indeed two factors, hedonic and utilitarian, in our 23 items 7 points Likert scale we followed the confirmatory approach. In order to do so, we set right before starting our analysis that the number of factors we would be looking for were two. As Tauber’s research (Tauber, 1972) is the main theoretical background of this research, for developing and later on assessing scale’s validity we used the items which focus on measuring the two components of shopping center, from item 72 until item 94.
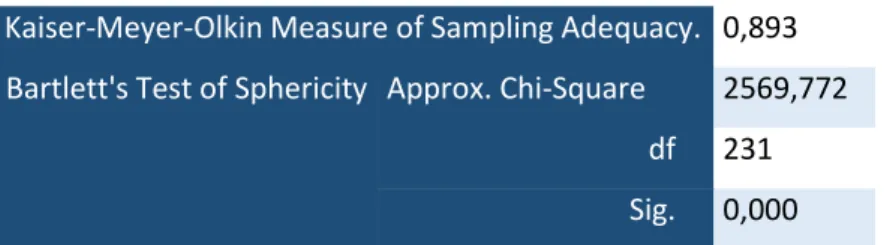
Before moving to the components extraction, we need to examine the sample adequacy and the suitability of the data to do a factorial analysis. The sample adequacy assesses how strongly items correlate between each other. The most common method used to study it is the Kaiser-Meyer-Olkin (KMO). The KMO ranges from 0 to 1 and usually above 0,5 is considered enough to perform a factorial analysis.
Apart from KMO it is also important to assess the data suitability by calculate the chi-square. In order to do so, we need to perform a Bartlett’s test of Sphericity and for the data to be suitable it needs to be significant.
THE FUTURE OF BRICK AND MORTAR AND THE MYTH OF E-COMMERCE 13
By analysis the figure 1, we realize that we got a pretty good KMO, 0,893, at a significance level of 0,000, allowing us to proceed with our methodology.
Kaiser-Meyer-Olkin Measure of Sampling Adequacy. 0,893
Bartlett's Test of Sphericity Approx. Chi-Square 2569,772
df 231
Sig. 0,000
Figure 1 - KMO and Bartlett's Test, source: survey data
After analyzing the sample adequacy and suitability, we start with the factorial analysis itself. In order to choose which items we should retain we started by analyzing the anti-image correlation table, appendix 2. From this analysis it is important to mention that all items were retained. Despite variable RV0084 (“When I shop in a shopping center I rarely compare different products”) presenting a value lower than what is advisable to retain an item, we kept it once it is very close to it and if we deleted it, we would lose relevant information. Apart from that, removing this variable did not increase significantly our KMO.
After analyzing which items to retain and in order to check to which factor each variable would relate better, the orthogonal rotation varimax algorithm was used. By using this algorithm was possible to clearly identify two distinct factor, appendix 3. The total variance explained by those two factors is 39,70%. Being the Factor 1 (hedonic) explaining 28,80% and the second Factor 2 (utilitarian) explaining 10,9%.
Tools’ Metric Quality
Before starting any analysis, it is mandatory to assess the survey’s reliability. We say that a latent variable is reliable if it is consistent. The internal consistency of a variable describes to what extent all items within the scale are measuring the same concept or construct. In order to test it, we computed the Cronbach’s alpha. The Cronbach’s alpha, developed by Lee Cronbach in 1951 and defined by the formula bellow, is the most popular method to test the internal consistency and It is expressed as a number from 0 to 1.
THE FUTURE OF BRICK AND MORTAR AND THE MYTH OF E-COMMERCE 14
Equation 1 - Cronobach's Alpha
- Components or items;
- Variance of the observed total test scores;
- Variance of component I for the current sample os observations. .
We started our analysis by calculating the entire scale’s Cronbach’s alpha, Table 2. The value found is a good indicator that our scales is reliable.
Complete scale 0,72
Figure 2 - Complete Scale Cronbach's Alpha, source: survey data
After analyzing it as an all it is important to test the internal consistency of the factors identified by the factorial analysis. As you can see by Table 3, the factor hedonic similarly to the previous analysis, presents a good consistency. On contrary, the utilitarian value has a lower value than what is generally considered desired. However, as it is a social study, due to questions’ subjectivity, sometimes it is difficult to get a high alpha. We could easily increase utilitarian’s value alpha by simply deleting items which have low correlation with each other but it would decrease the relevance of our study. For that reason, without deleting any item and despite of being slightly lower than 0,5, we consider it has an acceptable consistency.
Hedonic Utilitarian
Global 0,73 0,44
Figure 3 - Cronbach's Alpha 2 Dimension, source: survey data
As conclusion, we considered that the scale is reliable and, therefore, we can proceed with answers analysis and hypothesis testing.
THE FUTURE OF BRICK AND MORTAR AND THE MYTH OF E-COMMERCE 15 Sample Characterization
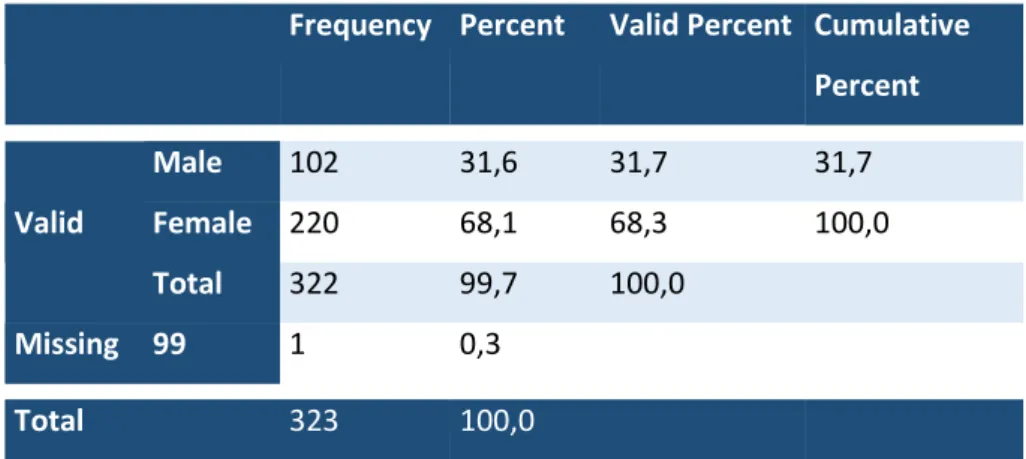
In order to study this problem, a convenience sample of 377 self-filled survey was collected. From those surveys, 54 observations were removed due to not complying with validation requirements, further explained in the research tools’ section. From the reaming 323 observation 31,7% were male and 68,3% were female (figure 4) with age between 18 and 73 years old, as you can see by the frequency table in appendix 4.
Frequency Percent Valid Percent Cumulative Percent Valid Male 102 31,6 31,7 31,7 Female 220 68,1 68,3 100,0 Total 322 99,7 100,0 Missing 99 1 0,3 Total 323 100,0
Figure 4 - Gender Descriptive Statistics, source: survey data
When we stratify them by generation, as in Table 5, we see that 43,3% belong to generation Y, 40,2% to generation x and 16,4% to generation Baby boomers.
Frequency Percent Valid Percent Cumulative Percent Valid Gen y 140 43,3 43,3 43,3 Gen x 130 40,2 40,2 83,6 Genbb 53 16,4 16,4 100,0 Total 323 100,0 100,0
Figure 5 - Generation Descriptive Statistics, source: survey data
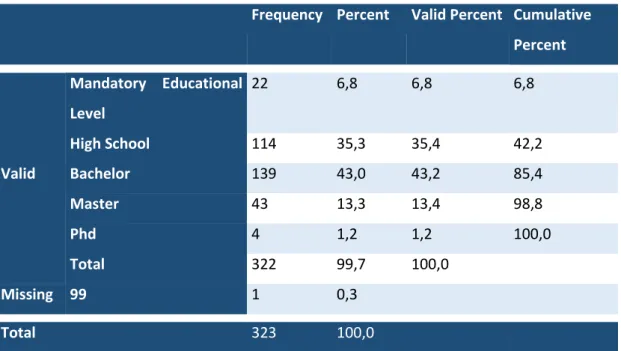
Regarding their education level, 6,8% only had the mandatory educational level, being the most of the observations locates in either high school or bachelor with a percentage of 35,3% and 43,0% accordingly. Only 13,3% had a master degree and 1,2% a Phd.
THE FUTURE OF BRICK AND MORTAR AND THE MYTH OF E-COMMERCE 16
Frequency Percent Valid Percent Cumulative Percent Valid Mandatory Educational Level 22 6,8 6,8 6,8 High School 114 35,3 35,4 42,2 Bachelor 139 43,0 43,2 85,4 Master 43 13,3 13,4 98,8 Phd 4 1,2 1,2 100,0 Total 322 99,7 100,0 Missing 99 1 0,3 Total 323 100,0
Figure 6 - Education Descriptive Statistics, source: survey data
Talking about of the distribution of the purchasing power, 28,4% receive less than 500€. 36,5% recive from 500€ to 100€, 21,7€ receive from 1000€ to 1500€, only 8% receive fro 1500€ to 2000€ and 0,9% receive more than 2500€. In this point it is relevant to mention that some of the people surveyed were already studying and not working. Therefore, the money their parents give them was considered as net income, once it is the available monthly money they have to spend.
Frequency Percent Valid Percent Cumulative Percent Valid < 500 89 27,6 28,4 28,4 500 - 1000 118 36,5 37,7 66,1 1000 - 1500 70 21,7 22,4 88,5 1500 - 2000 26 8,0 8,3 96,8 2000 - 2500 7 2,2 2,2 99,0 > 2500 3 0,9 1,0 100,0 Total 313 96,9 100,0 Missing 99 10 3,1 Total 323 100,0
THE FUTURE OF BRICK AND MORTAR AND THE MYTH OF E-COMMERCE 17
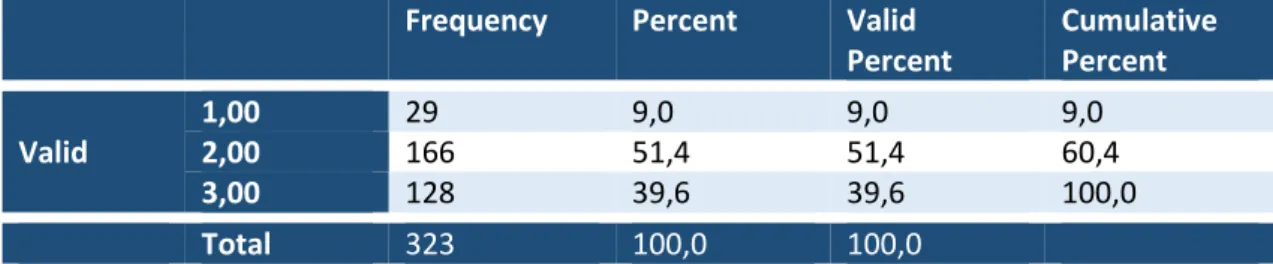
Another important variable about the sample’s characterization is the one which classify each individual accordingly with theirs internet familiarity. To do so, we used the answers obtained from question 1 to 7 and then computed a new variable named “internet_user”. This new variable allow us to classify individuals in one of three categories: casual, regular or heavy users.
Frequency Percent Valid
Percent Cumulative Percent Valid 1,00 29 9,0 9,0 9,0 2,00 166 51,4 51,4 60,4 3,00 128 39,6 39,6 100,0 Total 323 100,0 100,0
Figure 8 - Internet Usage Descriptive Statistics, source: survey data
As you can see by the previous table, in our sample we have 9% casual users, 51,4% regular users and 39,6 heavy users.
Finally is important to mention that, as you can see by the Table 9, 87,6% were collected in person and the remaing 12,4% were online collected. The places where the survey were collected, were randomly choose and comprise terraces, cafes, restaurants and city centers.
Frequency Percent Cumulative Percent
Valid Physical 283 87,6 87,6
Online 40 12,4 100,0
Total 323 100,0
THE FUTURE OF BRICK AND MORTAR AND THE MYTH OF E-COMMERCE 18
4. Results
Following the research methodologies chapter, it comes the results presentation. This chapter is divided in two subtopics. We start by stating and analyzing several descriptive oriented question and then we test the hypothesis which allow us to answer our research question.
Descriptive Statistics
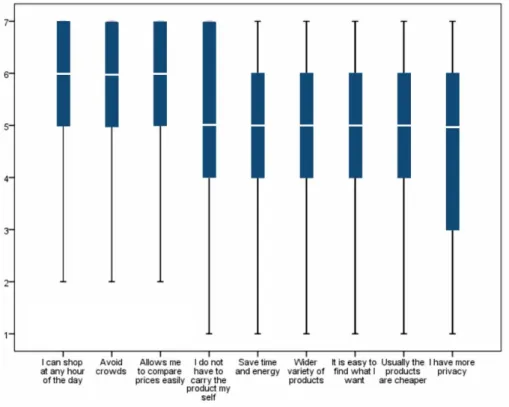
After the user’s internet familiarity questions, we have a couple of descriptive statistics related with online shopping. The first one as you can see in the Figure 10, is about the advantages of online shopping.
Figure 10 - Online Shopping Advantages, source: survey data
From the nine advantages presented by us, respondentes pointed out shop at any hour of the day, avoid crowds and easly price comparison as the main advantages offered by online shopping.
THE FUTURE OF BRICK AND MORTAR AND THE MYTH OF E-COMMERCE 19
Figure 11 - Online Shopping Disadvantages, source: survey data
Now analyzing the disadvantages, respondents identified the inability to touch or try the products as the main disadvantage of online shopping. Followed by the difficulty of returning products and not feeling comfortable sharing personal details. The least was the felling of isolations. From our survey people does not seem to care that much if they are alone or not while shopping online.
THE FUTURE OF BRICK AND MORTAR AND THE MYTH OF E-COMMERCE 20
On the figure 13 we have a bar plot describing which products people usually buy online. We can see that right on top are clothes, books and magazines, cinema tickets, shoes. The least products bought online are jewelry, music instruments, furniture, decoration, toys and electronic appliances.
Figure 13 - Where Do Consumer Prefere to Buy Those Products, source: survey data
An interesting thing that came up in survey’s answer was that, regarding the same list of products, if they are given the option to buy them in a shopping center, generally speaking, they prefer to do it rather than going online. The figure 14 describes exactly what we were explaining above. Being 1 preferring to buy in a shopping center and 0 prefer to buy it online, we notice that all products have a value above 0,7 and most of them are very close to 1. The ones with lower values are software, toys, movies and series and sport products.
THE FUTURE OF BRICK AND MORTAR AND THE MYTH OF E-COMMERCE 21
Figure 14 - Channels' Cannibalization, source: survey data
Now that internet is gaining more and more leadership, it started appearing some articles on web defending that people now go to shopping center so that they can feel and try the products and after choosing what they would like to buy, they go online in order to obtain the best bargain for the product. In fact, what we found out was the other way round, as you can see in figure 14. If we analyze the question “I often go to a shopping center buy products that I see beforehand online”, it has a mean of 4,40 and a standard deviation of 1,94. On other hand, the opposite question, “I often buy a product online which I see beforehand in a shopping center” has a mean of 3,25 and a standard deviation of 1,90.
THE FUTURE OF BRICK AND MORTAR AND THE MYTH OF E-COMMERCE 22 Hypothesis Testing
The first question we intent to answer, as previously stated, is if there is difference in the perceived hedonic and utilitarian value both on online shopping and shopping center. This research question can be decomposed by two distinct questions.
RQ1.1: The perceived hedonic value is equal on both shopping centers and online shopping.
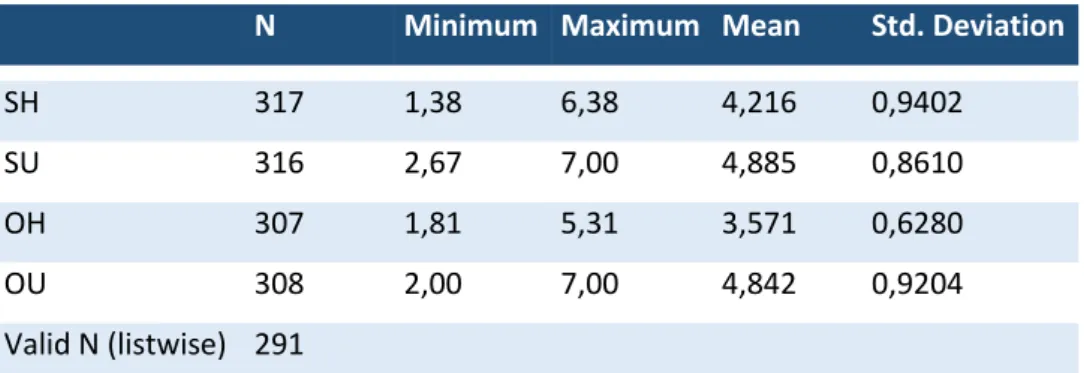
We start our analysis by simply comparing the descriptive statistics of the factors obtained through the factorial analysis in the research methodology chapter, Table 10. As it can be seen, the hedonic value perceived in shopping centers (SH) has a mean of approximately 4,22 and a standard deviation of 0,94. On contrary, the hedonic value associated with online shopping (OH) has a mean of 3,57 and a standard deviation of 0,63.
N Minimum Maximum Mean Std. Deviation
SH 317 1,38 6,38 4,216 0,9402
SU 316 2,67 7,00 4,885 0,8610
OH 307 1,81 5,31 3,571 0,6280
OU 308 2,00 7,00 4,842 0,9204
Valid N (listwise) 291
Figure 15 - Hedonic and Utilitarian Descriptive Statistics, source: survey data
However, more than simply comparing the averages and in order to have any relevance, it is important to test the hypothesis. As we wanted to compare two variables’ means for a single group, we used the Paired-Samples T test, Table 11.
Figure 16 - Paired Differences Hypothesis Testing Between Shopping Center and Online Shopping Hedonic Value, source: survey data
As can be seen by the previous table, we got a t-value of 11,100 and a significance level of 0,00. Therefore, we reject the null hypothesis which states that the mean of Hedonic value of
THE FUTURE OF BRICK AND MORTAR AND THE MYTH OF E-COMMERCE 23
shopping centers and online shopping is the same. By rejecting the null, we are implying that that there is indeed a statistically significant difference between both of them.
RQ1.2: The perceived utilitarian value is equal on both shopping centers and online shopping.
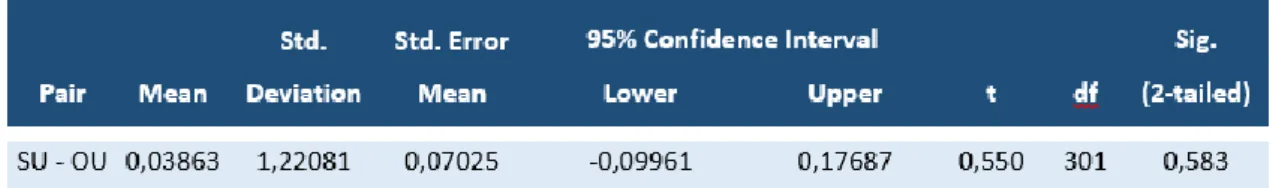
After analyzing the hedonic, and in order to fully answer to the first research question we need to assess also if the perceived utilitarian value is different on the two sales channels or not. As once again we wanted to compare the mean of two variables for a single group, we use the same methodology described above.
Figure 17 - Paired Sample Test Hypothesis Testing Shopping Center and Online Shopping Utilitarian Value, source: survey data
By analyzing the previous table we can see that we got completely different results from the previous one. This time our t-value is 0,550 and it has a significance of 0,583. For that reason we state that there is no statistically significant difference between the utilitarian values of the tested means.
As conclusion to this first, and more general, research question we found out that in utilitarian terms we can consider both channels, shopping centers and online shopping, are similar. However, when we talk about the hedonic value it is a different story. In the latter case there is indeed a statistically difference in the means of the two channels. Moreover, analyzing the descriptive statistics, we concluded that, in general, shopping centers have a stronger hedonic component than online shopping.
THE FUTURE OF BRICK AND MORTAR AND THE MYTH OF E-COMMERCE 24
RQ2: The gender influences those perceived values.
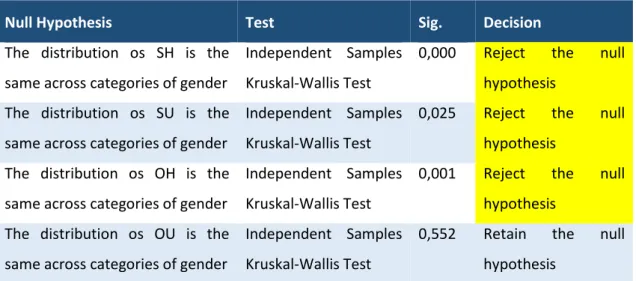
Having answer to the first research question, it is now time to move to our second one. In this question we would like to find out if gender has any influence on the perceived values. In order to do so, we computed the Kruskal-Wallis Test, Table 13. Kruskal-Wallis Test is a nonparametric test which compares two or more unmatched groups. The p-value calculated by this test allow us to awnser if the difference between population distribution is due to random sampling or not. If we got a low p-value we reject the null hypothesis, rejecting the previous idea and, therefore, conclude that the variables have different distributions indeed.
Null Hypothesis Test Sig. Decision
The distribution os SH is the same across categories of gender
Independent Samples Kruskal-Wallis Test
0,000 Reject the null hypothesis
The distribution os SU is the same across categories of gender
Independent Samples Kruskal-Wallis Test
0,025 Reject the null hypothesis
The distribution os OH is the same across categories of gender
Independent Samples Kruskal-Wallis Test
0,001 Reject the null hypothesis
The distribution os OU is the same across categories of gender
Independent Samples Kruskal-Wallis Test
0,552 Retain the null hypothesis
Figure 18 - Hypothesis Testing Across Gender, source: survey data
As can be seen we tested four distinct hypotheses at once. We started by testing the similarity of the distribution of shopping centers’ hedonic value between male and female observations. As result the null hypothesis was rejected for a significance level of 0,00. Therefore, man and women appear to have different perceived values.
OU SH SU OH
N Valid 209 214 215 206
Missing 11 6 5 14
Mean 4,823 4,389 4,951 3,653
Std. Deviation 0,901 0,879 0,880 0,625
THE FUTURE OF BRICK AND MORTAR AND THE MYTH OF E-COMMERCE 25 OU SH SU OH N Valid 98 102 100 100 Missing 4 0 2 2 Mean 4,886 3,846 4,728 3,409 Std. Deviation 0,968 0,963 0,796 0,604
Figure 20 - Men's Hedonic and Utilitarian Value, source: survey data
If we analyse the mean of both gender we can see that women score 4,39 while men only have a mean of 3,85. This implies that generally speaking, women connect shopping center more with hedonic value than men.
Secondly, we tested the utilitarian value of shopping centers. Once again the null hypothesis was rejected for a significance level of 0,025. Therefore, men and women have different utilitarian perception of shopping centers. Women’s shopping center utilitarian score is 4,88 while men’s score is 4,23. As we saw by the two previous tested hypothesis, in what concerns shopping centers, women always score higher regardless if it is hedonic or utilitarian value we are talking about. Meaning that they enjoy more shopping centers than men.
Our third hypothesis, the distribution of online shopping’s hedonic value is the same between male and female, was also rejected for a significance level of 0,001. Once again women present a higher value, 3,65, than men, 3,41. This implies that women seem to get more pleasure while shopping regardeless if it is done on shopping centers or in online stores.
Finally and interestingly enough, our last null hypothesis was not rejected, implying that the utilitarian value of online shopping between male and female does not present relevant statistically difference.
THE FUTURE OF BRICK AND MORTAR AND THE MYTH OF E-COMMERCE 26
RQ3: There is a difference on the perceived values when comparing across generations.
Our third research question is if there is any significant difference of the perceived value between generations. Before moving to the hypothesis testing itself, it is mandatory to stratify the variable age, “VAR00120”. In order to do so we created a new variable “Agr_Stratified” which classify each individual accordingly with their age in one of three distinct groups, Millenials, Generation X and Babby Boomers.
Null Hypothesis Test Sig. Decision
The distribution os SH is the same across categories of generation
Independent Samples Kruskal-Wallis Test
0,627 Retain the null hypothesis
The distribution os SU is the same across categories of generation
Independent Samples Kruskal-Wallis Test
0,873 Retain the null hypothesis
The distribution os OH is the same across categories of generation
Independent Samples Kruskal-Wallis Test
0,989 Retain the null hypothesis
The distribution os OU is the same across categories of generation
Independent Samples Kruskal-Wallis Test
0,000 Reject the null hypothesis
Figure 21 - Hypothesis Testing Across Generation
Similary to the last question and for the same reasons, as you can see in the previous tables, we also perfomed the Kruskal-Wallis test. This time the result was completely different. From all the null hypothesis stated we only reject the forth, which states that the distribution of the online shopping between generations is the same, for a significance level of 0,00. This means that the only difference we found when analysisng the different generations is in the utilitarian precieved value in online shopping.
OU SH SU OH
N Valid 137 139 140 137
Missing 3 1 0 3
Mean 5,102 4,155 4,871 3,579
Std. Deviation 0,831 0,960 0,845 0,556
THE FUTURE OF BRICK AND MORTAR AND THE MYTH OF E-COMMERCE 27 OU SH SU OH N Valid 125 126 127 122 Missing 5 4 3 8 Mean 4,724 4,238 4,871 3,582 Std. Deviation 0,961 0,910 0,913 0,665
Figure 23 - Generation X Hedonic and Utilitarian Value, source: survey data
OU SH SU OH
N Valid 46 52 49 48
Missing 7 1 4 5
Mean 4,388 4,326 4,960 3,518
Std. Deviation 0,830 0,966 0,776 0,727
Figure 24 - Generation Older than X Hedonic and Utilitarian Value, source: survey data
When we analyze the descriptive statistics we find out that generation y score 5,10, generation x score 4,72 and generation baby boomers score 4,38. This implies that the younger people are the ones who more perceived online shopping as utilitarian.
THE FUTURE OF BRICK AND MORTAR AND THE MYTH OF E-COMMERCE 28
RQ4: There is a difference on the perceived values when comparing across users’ internet
familiarity.
As stated above, our last hypothesis is to test if there is statistical difference in the perceived values across users’ internet familiarity.
Firstly, we started by creating a new variable, named “internet_user”, computed from the questions in our survey, appendix 1, which were measuring the user’s internet familiarity, from question 1 until question 7. With this new variable we were able to classify individuals in one of three categories: casual, regular or heavy users.
Afterwards, and using the same method as before, we tested the hypothesis stated above, Table 20.
Null Hypothesis Test Sig. Decision
The distribution os SH is the same across categories of Internet famaliarity
Independent Samples Kruskal-Wallis Test
0,396 Retain the null hypothesis The distribution os SU is the same across
categories of Internet famaliarity
Independent Samples Kruskal-Wallis Test
0,121 Retain the null hypothesis The distribution os OH is the same across
categories of Internet famaliarity
Independent Samples Kruskal-Wallis Test
0,000 Reject the null hypothesis The distribution os OU is the same across
categories of Internet famaliarity
Independent Samples Kruskal-Wallis Test
0,000 Reject the null hypothesis
Figure 25 - Hypothesis Testing Across Internet Familiarity, source: survey data
We discovered that the users’ familiarity with internet does not have any impact on the shopping centers’ perceived values. Meaning that even if users get more and more used to internet, this will not cannibalize how they fell about shopping centers. On other hand, there is indeed statistically significant difference across the three types of users in what regards online values. If we analyze the following three tables we see that both hedonic and utilitarian online shopping values increase as users’ familiarity with it increase. However despite of the increase of both of them, online utilitarian value increase more than the hedonic one. If we compare the two extreme groups we can see that the casual users score 3,03 and 4,23 on online shopping hedonic and utilitarian value accordingly. Whereas the heavy users group score 3,76 and 5,23 on online shopping hedonic and utilitarian value accordingly. The difference between the means of one group and the other is 0,73 on the hedonic value and 1 on the utilitarian value. Implying that there is a stronger correlation between the user’s familiarity with internet
THE FUTURE OF BRICK AND MORTAR AND THE MYTH OF E-COMMERCE 29
and the online shopping’s utilitarian value. This first feeling was latterly proved by the correlation analysis, Table 21.
SH SU OH OU
N Valid 28 27 24 25
Missing 1 2 5 4
Mean 4,313 5,191 3,026 4,227
Std. Deviation 0,911 0,942 0,744 0,878
Figure 26 - Casual Users Hedonic and Utilitarian Value, source: survey data
SH SU OH OU
N Valid 162 163 158 160
Missing 4 3 8 6
Mean 4,148 4,873 3,504 4,637
Std. Deviation 0,949 0,866 0,525 0,906
Figure 27 - Regular Users Hedonic and Utilitarian Value, source: survey data
SH SU OH OU
N Valid 127 126 125 123
Missing 1 2 3 5
Mean 4,282 4,835 3,760 5,234
Std. Deviation 0,935 0,830 0,650 0,789
Figure 28 - Heavy Users Hedonic and Utilitarian Value, source: survey data
internet_user OH OU internet_user Pearson Correlation 1 0,310** 0,365** Sig. (2-tailed) 0,000 0,000 N 323 307 308
**. Correlation is significant at the 0.01 level (2-tailed).
THE FUTURE OF BRICK AND MORTAR AND THE MYTH OF E-COMMERCE 30
5.Full development of findings, arguments, reasoned analysis
The forth chapter of this dissertation is the full development of findings. This chapter is the conclusion of our research. In its beginning you can find a summary of the most relevant findings followed by one possible strategy which brick and mortar industry can follow in order to develop and sustain their competitive advantage.
The innumerous articles questioning the future of shopping centers was what lead us to conduct this research. It is an uncontestable truth that online shopping channels are gaining more and more importance, with their sales increasing exponentially year after year. Notwithstanding the question is they are cannibalizing the sales of the brick and mortar industry or is it simply satisfying different needs.
In order to assess the needs which each channel it is satisfying we opted for using the utilitarian and hedonic theory, as previously explained in the literature review section.
After defining our model, we tried to classify both online shops and shopping centers in terms of hedonic and utilitarian needs satisfied. The question that arose was if such values were identical or completely different.
By analyzing the testing of our first hypothesis, we can answer to the first question, that people perceive their experience in shopping centers and online shops differently in hedonic terms. However, in what regards utilitarian value, there is no statistically significant difference. As such we can conclude the customers actually perceives the shopping centers as a more enjoyable, funnier and self-rewarding experience than online shopping.
A valid question if people’s gender would influence what they have perceived? As seen in our hypothesis testing chapter, women have higher values on both hedonic and utilitarian values in shopping centers, confirming what is commonly sensed that, generally speaking, women enjoy more going to a shopping center than men. On the other hand, it is also important to stress that they also score higher in hedonic terms in online shopping. Implying that regardless of the channel, women have higher shopping satisfaction than men.
After analyzing the differences across gender, another problem was identified, how would generational gaps impact the way people perceive these channels? The expected result was an increase on the hedonic values as the respondents age decreased. Meaning that the younger the generation, the higher the hedonic value on online shopping and lower the hedonic value on shopping centers. However, despite our attempt to predict it, with our hypothesis testing we did not confirm such expectation. In fact, the only value which is statistically different
THE FUTURE OF BRICK AND MORTAR AND THE MYTH OF E-COMMERCE 31
across generations is the utilitarian value obtained through the online channel. By analyzing the mean across generation we realized that the younger the generation, the higher the utilitarian value.
Confronted with those results, a possible and plausible explanations would be the internet usage familiarity. Which lead us to our last research question. Does user internet familiarity influence the hedonic and utilitarian values on both shopping center and online shops? At a first sight we were expecting that online values would increase as the internet familiarity rises and simultaneously decrease both shopping center values. By analyzing our last hypothesis testing we can see that the online’s values are indeed increasing as the internet usage familiarity increases. However, in what regards shopping centers, there was no statistically significant difference.
As conclusion of our research, both channels are similar satisfying utilitarian needs, however in what regards the hedonic ones, shopping centers score higher. Apart from that, women have higher satisfaction shopping than men. In what regards generations there is only difference in the utilitarian value. And finally, both online values do indeed increase as the internet familiarity increases and the utilitarian value of online shopping becomes higher than the utilitarian value of shopping center. However, and despite the online hedonic value increasing, it still has a long way to go to reach the hedonic value of shopping center.
For all those reasons, and answering to our widest research question, we do believe that online shopping seems to simply satisfying different needs than shopping centers. Therefore, they are probably not cannibalizing brick and mortar sales. If we had to connect each channel with one single value, we would say that shopping centers are more related with the hedonic value while online shopping are more close to the utilitarian one.
Supporting even more the statement that online shopping is not indeed cannibalizing shopping centers sales is the question VAR00119. Despite what is stated by a lot of opinion articles that people shop online products that they have previously seen and tested in shopping centers, our respondents said that it is not common at all. In fact, interestingly enough, what they considered more common than this was precisely the opposite. Most of the people we surveyed claimed to use Internet as an auxiliary tool to find out more about a product, be it company information’s or reviews about products they wanted.
With all those conclusions in mind, now it is important to think what should the brick and mortar industry strategy be. In strategic terms, companies can opt for one of two big strategies. They can either compete directly with online channels by leaning, focusing on
THE FUTURE OF BRICK AND MORTAR AND THE MYTH OF E-COMMERCE 32
variety, price and information availability. their operation and become really efficient or differentiate themselves from the competition.
The two different approaches that shopping center can try are to directly compete with the online channel, satisfying the same needs and putting their effort in things such as variety, price and information availability. On the other hand, they can try to increase the gap between both channels by differencing from competition. Our recommendation is to avoid trying to compete directly with the online channel.
Firstly, and accordingly with our research, people are not seeking to satisfy the same needs on both channels.
Secondly, when shopping center were built, they were originally invented for logistical purposes. But as the time passed, new and more efficient ways of distributing products appeared. Online channels are incredibly convenient and their operations are remarkably lean. Customers can buy whatever they want, whenever they want, where they want. Furthermore, it is delivered directly to their door in a very short span of time without having to go out to buy anything. It is very difficult for brick and mortar industry to compete with all this efficiency. Plus, we found out that people go online mostly due to the fact that they are looking for a really specific product they cannot find anywhere else, such as a single replacement key for a broken keyboard, or due to cost issues. On the other hand, when they go to a shopping center they want to have fun and pleasure.
Consumers are conscious about money and realize that such is a limited resource and that you need to work hard for your monthly paycheck, therefore, they want to get the most out of it. Rather than simply buying things, people want to have a rich experience when doing such. Physical stores and malls have a few things that cannot simply be replicated online. While in a shopping center, people can see, touch and feel what they are buying, which is simply impossible online. Plus, real-world shopping experiences deliver instant gratification.
However, and despite of having already a different positioning than online shopping, they need to go further. They should reinvent themselves to become an entertainment, discovery and experimentation destination where customers can spend quality of time with their families and friends. We see shopping centers as the new community centers. Where people more than shopping, go to socialize and relax at the end of the day. Shopping center must see themselves as if they were an amusement park with shops scattered around. Shopping centers should be dream makers.
THE FUTURE OF BRICK AND MORTAR AND THE MYTH OF E-COMMERCE 33
The non-buying experience should be their main focus. Both brick and mortar companies and tenants must see sales as a consequence of becoming a great entertainment and leisure place where you can find everything from grocery, spas, gyms. Consumers will be able to satisfy their all needs in just one place. Shopping centers should become the center and heart of the community.
THE FUTURE OF BRICK AND MORTAR AND THE MYTH OF E-COMMERCE 34
6. Limitations of the dissertation
The last section of this research is the limitations of the study. This is subsequently divided in two subtopics. The limitations of the research, in which we discuss the possibility of having biased results due to survey construction and sampling. And then, further studies which would be relevant to conduct.
It is quite easy to do a survey, but is very difficult to design a good one. This is mostly due to the biggest constrain researches have, limited resources in terms of time and money. This research case was not the exception. We had very limited resources to conclude it and for that reason some shortcuts needed to be used. If we had more time and money, a more systematic approach could have been used in its construction. A proper survey must be done in three distinct phases. Firstly, a first focus group should be done, in order to develop and understand how people think about the topic. A second focus group would be essential to test if the questions were well constructed and relevant for the research. Afterwards, a pretest of the survey should be done and only after those three stages the researcher was able to conduct the survey to the entire sample.
Another also important fact in what regards the survey construction, was that the survey was adapted from previous English studies. We had to slight change some question in order to do a translation which assessed the feeling we wanted, which might have impacted the results. Apart from that, we designed the survey so that it posterior processing would be easier, by only having closed question. Despite its processing difficulty, having some open question would enrich our research, allowing us to understand better how does consumer thinks. Furthermore, the survey’s questions were about feeling, which are quite subjective concepts, leading to a higher variance of the answers. Finally, in what regards survey construction, the survey was too big, it had 123 question and people got distracted during it answer.
Another possible source of bias is the sampling. Once again, due to the resources limit, a convenience sample was used. Almost 85% of the sample is from Lisbon and Coimbra and 68,3% are female. Other, and more systematic approach, could have been used leading to results which better represent the Portuguese population. We could, for example, have stratified the Portuguese population by different geographic Portuguese regions and gender. And then collect answers accordingly with those percentages. However, it would be very costly.
THE FUTURE OF BRICK AND MORTAR AND THE MYTH OF E-COMMERCE 35
Further studies should be carried on a more global scale. It would be also interesting to construct a panel date in order to study how is the consumer behavior changing across years in what regards those two channels. Finally, it was also relevant to study the difference between shopping centers and traditional street commerce which had regained a lot of notoriety over the last years. To conclude with, research is an iterative process of learning and redesigning. Right after finishing one research we start thinking what could be improves or what else could be studied. Answering to one question leads always to a new one.
THE FUTURE OF BRICK AND MORTAR AND THE MYTH OF E-COMMERCE 36
7. Bibliography
Aaker, J. L., 1997. Dimensions of brand personality. Journal of Marketing Research, pp. 347-356.
Alba, J. et al., 1997. Interactive home shopping: consumer, retailer, and manufacture incentives to participate in electronic marketplaces. The Journal of Marketing, pp. 38-53. Babin, B. J., Darden, W. R. & Griffin, M., 1994. Work and/or fun: measuring hedonic and utilitarian shopping value. Journal of Consumer Research, pp. 644-656.
Bannon, S., Ford, K. & Meltzer, L., 2011. Understanding Millennials in the workplace. The CPA Journal, 81.11, p. 61.
Bridges, E. & Florsheim, R., 2008. Hedonic and utilitarian shopping goals: the online experience. Journal of Business Research, pp. 309-314.
Bristow, D., Amyx, D., Castleberry, S. B. & Cochran, J. J., 2011. A cross-generational comparison of motivational factors in a sales career among gen-x and gen-y college students. Journal of Personal Selling & Sales Management, 31(1), pp. 77-85.
Brown, M., Pope, N. & Voges, K., 2003. Buying or browsing? An exploration of shopping orientations and online purchase intention. European Journal of Marketing, pp. 1666-1684. Bucklin, L. P., 1966. Testing propensities to shop. The Journal of Marketing, pp. 22-27. Chandon, P., Wansink, B. & Laurent, G., 2000. A benefit congruency framework of sales promotion effectiveness. Jounal of Marketing, pp. 65-81.
Chu, J., Arce-Urriza, M., Cebollada-Calvo, J.-J. & Chintagunta, P. K., 2010. An empirical analysis of shopping behavior across online and offline channels of grocery products: the moderating effects of household and product characteristics. Journal of Interactive Marketing, pp. 251-268.
Cohen, L., 1996. From town center to shopping center: the reconfiguration of community marketplaces in postwar america.. The American Historical Review, pp. 1050-1081. Cox, D. F. & Rich, S. U., 1964. Preceived risk and consumer decision-making - The case of telephone shopping. Journal of Marketing Research, pp. 32-39.
Deleersnyder, B., Geyskens, I., Gielens, K. & Dekmpe, M. G., 2002. How cannibalistic is the internet channel. DTEW Research Report 0153, pp. 1-23.
Dhar, R. & Wertenbroch, K., 2000. Consumer choice between hedonic and utilitarian goods. Journal of Marketing Research, pp. 60-71.
Eroglu, S. & Harrell, G. D., 1986. Retail crowding: theoretical and strategic implications.. Journal of Retailing.
Fischer, E. & Arnold, S. J., 1990. More than a labor of love: gender roles and christmas gift shopping. Journal of Consumer Research, pp. 333-345.
Gurau, C., 2012. A life-stage analysis of consumer loyalty profile: comparing generation X and Millennial consumers. Journal of Consumer Marketing, pp. 103-113.