Universidade de Aveiro Departamento deElectr´onica, Telecomunica¸c˜oes e Inform´atica, 2017
Jorge Miguel
Antunes Pereira
Dashboard para Apoio `
a Decis˜
ao na An´
alise de
Tr´
afego e Ambiente de uma Cidade Inteligente
Decision Support Dashboard for Traffic and
Environment Analysis of a Smart City
“Believe you can and you’re halfway there.”
— Theodore Roosevelt
Universidade de Aveiro Departamento deElectr´onica, Telecomunica¸c˜oes e Inform´atica, 2017
Jorge Miguel
Antunes Pereira
Dashboard para Apoio `
a Decis˜
ao na An´
alise de
Tr´
afego e Ambiente de uma Cidade Inteligente
Decision Support Dashboard for Traffic and
Environment Analysis of a Smart City
Universidade de Aveiro Departamento deElectr´onica, Telecomunica¸c˜oes e Inform´atica, 2017
Jorge Miguel
Antunes Pereira
Dashboard para Apoio `
a Decis˜
ao na An´
alise de
Tr´
afego e Ambiente de uma Cidade Inteligente
Decision Support Dashboard for Traffic and
Environment Analysis of a Smart City
Disserta¸c˜ao apresentada `a Universidade de Aveiro para cumprimento dos requisitos necess´arios `a obten¸c˜ao do grau de Mestre em Engenharia In-form´atica, realizada sob a orienta¸c˜ao cient´ıfica da Professora Doutora Su-sana Sargento, Professora Associada com Agrega¸c˜ao do Departamento de Eletr´onica, Telecomunica¸c˜oes e Inform´atica da Universidade de Aveiro e co-orienta¸c˜ao cient´ıfica do Professor Doutor Jos´e Maria Fernandes, Professor Auxiliar do Departamento de Eletr´onica, Telecomunica¸c˜oes e Inform´atica da Universidade de Aveiro.
o j´uri / the jury
presidente / president Professor Doutor Paulo Miguel de Jesus Dias
Professor Auxiliar do Departamento de Eletr´onica, Telecomunica¸c˜oes e In-form´atica da Universidade de Aveiro)
vogais / examiners committee Professor Doutor Jos´e Maria Fernandes
Professor Auxiliar do Departamento de Eletr´onica, Telecomunica¸c˜oes e In-form´atica da Universidade de Aveiro
Professor Doutor Rolando da Silva Martins
Professor Auxiliar Convidado do Departamento de Ciˆencia de Computadores da Faculdade de Ciˆencias da Universidade do Porto
agradecimentos / acknowledgements
Gostaria de agradecer em primeiro lugar aos meus pais pelo apoio e in-centivo que me deram ao longo destes anos e que sem eles n˜ao chegaria a esta fase. `As minhas irm˜as por estarem presentes e enriquecerem os momentos mais positivos e `a minha av´o pela sua enorme for¸ca de vontade e incentivo transmitido. Um muito obrigado a todos.
Queria agradecer `a minha namorada, Ana Lu´ısa por todo o carinho e apoio que me tˆem dado durante o meu percurso acad´emico, e por estar ao meu lado no melhores e piores momentos.
Gostaria de agradecer aos meus amigos e colegas de faculdade F´abio Alves, Rafael Martins, Jo˜ao Verdasca, Eduardo Martins, Fernando Duarte, Jos´e Duarte, Francisco Melo, Alvaro Soveral, Lu´ıs Carvalho e Miguel Tomaz pelo apoio e companheirismo ao longo deste percurso acad´emico.
Gostava tamb´em de agradecer a todos os meus colegas do grupo de in-vestiga¸c˜ao do NAP pelo excelence espirito de equipa e pela amizade que me oferecerem. Queria agradecer particularmente aos meus colegas mais pr´oximos Bruno e Leandro que me ajudaram tanto t´ecnicamente como pessoalmente durante o desenvolvimento desta disserta¸c˜ao. Gostaria de agradecer `a Professora Susana Sargento pela sua orienta¸c˜ao e o seu apoio mostrado durante o desenvolvimento da tese de mestrado, acreditando sempre nas minhas capacidades e incentivando sempre a ir mais al´em. Ao professor Jos´e Maria Fernandes pela sua co-orienta¸c˜ao, apoio e pelas suas infind´aveis ideias, que `as vezes fora do normal mostraram-se muitas das vezes interessantes e ´uteis para este trabalho.
Resumo As cidades tˆem estado continuamente a crescer tanto em popula¸c˜ao, como em ve´ıculos, infra-estruturas e inteligˆencia. Ao implementar e usar tecnologias inteligentes na infra-estrutura das cidades, ´e poss´ıvel melhorar as diversas ´areas de uma cidade, como a mobilidade ao mel-horar a infra-estrutura das estradas, as infra-estruturas ao melmel-horar o planeamento urbano e a popula¸c˜ao ao disponibilizar melhores servi¸cos. A cidade do Porto tem neste momento uma infra-estrutura de sensores fixos e m´oveis em mais de 400 autocarros, e unidades de comunica¸c˜ao na estrada, com GPS e sensores de mobilidade nos elementos m´oveis, e com sensores ambientais nas unidades fixas. Esta infra-estrutura proporciona dados valiosos baseados nos padr˜oes de mobilidade dos autocarros. Os dados dos sensores ambientais s˜ao tamb´em disponi-bilizados e usados para analisar a qualidade do ar da cidade e a sua influˆencia perante o tr´afego de ve´ıculos.
O sistema desenvolvido fornece uma integra¸c˜ao completa da in-forma¸c˜ao num dashboard da cidade que mostra e correlaciona os dados gerados pelo movimento dos autocarros e do ambiente a partir dos sen-sores fixos, permitindo diferentes visualiza¸c˜oes do trˆansito nas estradas e do ambiente na cidade, e decis˜oes sobre o estado atual da cidade. Um bom exemplo ´e a rela¸c˜ao da varia¸c˜ao da velocidade dos autocarros com poss´ıveis anomalias na estrada ou engarrafamentos. Ao visualizar esta informa¸c˜ao com um n´ıvel de detalhe superior nas anomalias en-contradas na estrada, o gestor da cidade pode beneficiar do dashboard quando precisa de tomar decis˜oes relacionadas com o planeamento ur-bano e assim melhorar de uma maneira inteligente a mobilidade da cidade.
Abstract Cities are continuously growing in population, vehicles, infrastructures and intelligence. Using and deploying smart technologies in the cities infrastructure can improve the multiple existing areas of a city, such as mobility by improving the road network, infrastructure by improving the urban planning and population by contributing with better services. Porto city has an in-place infrastructure of fixed and moving sensors in more than 400 buses and roadside units, with both GPS and mo-bility sensors in moving elements, and with environmental sensors in fixed units. This infrastructure can provide valuable data that can ex-tract information to better understand the city and, eventually, support actions to improve the city mobility, urban planning, and environment. This work has the objective of using the information generated by the sensors placed in the buses of Porto, and using it to analyze the road traffic information based on the mobility patterns of the buses. The data from the environmental sensors deployed in Porto is also provided and used to analyze the air quality of the city and its influence by the traffic.
The developed system provides a full stack integration of the informa-tion into a city dashboard that displays and correlates the data gen-erated from the buses movement and the environment from the fixed sensors, allowing different visualizations over the road traffic and the environment in the city, and decisions over the current status of the city. A good example is the relation of bus speed variation with possi-ble anomalies on the road or traffic jams. Visualizing such information with a superior level of detail on the road traffic, more anomalies can be found, adding more value to a city manager when taking urban planning decisions to improve the city mobility in a smart way.
Contents
Contents i
List of Figures v
List of Tables vii
Acronyms ix
1 Introduction 1
1.1 Motivation . . . 1
1.2 Objectives and Contributions . . . 2
1.3 Document Structure . . . 2
2 State of the art 5 2.1 Introduction . . . 5
2.2 Porto . . . 5
2.3 Smart Cities . . . 9
2.3.1 City Big Data . . . 12
2.3.2 Mobility on decision support systems . . . 12
2.3.3 City wide dashboards . . . 13
2.4 Data Warehouse . . . 19
2.4.1 Extract, Transform and Load . . . 19
2.4.2 Star schema . . . 20
2.5 GIS - Geographic Information System . . . 21
2.6 Related Work on Mobility and Environment Analysis . . . 27
2.7 Discussion . . . 29
2.8 Summary . . . 30
3 Data analysis 31 3.1 Introduction . . . 31
3.2 Vehicle Data processing . . . 31
3.2.1 Vehicle Position and Time Instant Fetch . . . 32
3.2.2 Position to Road Snap Operations . . . 33
3.2.4 Persistence of Information . . . 38
3.3 Environment Data processing . . . 41
3.3.1 Environment Metrics Fetch . . . 41
3.3.2 Parsing and Preparation of Data . . . 42
3.3.3 Persistence of information . . . 42
3.4 Building the Traffic Profile . . . 43
3.5 Traffic and Environment Correlation . . . 44
3.6 Road Cleaning and Transformation . . . 45
3.7 Summary . . . 47
4 The System 49 4.1 Introduction . . . 49
4.2 The architecture . . . 49
4.3 Data Information Services . . . 52
4.4 The System Web based Dashboard . . . 53
4.4.1 Mapping of roads and locations . . . 53
4.4.2 Charts Representation of Vehicle and Sensors Variables . . . 54
4.4.3 Traffic Profile Comparison . . . 55
4.4.4 Representing environment information . . . 55
4.4.5 Road Definition and Transformation . . . 56
4.4.6 Road Data Management View . . . 57
4.5 Summary . . . 60
5 Implementation 61 5.1 Introduction . . . 61
5.2 Data Fetching . . . 61
5.3 Data Analysis . . . 62
5.4 Databases and Data-warehouse . . . 62
5.4.1 Structure . . . 62 5.4.2 Functions . . . 64 5.5 Data Visualization . . . 67 5.6 Summary . . . 68 6 Case Studies 71 6.1 Introduction . . . 71
6.2 Traffic in different hours of weekday . . . 71
6.3 Discovering a Critical Zone . . . 72
6.4 A special event in Porto . . . 75
6.5 How the road traffic affects the environment . . . 77
7 Conclusions and Future Work 81 7.1 Conclusions . . . 81 7.2 Future Work . . . 81
List of Figures
2.1 VANET network in a smart city. . . 6
2.2 The different layers in a smart city network [7]. . . 11
2.3 Dublin mobility dashboard [13]. . . 15
2.4 London smart city dashboard [14]. . . 16
2.5 Boston city dashboard [15]. . . 17
2.6 Moncloa city dashboard [16]. . . 18
2.7 Sydney city dashboard [18]. . . 18
2.8 A generic structure of a database star schema. . . 21
2.9 Ellipsoid and geoid comparison [35]. . . 24
2.10 Database Spatial Operations. . . 27
2.11 Traffic mining approach in TrailMarker work [42]. . . 28
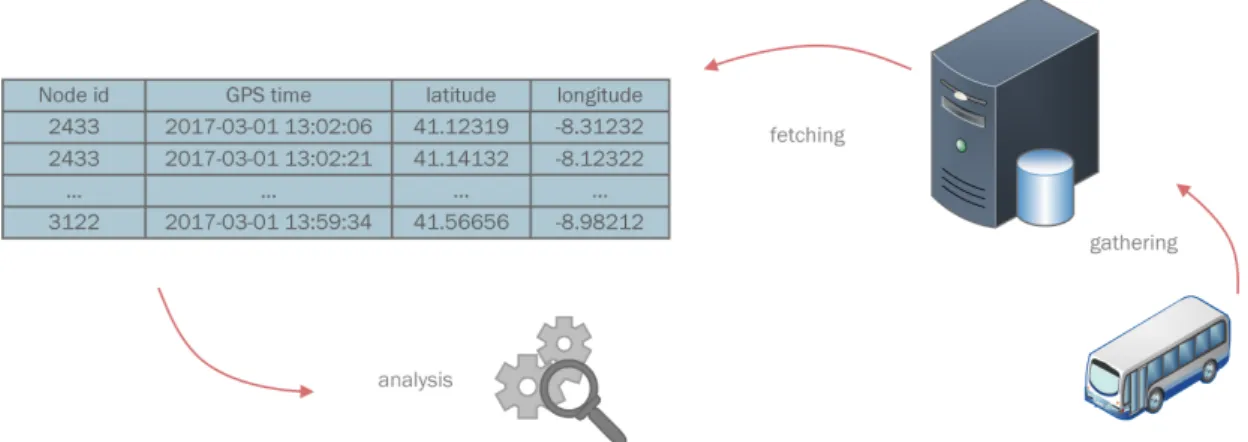
3.1 Vehicle Position gathering to a database server and fetching cycle for data analysis of position metrics. . . 32
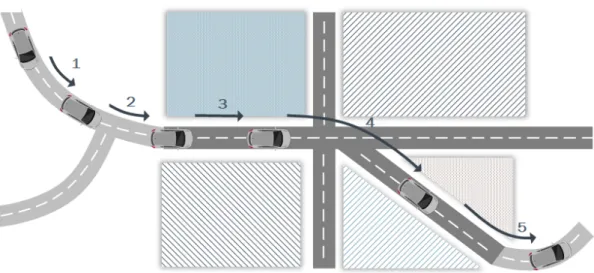
3.2 Vehicle trajectory on multiple phases on different roads. The light grey roads represent unknown roads, and the dark grey roads represent the ones available on the database. . . 34
3.3 Comparison of the vehicle position road match without a buffer versus with a implemented road buffer on the same geometry road. . . 35
3.4 The Haversine Formula [48]. . . 37
3.5 Four positions from a unique bus trajectory during its trip represented in two different roads. t = time, d1,d2 = distance, start = fist position in the road, last = last position in the road. . . 38
3.6 Representation of the process of Gathering environment information from sensors, the transmission of the metrics to the Fiware server and the request of environment information from the local server. . . 41
3.7 Distance transformation approach. Each one of these points represent a vehicle position on the road, with a known distance between them that is accumulated to know the real distance of each point on the road. . . 43
3.8 Example of the road speed profile with an aggregation of points from 3 different vehicles through the distance of the street. The metrics represented in the figure are from one point and represents the speed of 33 km/h from the vehicle 2811 at the distance 400 meters of the street, which is also the 0.5 fraction of the road, in the middle. . . 44 3.9 Approach used when choosing roads to correlate the speed information with
environment information. Here is chosen the roads that are closer to the sensor that provides the environment metrics. . . 45 3.10 Example of the Avenida Carlos Oliveira Campos street initially composed
by four different segments, being cleaned and transformed into one segment. 47 4.1 Proposed system flow architecture. . . 50 4.2 Interactions of database components and its intrinsic support. . . 51 4.3 Global road traffic. . . 54 4.4 Traffic profile view of the Rua de Costa Cabral street in the morning of the
weekdays. . . 55 4.5 Inputs Selection for Different Searches. . . 56 4.6 Traffic profile comparison of Avenida da Boavista street from different time
instants. . . 57 4.7 Visualization of multiple Environment Sensors in Porto city and the CO vs
speed correlation chart. . . 58 4.8 Dashboard interface to select and transform Road Segments. . . 58 4.9 Dashboard interface for giving instructions and getting the status of the
analysis of road information. . . 59 5.1 Data warehouse structure. . . 65 5.2 Transformation of date-time to dimension table structure of data warehouse. 66 5.3 Main visualization components from the dashboard implementation. . . 68 6.1 Rua da Constitui¸c˜ao street in Porto spatial representation and its speed
profile comparison of mid-day and end-day hours of a typical week. . . 72 6.2 The Porto street of Avenida da Boavista with a speed profile during a typical
week, in the morning, between 8 and 9 o’clock. . . 74 6.3 Speed profile of a section of the street of Avenida da Boavista in Porto
during a typical week in the morning, between 8 and 9 o’clock. . . 74 6.4 Street view of the intersection of Avenida Antunes Guimar˜aes with Avenida
da Boavista road. . . 75 6.5 Area of Red Bull Air race event in Porto with the selected Avenida da
Rep´ublica road to analyze. . . 76 6.6 Avenida da Rep´ublica road traffic profile comparison in two different time
instants, one of the events days and the other in the weekend after the event. 77 6.7 Correlation of traffic speed vs CO values through the day from the
List of Tables
2.1 Description of the vehicular information available from the bus mobility network of Porto city. . . 7 2.2 Description of the environment information available from the deployed
sen-sors in Porto city. . . 9 2.3 Comparison of features from different smart city dashboards. NO2 =
Nitro-gen dioxide; SO2 = Sulfur dioxide; PM = Particulate Matter; O3 = ozone. 14 2.4 Comparison of a list of geographic information system applications. . . 23 2.5 List of OpenStreeMap road information attributes. . . 25 3.1 Available information used for the data analysis. . . 32 3.2 Example of the allocation of values to the attributes of each point in the
Acronyms
Ajax Asynchronous JavaScript and XML. AP Access Point.
API Application Programming Interface. BT Bluetooth.
CO Carbon Monoxide.
CPU Central Processing Unit. CSS Cascading Style Sheets. CSV Comma-Separated Values. GIS Geographic Information System. GPRS General Packet Ratio Service. GPS Global Positioning System.
GSM Global System for Mobile Communications. HTML HyperText Markup Language.
HTTP Hypertext Transfer Protocol.
IEEE Institute of Electrical and Electronics Engineers. IoT Internet of Things.
JDBC Java Database Connectivity. JSON JavaScript Object Notation. LTE Long-Term Evolution.
LTS Long Term Support. OBU On-Board Unit.
ODBC Open Database Connectivity. OSM Open Street Map.
REST Representational State Transfer. RSU Road-Side Unit.
SQL Structured Query Language. VANET Vehicular Ad-hoc Network.
WAVE Wireless Access in Vehicular Environments. WGS World Geodetic System.
WIFI Wireless Local Area Networking. WLAN Wireless Local Area Network. WSN Wireless Sensor Network.
Chapter 1
Introduction
1.1
Motivation
Nowadays it is more and more demanding being connected everywhere, from an in-dividual standpoint using smart-phones or similar devices, and also from a city point of view where different infrastructures need to be connected using sensors and communication devices.
A smart city has a vision to integrate and evolve different areas such as environment and transportation in a way that it can optimize their resources, plan its preventive maintenance activities through monitoring systems and smart sensors to collect data in real time and improve the city management decision making [1].
The cities are growing every day and with that, comes an increasing on the vehicles that circulate through its streets. As the city grows, the traffic congestion increases and becomes more important to manage the road infrastructure. Optimizing road traffic is necessary but demanding, so using a different and better approach from the traditional human-centric methods to the road management of the city is ideal.
As making changes in the road infrastructure of the city is very expensive, their con-struction or modifications need to be very well studied and their outcomes need to be predictable. Using smart technologies in the city to complement a decision making sup-port system will help with a certain level of accuracy to identify problems that often cannot be detected by the human eye. The solution of building or transforming the city infras-tructure can be less expensive than what is currently available, with data and a decision support system. In theory, it is possible to perform more informed and conscientious deci-sions regarding city traffic network, namely from traffic light timing to changes in network through roundabouts or road traffic direction changes.
Adding sensors to vehicles that circulate through the city roads allows to grab useful information from the city’s mobility, that can be processed and analyzed to aid the man-agement of the city roads and the decision making when changing or implementing a road infrastructure.
to understand and improve the city management.
1.2
Objectives and Contributions
The main objective of this work is to provide an end to end solution to monitor changes on road traffic from information obtained from more than 400 buses and environment sensors available in Porto city. To reach that goal, the following objectives are taken into account:
• Extract traffic related data from buses and fixed sensors.
• Select and define the main statistics and indicators for traffic and extract them. • Relate the traffic information with environment information.
• Provide city wide dashboards for different visualizations over the traffic and environ-ment performance in the city over time, namely compare the same road in different times of day/week/month.
Given the size and specificity of the traffic related data, there are some challenges that can already be identified:
• To map the bus information into spatial map of the city, namely handling GPS jitters and map GPS positions into actual road location.
• To summarize the bus information - options like data warehouse to support a decision support system to obtain traffic estimations for the city roads based on the bus dynamics around the city.
• To transform the data into information that can be used to support decisions on the mobility of the city.
• To represent the bus traffic information in a comprehensible way, using a user friendly interface.
Following this study development, one article has been submitted, with the title ”Deci-sion Support Dashboard for Traffic and Environment Analysis of a Smart City”, to VEHITS 2018, in October 30th and it is waiting for approval.
1.3
Document Structure
This document is organized as follows:
• Chapter 2 presents the state of the art, which contains concepts of smart cities, data warehouse, spatial information and data visualization.
• Chapter 3 contains the logic and analysis of the vehicular data.
• Chapter 4 presents the overall architecture of the proposed solution, as well the developed dashboard and the integration services.
• Chapter 5 presents in more detail the processes used in the implementation of the system.
• Chapter 6 shows the results obtained from the implemented solution using some case studies.
• Chapter 7 presents the main conclusions of this work and suggestions for future work.
Chapter 2
State of the art
2.1
Introduction
In order to better understand the scope of this work and the reasoning behind several options it is essential to understand the context of Smart cities, more specifically the case of Porto. This includes understanding the information that is available and common strategies to handle the data either at a conceptual integration level and at a technical level (e.g. handling the information streams). During the extent of this chapter it will be presented and contextualized the current status of the Porto city where it is described the implemented smart vehicle network in the city and the available data sources; the general concepts of a smart city, the city layers, the transportation and big data insight with some examples of existing dashboards; the concepts of data warehouse used in this work, the processes and generic structures; the Geographic Information Systems presents the multiple geographic systems and the related concepts.
In the end of the chapter it will also be presented related work that shares similar objectives, or similar types of data sources that are based on vehicular and environment information.
2.2
Porto
The current work will focus on Porto city and it will depart from its existing IT / smart city infrastructure.
Porto is one of the cities that is implementing in its infrastructures smart solutions to improve city’s dynamic and intelligence in a wide variety of fields, from the environment to the mobility where distinct data of the city is captured using an in place base of fixed and moving sensors in more than 400 buses and road side units with environment sensors.
Vehicular Information
The smart mobility platform of the city is built around the public transport bus service, where a vehicular ad-hoc network through on-board units (OBU) are implemented in the buses to provide free WIFI access for the users of the bus transportation service. It is also deployed in the city roadside units (RSU) in multiple locations to provide a hotspot for the bus OBU to connect and exchange big amounts of information, as the example in figure 2.1.
The Porto’s vehicular network also serves as a gateway of the information generated from the environment sensors deployed in different locations. After capturing the environ-ment variables, it uses different hops from the network to reach their end destination to then be analyzed.
All these infrastructures provide continuous data from different areas: from the mobility side, the information captured from the buses can provide data from their users, status of the bus and their real time position, and network information. From the information captured from the environmental sensors, it is provided weather, pollution and environment information. All these sources of information generate a huge amount of information, since there is a high density of vehicles with more than 400 buses circulating in a wide area around the city with a continuously availability of information, generating data every 15 seconds for each bus.
Figure 2.1: VANET network in a smart city.
data to build different applications for the transportation systems namely for improvement of the services related with the public transportation, and also for the enhancement of the road infrastructure for the population that lives in the city.
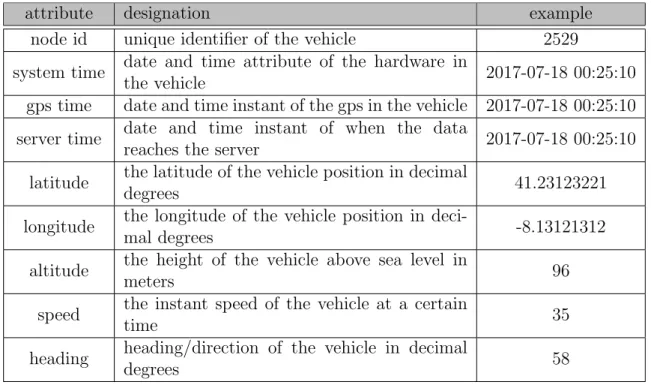
The vehicular data available from the captured variables from the buses around the city contains many important information to study. These variables are divided by the ones that provide the timestamps and others that provide the position and location of the vehicle, all during multiple captures in their trip. The following table provides detail of the existing attributes from this data-set of vehicular data.
attribute designation example
node id unique identifier of the vehicle 2529 system time date and time attribute of the hardware in
the vehicle 2017-07-18 00:25:10 gps time date and time instant of the gps in the vehicle 2017-07-18 00:25:10 server time date and time instant of when the data
reaches the server 2017-07-18 00:25:10 latitude the latitude of the vehicle position in decimal
degrees 41.23123221
longitude the longitude of the vehicle position in
deci-mal degrees -8.13121312
altitude the height of the vehicle above sea level in
meters 96
speed the instant speed of the vehicle at a certain
time 35
heading heading/direction of the vehicle in decimal
degrees 58
Table 2.1: Description of the vehicular information available from the bus mobility network of Porto city.
Although there are many variables available from the vehicular network as shown in table 2.1, not all are necessary to make the necessary statistics and analysis on the road. Here the ones that are being used are the ”node id”, the ”gps time”, the ”latitude” , the ”longitude” and ”speed”. There are several reasons to choose these 5 variables, and some of these reasons are the following:
• node id: the unique identifier of the vehicle is used to make individual statistics for each vehicle. With that addition, it will be possible to select and query a specific vehicle and make a traffic analysis for that vehicle.
• gps time: In order to get a date and time reference associated with the data, the gps time is the variable used. Although there are other time variables, the gps time is the one associated with the captured time of the gps coordinates.
• latitude: the latitude of the vehicle is one of the essential attributes, so it gives the position of the vehicle to make the base of the road statistics.
• longitude: like the latitude of the vehicle, the longitude serves to give the position of the vehicle.
• speed: the instant speed of the vehicle is a complement of data used to know the speed at a certain coordinate. It is used to add precision to the traffic analysis. These attributes provide the essential to work with geo-localization of vehicles, which is what is necessary to study the speed and traffic on the roads in different instants and events. This vehicular data is from about 400 different vehicles and has a good time granularity as it adds a new log entry every 15 seconds for each vehicle, which means that if all vehicles are active at the same time, there are 24000 logs/minute.
Environmental information
Multiple environment sensors deployed in the Porto city provide valuable data about the environment conditions in the areas that are nearby the sensors. In the captured data, it is possible to obtain information about the weather and the air or noise pollution values of the city.
The environment information is used in this work in conjunction with the vehicular data to add a new layer of information on the mobility of the city.
All the environment sensors information have a range of attributes available, but not all the environment variables are contextualized in this work, so only the used ones will be focused and are the following:
• id: this unique identifier is needed to associate the data to a specific sensor. With this information, an anomaly in the sensor can be detected and solved.
• latitude and longitude: the position of the sensors are an important metric, due to the fact that it gives environment values based on a location, so that can be related with the vehicles position.
• time: it is necessary to know when a certain environment value occurs.
• temperature: this variable is useful to provide the temperature values throughout the day.
• noise: the noise levels allow us to study how the road traffic affects the noise pollution in the city.
• co: the carbon monoxide is important to measure the air quality in the city and how the traffic affects it.
attribute designation example id unique identifier of the sensor 213 latitude the latitude of the position of the sensor in
decimal degrees 41.2312
longitude the longitude of the position of the sensor in
decimal degrees -8.3232
time the instant date and time when the data was
captured 2017-07-18 00:25:10
temperature the captured temperature represented in
de-grees Celsius 25
noise the noise levels at a certain moment in
deci-bels 71
co the carbon monoxide value at a given time in
volts 2.12
Table 2.2: Description of the environment information available from the deployed sensors in Porto city.
2.3
Smart Cities
Smart cities is a recent adopted concept in the 21st century to the development of information systems in the cities, although the definition of smart cities may be varied for different persons, Hollands describes different meanings to best define it in [2]. One that he expresses is that smart cities are the application of electronic and digital applications in cities; the use of information technology to transform the way of living in a region; the variety of embedded Information and Communication Technologies deployed in the city; the spatial territories that bring information and communications technologies and people to improve innovation, learning and knowledge to the city. It is a way to integrate urban infrastructures and services in large cities in different areas such as buildings, transporta-tion, electrical and water distributransporta-tion, and public safety, contributing for the planning, development, and operation of the cities [3].
As the global population continues to grow and the population that lives in the cities increases, new ways are needed to follow this growing demand that comes with the increase of vehicles and the overload of public services, in a way to continuously provide quality of life of the general population that lives in the cities. It is here where the use of smart cities term has emerged as a urban based technological innovation to add a new perception of the variables of the city, integrating sensors and infrastructures with intelligent networks, simply making it smart, digital and innovative. This will enable to introduce new challenges and transformations on the management and behaviour of the city people, mobility and infrastructure.
popula-tion, the transportapopula-tion, the information and the energy. These layers will be detailed in the following text.
Population
The citizens are the ones that can make the city smarter because the they are the main actors in the daily movement of the city. A smart city should also focus on the higher education of the individuals, so more skilled workers will be available. The more knowledge, the more value and creativity people can bring to the city and be more attractive for smart people impulsing the urban development [4].
The urbanization or growth of population in the cities also comes with positive aspects as the workforce will increase, the taxation base will expand, and the consumption on the local business. On the downside, this also adds some challenges: the pressure on the public services and resources to continue with the population growth rate, the way to control bigger crowds, the scaling of public transportation and management of waste. This could be an opportunity for integrating IoT devices for better management of services and resources of the city to help make the cities and populations smarter [5].
The implementation of smart technologies will benefit the population in different areas: in education it will improve quality and access, in health care it will lead to faster and accurate diagnosis, in transportation by offering a faster and convenient way to move using public transports and in public safety to respond to emergencies and threats in real-time [6].
Transportation
One of the main service presented in the smart cities is the transportation service, where the optimization on the use of buses, metro, trains, garbage collectors and emer-gency services can be examples of what a smart city can provide. Focusing on the bus transportation system, this is a service that has a connection or interactions with the mul-tiple layers of a city, from the people that uses it, to the necessary fuel resources to move the vehicles, the bus stops and road infrastructure to move on.
The bus transportation service can be used in a smart way to better understand the mobility of the city. Because buses are one of the few types of vehicles that move in a wide area of the city every day, they are also the ones that can give us precious information of the traffic in different locations and different times. By adding sensors in the buses, we can analyze their mobility and use this information to detect traffic or accidents in the city, improve the road network infrastructure in the city, making the transportation service moving faster and providing new types of information to the people.
One of the challenges of the bus transportation is to improve its mobility in the city, moving faster and efficiently and arrive on time at the bus stops. All these challenges have an impact on the way that city moves, because there will be less traffic, people will move faster and arrive on time at their works and the population will be more satisfied and will
Figure 2.2: The different layers in a smart city network [7].
use more the service. This will also have an impact on the environment, as less fuel will be used and CO2 emissions will decrease.
Information
Information is the base for the city innovation and decision support when improving the overall management, services and dynamics in the city. In a smart city this information can be obtained from different sources, the city elements, the assembled infrastructure of sensors in different areas of the city and the information from the citizens digital footprint and social media [8]. All this daily activity information from assets like buses, building, environment can be collected and interpreted to be used as key performance indicators to report incidents, sending event alerts, measuring city changes over time and real-time monitoring for anomalies detection.
Energy
Another challenge of an expanding city is to supply utilities that meet growing demands. Using a smart infrastructure for energy and water will improve its efficiency to produce as much energy required while reducing waste and consequently costs. It is important to
have a good management in resources as they are limited, so using sensors to supervise and manage the production and distribution of resources will help to prevent losses. Also giving people smart energy monitors can reduce the city consumption [6].
Although all these layers may seem to be independent, most of them have connections and dependencies between them. As an example, the people uses services like electricity, or water that came from the energy resources, uses public transportation to move around the city, and uses information from smart devices.
2.3.1
City Big Data
One sentence that better describes the advantages of big data in a city is the following: ”Data-driven decisions are better decisions—it’s as simple as that. Using big data enables managers to decide on the basis of evidence rather than intuition. For that reason it has the potential to revolutionize management” [9].
Data is what characterizes a smart city, from the data where problems can be detected and analyzed but also can help to perform more intelligent / cost effective decisions at a city level, by combining more efficiently the available information and support decision system. The cities have been producing data from census, surveys or city audits to analyze the city variables. These techniques have multiple problems and limitations: they are often generated on a non-continuous basis, focusing on a specific time and space, low variables count, limited to access, and expensive to generate and analyze [10].
A difference that big data brings is the volume of information which is very big. Gi-gabytes of data are captured in smart city from different sources continuously every day, more than ever before. Data from multiple sensors deployed in the city, vehicles or peo-ple generates a great variety of information from GPS signals from vehicles, environment information from deployed sensors and city infrastructures status and normal functioning, leading to new discoveries when using in conjunction from different sources, as an example using environment and traffic information to analyze their relationship. All this infor-mation can be stored with a fast speed, making it possible to be analyzed in real time, reducing costs and taking faster actions.
2.3.2
Mobility on decision support systems
Decision support systems are interactive computer systems for use by managers to access to data and giving them access to analytic models, in a way to improve the decision process using the suitable technology for the problem [11].
This area can be extended to other subjects: the mobility of a city will benefit of a decision support system to take wise choices on the actions over the city mobility and infrastructure.
Using a decision support system on a vehicular data approach, there are some require-ments that can be taken into account:
• Compare transformations over time - decision based on the comparison of different instances of time.
• Analyze vehicle data with multiple granularity’s of time - analyzing information with different aggregations of time.
• Segment information for different roads - segmentation of information based on the road.
• Summarized information for a day or week - summarizing the information for different granularities.
• Information from big amounts of data - structuring and indexing of data.
All these requirements will be the base to build the necessary infrastructure for the provisioning of mobility information to be analyzed and provided through the decision support systems in this document.
2.3.3
City wide dashboards
Many cities are starting to make changes in their intelligence in different areas by adding sensors and providing information through dashboards. In table 2.3 it is compared the functionality and features presented in different dashboards currently available in several cities.
Figure 2.3 contains an example of a mobility dashboard of the city of Dublin where the traffic can be seen in a global view in the main roads, but also parking lot locations using sensors and traffic cameras. Often the data is sourced through annual reports and in the case of the real-time data, it is readable through an API [12]. Our proposed work can extend the information presented by Dublin dashboard by analyzing the roads with greater detail to improve anomaly detection, with information in all streets.
Figure 2.4 presents a dashboard of London where many city variables from points of interest, public transportation (metro status), environment (weather and pollution data) and cameras (street view) are viewed in real-time. Although there is a lot of real time information, this is only being captured and presented for a general consumer, lacking on a more detailed analysis on traffic congestion and pollution data.
Another example is the Boston city dashboard in figure 2.5 where there is information about the trains stops arrival time estimations in real time, a general indicator about the weather, the real time train locations and directions and bike stations. All these infor-mation is obtained from video cameras and sensors in different locations of the city. The dashboard is mainly focused in public transportation, and it could have other indicators on the city mobility as the road traffic.
The Moncloa district from Madrid provides a dashboard in figure 2.6 focused on WIFI connections from the local population and environment indicators. In the WIFI area it displays multiple metrics from the connection times, number of connections and their
city traffic public
transport weather pollution map
map over-lays
London no metro sta-tus wind, tem-perature, humidity, precipita-tion O3, NO2, SO2, PM yes points of interest Dublin yes bus, metro, air mobile apps wind, tem-perature, precipita-tion noise,
O3, NO2 yes
traffic density, parking lots Boston no bus, Train temperature no yes
bike, train stations Moncloa no no temperature, humidity, light noise, CO, NO2 yes wifi heamap
Sydney no train, ferry, bus wind, tem-perature, humidity, precipita-tion O3, NO2, SO2, PM yes real time trans-portation
Table 2.3: Comparison of features from different smart city dashboards. NO2 = Nitrogen dioxide; SO2 = Sulfur dioxide; PM = Particulate Matter; O3 = ozone.
location with a heat-map. On the environment side, it has different charts of weather and pollution metrics within a customized time range obtained from outdoor environmental sensors. It lacks information about the mobility and public transportation of the city.
Sydney city dashboard in figure 2.7 provides information about the environment and public transportation. From the different views we can identify real time information from weather and pollution indicators and also the status of public transportation on a map overlay with their positions in real time. For the public transportation information display, it receives data from the transportation API that uses the Google GTFS1(General
Transit Feed Specification) technology [17]. It also shows real time traffic cameras but it lacks on a more analytic traffic approach.
Figure 2.3: Dublin mobility dashboard [13].
Smart City Developments
The city of Barcelona [8] is an example where smart initiatives are implemented in the city infrastructure from different areas in order to deliver better public services. It uses the fibre optical network, Wi-Fi mesh network, sensors network and public Wi-Fi network to provide intercommunication for the city transportation, education and healthcare services. The main sources of information come from the city sensors, Open Data, and information from the citizens digital footprint. The Open Data project aims also to give public access of government information for the society to use it and create more value for the city.
The Helsinki [19] smart city is an example of the development of the city services and Open Data to all with interest in developing new products and business opportunities through available API. It aims for a mobile application cluster and uses a Living Lab as a platform for idealization and product development of different applications, institutions and services, being the orchestrator that provides support and feedback for collaborative projects. In the public transportation network composed by buses, trains, trams, metro and boats, it monitors these vehicles with equipped GPS locators to collect their location and providing it for the Open Data applications.
In Oulu city [20], in Finland, outdoor smart sensor nodes are a part of a wireless net-work infrastructure in the urban space. The infrastructure is made of: a WLAN netnet-work with approximately 1200 APs (Access Points) for public access; a Bluetooth (BT) network composed by a cluster of Bluetooth APs for free BT access for context-aware services; a cluster of WSN (Wireless Sensor Network) APs across Oulu downtown for a free connec-tivity of low power WSN sensors; large public displays on the streets for displaying city information.
The project from the University of Toronto [21] presents a connected vehicle infras-tructure using intelligent transportation systems network architecture for the road vehi-cle mobility and a stable cluster of vehivehi-cles made of cars and trucks with Home agents
Figure 2.4: London smart city dashboard [14].
and multiple servers in the fixed network. This architecture offers Vehicle-to-Vehicle and Vehicle-to-Infrastructure communication, using GSM/LTE and IEEE 802.11. It has the objective of high network connectivity for large cluster of vehicles for a capable aggregation of the vehicular data.
The city of Santander [22] explores IoT devices and solutions deployed in several urban scenarios around the city to be aggregated into one testbed. The different scenarios include: environment sensors at fixed locations that provide measurements of environment pollution with alarms generated by the system; ferromagnetic wireless parking sensors buried under the asphalt for the occupancy monitoring of the outdoor parking spaces, its usage and accounting; sensor nodes installed on buses uses the General Packet Ratio Service (GPRS) for network communications to transmit air pollution, position and speed of the vehicles in a way to provide mobility patterns around the city; mobile phone sensing using application for user event report in the city and to exploit the users position, direction, noise and temperature.
The testbed presented for the city of Cambridge [23] consists of deployed sensor nodes with WIFI antennas for network connectivity deployed on buildings and street lights, and gateway nodes to provide internet access to the wireless network. The sensor nodes have the objective of data collection and real time monitoring using multiple environment sensors and IEEE 802.11 radios for wireless communication.
A work with the association of the city of Melbourne [24] was the noise mapping case study containing a fixed and mobile infrastructure on public spaces. This work uses a Wireless Sensor Network (WSN) with fixed sensor nodes deployed in street lights or build-ings that continuously monitor the sound levels in a given area, mobile sensors deployed on vehicles that serve as relay nodes for the data buffering and transportation from the sensor nodes through multiple hops to the gateway, that sends the noise measurements via the internet to the cloud.
Figure 2.5: Boston city dashboard [15].
interfaces on units assembled in the city buses. The testbed is composed by wireless nodes in the vehicles that are equipped with a GPS receiver and measures the vehicle position and network performance such as wireless signal strength, network latency and throughput speeds, and a software platform that provides a way of monitoring and make analysis on the performance characteristics of the network. The final objective is to associate the network data measurements with the vehicle position in a way to quantify the impact of mobility on network performance.
Figure 2.6: Moncloa city dashboard [16].
2.4
Data Warehouse
In smart cities the big amount of information that comes from different sources to be processed and analyzed needs a solution like a data warehouse to support the decision support systems and improve the decision making in the city.
”The modern way to build systems is to separate the operational from the informational or analytical processing and data” [26]. The traditional databases systems are focused on operational and transitional operations that, for their operational purpose suits well, but for informational or analytic needs it is necessary another approach, the data warehouses. The analytics of informational processing are designed for the improvement of decision making in a organization looking at different vistas of data to detect trends.
By moving from an operational database where the data is in bulk to a data warehouse, we can fill most of these requirements because the data will be more granular, time variant, subject-oriented and have some summaries. Also the data can be corrected by removing errors or imprecision present in data, to be reusable, and, restructured by segmenting by subject and time and indexed to be accessed faster and in a efficient way.
The ETL (Extract, Transform and load) process is a commonly used procedure in data warehouse systems for the data manipulation before being stored in the data warehouse.
2.4.1
Extract, Transform and Load
Before reaching the data warehouse, the data passes through ETL (Extract, Transform and load) steps, where the errors can be removed, the missing data corrected and can be structured and analyzed from multiple sources for the data warehouse and end user tool requirements [27]: it is the transformation of raw data into information where it is important to improve the quality of data.
Extract
Extract is the first step where the data can be retrieved from different data sources or platforms, using different formats and characteristics, for example having vehicular data from a relational database and environment data from a web service in JSON format.
For the extracting part it is needed to be aware of the different drivers and connection protocols to request data and know the data structure and their different formats. For example, it could be necessary to use JDBC drivers to connect to databases or a HTTP requester API to request data from a web service.
There are two phases on the extraction process [28]: the initial extraction is when a big amount of data is extracted from different sources for the first time to populate the data warehouse, and the incremental extraction is when the data warehouse is updated or added with new data since the last extraction. As an example, the initial extraction can be when the data warehouse is constructed, but we already have vehicular information in a data source of 6 months, so that big amount of data is extracted to populate the
data warehouse for the first time. After that, while the vehicles move, their data can be periodically extracted to update the data warehouse with more recent information.
Transform
The next step in the ETL cycle is the transformation of data. Normally, in this step it is made the cleaning and correctness of the data to make it more consistent and complete. Other transformations and calculations can be made in this process to add new layers of dimensions. In this process it is also made the integration with the data warehouse schema, where the data needs to be sliced in the defined granularities of the fact and dimension tables, and prepared for the structure in each table, making the necessary relationships. Load
Lastly the data is loaded to the multidimensional data warehouse, where the prepared data from the previous extraction and transformation steps is written in the data warehouse or overwritten to update existing information into both fact and dimension tables.
2.4.2
Star schema
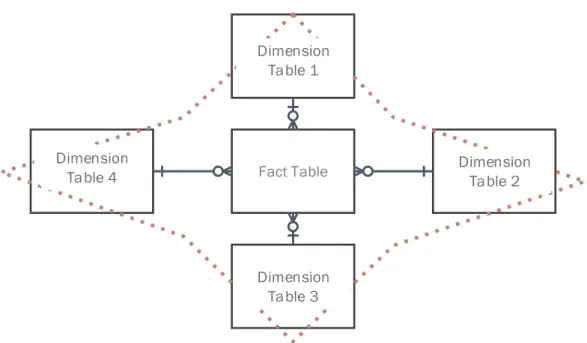
In dimensional modeling, the simpler form of block structure is the star schema which consists of one fact table that has large amounts of data, and the smaller dimension tables that link to the central fact table. In figure 2.8 it is represented a generic structure of the star schema that may have any number of dimensions [29]. Normally the fact table supplies numeric values, while the dimension tables supply labels or descriptions of those values.
A fact table is the primary table in the dimensional model where the performance measurement values are stored, as the term fact represents a business measure [30]. We can imagine a moving vehicle retrieving measurements, intersecting different dimensions of space, time and vehicle, so each measure will add a new row in the fact table. In the fact table there are two or more foreign keys that connect to the primary keys of dimension tables. For example, a vehicle ID in the fact table will correspond to the ID in the vehicle dimension table, and the same applies to other dimensions, expressing many-to-many relationships between dimensions.
The Dimension Tables are the complement of information of the fact tables, containing as many as possible attributes that describe the rows of the fact table [30]. Normally the dimension tables have a relatively low number of rows, but have a large number of columns. It is normally used the dimension tables for the constraints of the query; for example, getting a measurement of the vehicles with the brand Ford will first see the brand in the dimension table vehicle to then mach the ID in the fact table.
As referenced by Kimball, ”Dimension tables are the entry points into the fact table. Robust dimension attributes deliver robust analytic slicing and dicing capabilities. The di-mensions implement the user interface to the data warehouse.” [30]. The better the quality
Fact Table Dimension Table 1 Dimension Table 2 Dimension Table 3 Dimension Table 4
Figure 2.8: A generic structure of a database star schema.
of the attributes and the more they are in the dimension tables, the better description we have about the measurements.
The simplicity of the star schema gives a better understanding of the data by reducing the number of tables, and using meaningful descriptors help to reduce the number of errors and improve the performance as it needs to make less joins while requesting data using a query.
The more granularity that we have in our data, the better the expression and the dimensionality in the data warehouse as it adds different new dimensions to the schema. Even if a certain level of granularity is not needed, it is a good policy to have presented in the dimension tables, as it adds low space and very low impact on performance; on the other hand, the granularity is there for unexpected needed queries. For example, in the beginning we only need to represent the speed of the vehicles with a daily granularity, but for some reason we now need a hour or minute granularity.
2.5
GIS - Geographic Information System
As a lot of information captured from the smart cities devices is geographic namely vehicle and sensor position, the roads and buildings, it would be useful to use it effectively for transformations, calculations or representation, so handling this information using GIS is the natural approach [31]. Statistical geography has emerged during the last decades for the aid of finding patterns or similarities in spatial data sets in a way to provide new spatial theories. Geographic information systems are very good at facilitating the job of spatial analysis to provide a new way of manipulation, visualization and perception of
spatial information to extract additional meaning and improving the understanding of the attributes being examined. GIS can provide techniques that ease the analytic research on spatial information for the user by improving the approach when exploring and presenting spatial data over the traditional methods.
Spatial data is becoming more available in most application fields such as health, edu-cation, commerce and transportation to solve real location problems using statistical and mathematical geography methods. Also, private and public sectors are starting to recog-nize the benefits of applying their models with geographic techniques to solve social and economic problems [32].
The GIS is used for spatial analysis to answer some questions/problems [33]:
• The simultaneous difficulty and importance of finding spatial, temporal, or space-time patterns in large spatial databases.
• The production of large databases raises a number of issues: How can the barriers to users generated by the complexity and size of many databases be reduced? How can the quality of the data be assessed? How can the data be used, even in light of inaccuracies? How might novel approaches to visualization be useful in addressing some of these questions?
• The recent improvements in computational and GIS technology generate a renais-sance for particular methods of spatial analysis, such as point pattern analysis. Geography and cartography must be used together to use GIS and build informative maps. To represent something geographically, it must be either a static geographic infor-mation, for example, a road, or an event that is dynamic and that occurred, for example, at a temporal change.
When representing things and events on a map, it is many times complex, as we want to inundate the map with information. The representation should have a certain level of abstraction without reducing complexity to highlight the essential components and ensure that maps and geographic information makes sense to people. The reliability of geographic information depends on the level of abstraction that is showed on a map. For example, a parking lot location on a map is useful for driving a car and not so useful when riding a bicycle.
Below it can be seen a list of Geographic Information System software, and table 2.4 shows a comparison of these geographic information systems applications.
2http://www.qgis.org 3https://grass.osgeo.org/ 4https://www.esri.com/ 5http://geoserver.org/ 6http://mapnik.org/ 7http://postgis.net/ 8https://openlayers.org/ 9http://leafletjs.com/
System type open source observation
QGIS2 desktop yes open source; supports viewing,
editing, and analysis of data GRASS GIS 3 desktop yes open source; supports raster
and vector data Esri4
desktop, server and mobile
no
GIS software, web GIS and geo-database management applica-tions
GeoServer 5 web server no edit and share geospatial data Mapnik6 desktop and
web server yes
C++/Python library for ren-dering
PostGIS7 spatial
database yes
adds support for geographic objects to the PostgreSQL database
OpenLayers8 frameworks
and libraries yes
JavaScript library for display-ing map data in web browsers Leafletjs 9 frameworks
and libraries yes
JavaScript library for display-ing map data in web applica-tions
Table 2.4: Comparison of a list of geographic information system applications.
Projections
Projections are the transformation of spherical coordinates into planar coordinates [34]. As the geographic information most of the time is collected as latitude and longitude coordinates, it needs to be projected to make it easier to relate with maps that people are familiar with to easily locate things and events.
Projections are based on different models of the earth. The most simple is the spheroid which is most used for the entire earth projections. Figure 2.9 presents the comparison of two commonly used models: the ellipsoid model is made for more detailed or smaller areas and fits the shape of the earth as it is used for horizontal coordinates (point in earth surface) in geodetic networks; the geoid model has the most accuracy, being very optimized for a particular area of the earth and more suitable surface for vertical coordinates (elevation and depths). The smaller the area, the more accurate the projection can be. Although there are these this different models, there is not one case that fits all, and so there is no standard earth model.
For the spatial measurements it is used a geodetic datum which is a set of reference points that take place on the earth’s surface, defining the size and shape to map the earth [36]. Many different datum have been created and, while some are designed specifically for a certain country or region as it will be more precise in that area, others define better the
Figure 2.9: Ellipsoid and geoid comparison [35]. global earth surface.
One of the existing datums, the WGS 84, is a standard for use in cartography, geodesy, and navigation [37] designed to cover the entire world in its scope. This is the reference model that is used worldwide by the GPS systems and the one used in this work when using GIS operations.
OpenStreetMap data
OpenStreetMap10 is a collection of map related data that is free and editable, built in
by contributors that supply data about roads, trails, cafes, railway stations, and others, all over the world. This was impulsed with the wide range and affordable GPS receivers with a high quality location information that anyone can obtain. This project can enable people or small organizations that cannot afford digital geographic information that is multiple times considered as expensive [38].
For GIS applications, the OSM data is the base to work with geometric operations by letting the users import, edit, and tag OpenStreetMap data offline, providing a light structure that provides a reliable and scalable GIS. For example, the OSM street data can be imported to a PostgreSQL database to be used by the GIS application, the PostGIS to perform spatial transformation on the roads from OpenStreetMap.
The OSM data is available in OSM-XML format and Shapefile (SHP) format which can be obtained as a package of a continent, a country or a region from services such as GeoFabrik11 [39].
This OpenStreetMap dataset comes with a specific format, as represented in the fol-lowing table 2.5. The table contains the attribute type, the designation of the attribute and an example of the value of the attribute.
From all the attributes that come with the open street map dataset, only three are being used to provide the relevant statistics in this work:
10http://www.openstreetmap.org 11https://www.geofabrik.de/
attribute designation example gid unique identifier of the segment 24241 osm id open street map identifier 39587108
name name of the segment Rua do gerˆes type the type of the segment residential oneway Boolean to check if the segment is oneway direction 0 or 1
bridge Boolean to check if the segment is a bridge 0 or 1 tunnel Boolean to check if the segment is a tunnel 0 or 1 maxspeed maximum speed allowed in the segment 50
geom geometry type of spatial reference of the segment Multilinestring Table 2.5: List of OpenStreeMap road information attributes.
• gid: the gid is used to provide an unique identifier of the segment.
• name: the name attribute is used so we can have the real name of the street and therefore the possibility to search roads by name.
• geom: the geom attribute is the most important one. With this geometry type variable, it is possible to make multiple spatial operations and transformations on the segments.
PostGIS
The PostGIS module is an open source spatial database extender that adds support for geographic objects for PostgreSQL object-relational database. It adds support of spatial data types for geographic objects to allow geographic and location queries to be run in SQL language [40].
PostGIS, as a geographic information system, enables a regular database to store geo-metric types of data in their tables, and also provides geogeo-metric functions and indexes that enable the manipulation of spatial data directly from the database and answer questions about space and objects in space.
In PostGIS there are three main geometry data types: the point used to represent locations, the linestring that is a sequence of points can represent a street, and the polygon that is similar to linestring, but where the start point is the same as the end point, to represent a region. From these data types we can calculate if a point is in the intersection with a road or if a road is inserted within a certain region, or calculate the distance of a road. For the geometries data types it is specified the spatial reference system that is the way of denoting the coordinate system defined for the geometry points. Different geometries using the same spatial reference system can then be overlaid without distortion. The reference for working with latitude and longitude data from different regions of the globe is the common used WGS 84 Lon Lat spatial reference system [41].
To analyze data from a data set of spatial information loaded into the database, PostGIS enables to query and do spatial operations that create new geometric objects that can be rendered on a map. For example, with a latitude longitude position of a bus, be able to know the road where the bus is and the distance to a certain bus station. To make this, it will be necessary to create a geometric point and intersect the point with a linestring representation of the road, and then calculate the distance from the geometric bus point to the geometric bus stop. All these geometric representations will need to be in the same spatial reference system.
Spatial Operations
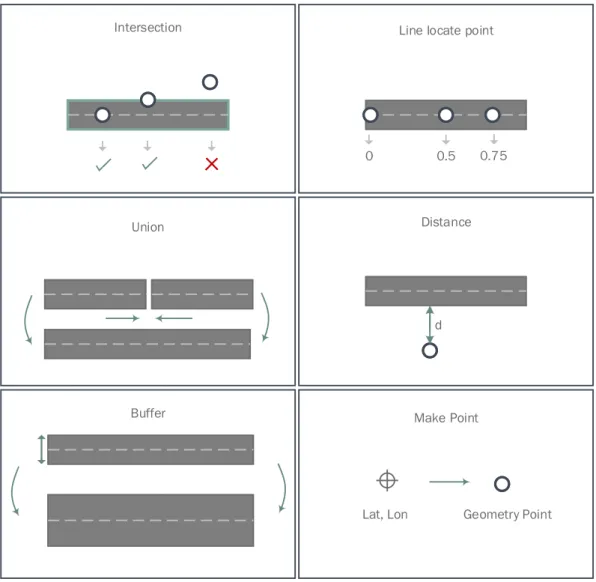
To support the processing and analysis of the vehicles locations, it is used several spatial operations inside the database for road transformations with the help of PostGis specific functions. The main operations used are the following and can be followed with Figure 2.10. These functions enable multiple creations or transformations of spatial data, geometric operations and mathematical calculations with geometry types using spatial database queries. All these operations and more can be found in PostGIS documentation [40].
• Intersection: If two geometries share any portion of space, then a spatial intersec-tion is taking place. This operaintersec-tion is used to check if a certain vehicle posiintersec-tion is inside of a road from the existing ones from the database.
• Line Locate Point: Locates a point inside a line geometry from a range between 0 and 1. The point here is the coordinates of the vehicle, while the line will be the road segment. It is used to know exactly where the vehicle is located in the road segment.
• Union: Merge two line geometries into one geometry. This creates a unique segment by merging two different ones if they are nearby. This operation is helpful to create a customized road segment from the existing ones in the database.
• Distance: Gets the lowest distance in meters between two geometries. Useful to find the closest road to a vehicle location.
• Make point: Create a geometry point from latitude and longitude coordinates. This operation permits to use the spatial operations from the decimal coordinates. When making a point it is a good practise to specify the spacial reference system.
Intersection
0 0.5 0.75
Line locate point
Union Distance
d
Buffer Make Point
Lat, Lon Geometry Point
Figure 2.10: Database Spatial Operations.
2.6
Related Work on Mobility and Environment
Anal-ysis
This section presents the related work in the area of mobility and environment analysis. TrailMarker [42] is an example of a work where different approaches are used to analyze real data sets of vehicular sensor data to find outliers, effectively finding typical patterns and points of variation on the road. This work relates to the present work by having similar objectives of finding road patterns, but is more centralized on the driver side patterns where acceleration and speed are used to predict the type of driver (inexperienced, aggressive, careful). Our proposed work is more centered on the street traffic profile as a whole and not so much on a driver profile as an individual.
Figure 2.11: Traffic mining approach in TrailMarker work [42].
assisting the analysis of road accidents based on accident reports. In the system, the accident locations are geo-referenced into the highways so it is easier to detect the areas with high rate accidents, in a way to take precautionary measures and improve the safety in critical areas. Our system, by making an analysis of the road traffic profile, can visually detect anomalies against an expected profile; although we cannot effectively predict if it is an accident or other event, it helps to improve that zone by detecting the exact location of the problem.
Another important topic is the study of pollution levels related with the road traffic. In an analysis and evaluation made on the main urban roads in Beijing [44], it was used an in place noise sensors along the road for multiple sampling points in order to identify the factors influencing the noise levels. From their results, where more than 3000 vehicles pass every hour, above their designed capacity, the noise levels exceeded the national standard during daytime hours. Other factors were also pointed, the road width, surface texture and the types of vehicles in the traffic composition. Our work tries to follow a similar objective, by correlating the pollution levels with road traffic, but with a more detailed approach on road traffic analysis in a more extended number of roads for an improved detection on the source of the problem.
The work proposed by Keay [45] aims to make a correlation of the road traffic volume in Melbourne city with the weather conditions in the same place. In the study, the focus is on how the weather affects the road traffic. It is compared different seasons of the year, daytime and nighttime instants, and wet against dry days. It concludes that the traffic volume has the greatest impact during the rainfall in winter and spring, where it is reduced on wet days in the daytime and all over the seasons during nighttime. Our work on the other hand tries to focus on how the road traffic affects the environment and pollution indicators.
Tripzoom [46] is a mobile application that collects mobility data and patterns from the users of the application to improve their personal mobility. It senses the mobility of the users, creating a profile about their trips, places, mobility patterns and transport type and
![Figure 2.2: The different layers in a smart city network [7].](https://thumb-eu.123doks.com/thumbv2/123dok_br/16053986.1105668/35.892.142.762.178.606/figure-different-layers-smart-city-network.webp)
![Figure 2.3: Dublin mobility dashboard [13].](https://thumb-eu.123doks.com/thumbv2/123dok_br/16053986.1105668/39.892.141.768.161.450/figure-dublin-mobility-dashboard.webp)
![Figure 2.4: London smart city dashboard [14].](https://thumb-eu.123doks.com/thumbv2/123dok_br/16053986.1105668/40.892.135.766.162.442/figure-london-smart-city-dashboard.webp)
![Figure 2.5: Boston city dashboard [15].](https://thumb-eu.123doks.com/thumbv2/123dok_br/16053986.1105668/41.892.138.767.159.465/figure-boston-city-dashboard.webp)
![Figure 2.11: Traffic mining approach in TrailMarker work [42].](https://thumb-eu.123doks.com/thumbv2/123dok_br/16053986.1105668/52.892.137.761.164.417/figure-traffic-mining-approach-in-trailmarker-work.webp)