BJRS
RADIATION SCIENCES
08-01 (2020) 01-12ISSN: 2319-0612 Accepted: 2019-08-19
Computer Tomography Scanners in Brazil (2010-2017)
T. C. Alonso
1,3, V. C. R. N. Bianchi
3, L. de A. Vieira
4,
A. P. Mourão
1,2and T. A. Da Silva
1,31Departamento de Energia Nuclear – Universidade Federal de Minas Gerais (UFMG),
Av. Presidente Antônio Carlos 6627 - 31270-901-Belo Horizonte, MG, Brazil
2Engenharia Elétrica e Biomédica – Centro Federal da Educação Tecnológica de Minas Gerais
(CEFET-MG) Av. Amazonas 5253 - 30421-169 Belo Horizonte, MG, Brazil
3Centro de Desenvolvimento da Tecnologia Nuclear (CDTN/CNEN)
Av. Presidente Antônio Carlos 6627 - 31270-901-Belo Horizonte, MG,Brazil
4Secretaria de Saúde do Estado de Minas Gerais (VISA/MG)
Rodovia Papa João Paulo II 4143 – 31630-900 - Belo Horizonte, MG,Brazil alonso@cdtn.br
ABSTRACT
The aim of this study was to verify the availability of CT scanners in the Brazilian territory, for the period 2010 to 2017, comparing the results with those indicated by the Brazilian legislation (Ordinance GM/MS Nº. 1101, 2002; Resolution RE Nº. 1016, 2006). The second objective is a review of the most recent national data; stated official statistics on the number of CT scanners installed in Brazil and compares them with the data available from other countries, obtained in international publications. Estimates of the CT scanners distribution are made by the utilization rate, which means the number of scans performed per thousand inhabitants multiplied by the total population of the region, where as the maximum coverage area of scanner in a radius of 75 km or 100,000 inhabitants. The results suggest greater concentration of equipment in the Southeast, South and Midwest area, private and public sectors, and a number of scans far above the recommended, throughout the Brazilian territory. The number of CT scanners currently in operation in Brazil would have the ability to cater to a population up to 110,7 % higher than the current population, and their geographical distribution within the country largely unknown.
.
1. INTRODUCTION
Computed Tomography (CT) was the first medical imaging system to produce fully digitized images with good spatial resolution. Its sensitivity to small differences in the tissue attenuation coefficient is about ten times higher than that of screen-film systems used in conventional radiology [1, 2]. X-ray CT as diagnostic imaging method started in the year 1972, and caused a big change in the diagnostic process in medicine. Since then, technological advances and their use in various clinical specialties have been important. The use of CT diagnosis is widespread and digital image reconstruction expands its applications every single day [3].
One of the latest advances in CT technology has been the introduction of the multislice scanners (MSCT). The MSCT scanners increasing the diagnostic applications due to the considerable reduction in the data acquisition time, with has made the acquisition process more comfortable for patients. These MSCT scanners have a fundamental upgrade in single slice systems only when a detector array allows multiple slice data to be acquired simultaneously, enabling the volumetric section reconstructions of the patient's body [4].
Currently, CT scan is the main method of diagnostic imaging, characterized by the increasing number of installed equipment worldwide. However, the expansion of this diagnostic method in recent decades has caused its relatively high doses in patients to increase the exposure of the general population [5]. The United Nations Scientific Committee on the Effects of Atomic Radiation (2010) stated that 43% of the total collective effective dose comes from CT scans. For this reason, efforts has been made by the scientific community to develop strategies to minimizing the doses in CT procedures.
The distribution map and number of CT scanners, as well as the technological progress, allow the creation of mechanisms to meet the local dose reference levels, also associated with the justification of practices and optimization of technical procedures linked to the scanner type. In this work, a survey was made of the number of CT scanners installed in Brazil and their distribution throughout the national territory considering data up to 2017. The second objective is a review of the most recent national data; stated official statistics on the number of CT scanners installed in
Brazil and compares them with the data available from other countries, obtained in international publications
1.1. - Amount of CT scanners in Brazil
The Brazilian law 453/98 SVS/MS [6], is the legislation that regulates the use of diagnostic radiology in radiological practices in order to ensure the quality of the tests carried out, increasing the degree of c diagnostic confidence and promoting radiation safety and optimization. The Ordinance GM/MS No. 1101 (2002) determines the parameters of CT scanners per inhabitants in a rate of one for every 100,000 inhabitants, or 10 per million.
In 2017, a total of 4,739 CT scanners were estimated throughout Brazil, representing an average of 22.81 CT scanner per million. This amount of working CT scanners working represents an oversupply. Available statistics indicate the number of installed scanners in use and the obsolete equipment, but do not present data on the level of technological update of these scanners [7].
Minas Gerais is the Brazilian State with the largest supply of diagnostic health equipment per capta, in 2017 registered 469 CT scanners installed. The supply of CT scanners in the private healthcare system of Minas Gerais is 12.5 per million. Considering only the amount of equipment installed on the private healthcare system in this State, this amount exceeds the CT scanners installed in countries such as France, Australia and the United Kingdom. In the UK considering public and private healthcare system, this ratio is 8.91. In France, the rate is 12.5, the same registered only in private healthcare system of Minas Gerais.
Observing the evolution of the CT scanner rate by the state populations, there has been an increase in recent years. The healthcare private system of Rio de Janeiro offers a rate of 21.3. The rate in São Paulo is 14.11, in Paraná is 14.70 and in Rio Grande do Sul is 13.28. The state of Rondônia is the second in the Brazilian score with a rate of 19.21 per million [8].
1.2.- Framework in the international context
The Japan is the country with largest number of CT scanners in the world. In 2014 presented a rate of 107 CT scanner per million, followed by Australia, which is a distant second place, with a rate of 56.09 [9]. From 2005 to 2011, the number of CT scanners in Japan increased by 47% (8,789 to 12,945), and similar results were observed in terms of their use [10]. In 1979, there was an
increase of approximately 1,500,000 annual numbers of exams; this index reached an average of 12,000,000 in 1989, and 37,000,000 in 2000. The number of CT tests increased eight times from1979 to 1989 and tripled from 1989 to 2000 [11, 12].
In the United States in 2006 were carried out approximately 62,000,000 CT tests, and in 2014, the CT scans exceeded 81,000,000 [12, 13]. According to the article published by INCA (2014), 40% of the CT scans carried out in the United States is unnecessary and approximately 29,000 new cancer cases are expected as a result of performing 72,000,000 CT scans. In England about 2,000,000 CT scans were performed over a year, representing approximately 9% of all radiological examinations performed in the country. Even though individual test doses are small, when multiplied by the number of scans performed, the analysis benefits and risks point to a potential increased in future health risk for this unduly exposed population. This is due to the number of requested examinations inappropriately [14].
2. MATERIALS AND METHODS
To know about the amount of CT scanners and clinical production in Brazil and other countries, data sources from the IBGE (Instituto Brasileiro de Geografia e Estatística) were used, through publishing Research Medical-sanitary Assistance, data provided by the CNES (Cadastro Nacional dos Estabelecimentos de Saúde) and according to the OECD (Organization for Economic Co-operation and Development) [9, 15; 16].
The previous survey of the number of CT scanners in Brazil indicated by their location was seeking information from the data source from the Brazilian Ministry of Health [9]. In the analysis of the CT scanner geographical distribution was considered the whole of scanners by Brazilian State, the regional population and was calculated the rate for 100,000 inhabitants. The results were analyzed by region according to the criteria of the Brazilian Ministry of Health, GM/MS No 1101/2002 [8, 17,18].
3. RESULTS
3.1.-Distribution of CT scanners
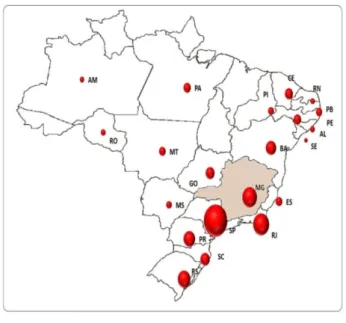
Shortages and excesses can be found in the regional distribution of CT scanners. Some states have oversupply while others do not have enough. In the South and Southeast regions, there is a strong concentration in the supply of CT scanners. Figure 1 illustrates the distribution of CT scanner for a group of 1,000 inhabitants in Brazil in 2010. In this map the area of the circles is proportional to the CT scanners amount.
Figure 1. - Distribution of CT scanners in Brazil.
Source: IBGE, 2010.
In 2010, from 2,680 CT scanners distributed on the Brazilian territory, 52,77 % concentrated in the cities of São Paulo and Rio de Janeiro, with a total of 1,413 units. The number of CT scanners in cities where they have at least one device is the ratio of a scanner for 31,250 inhabitants. This is a rate of 32.61 scanners per million.
There is an inadequacy between supply and demand in the distribution of CT scanners in Brazil. There are cities with up to 164,00 CT scanners per million, more than 16 times the reference parameter of availability, demonstrating the high concentration of this equipment in some places.
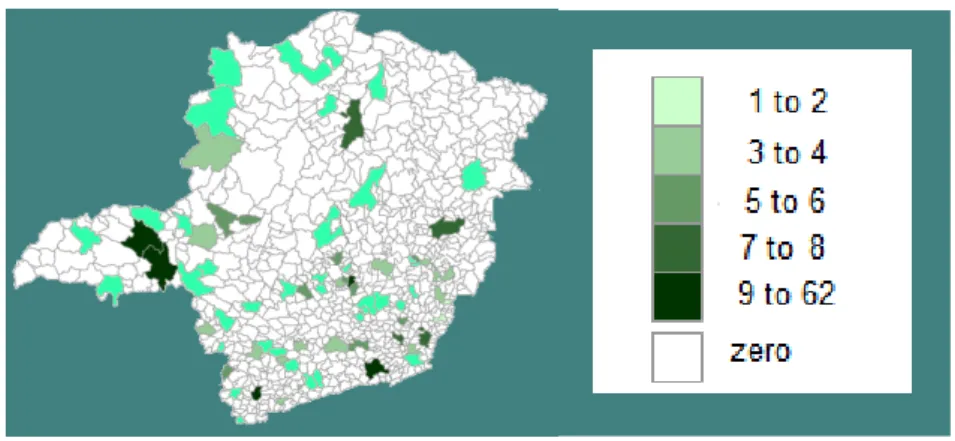
Despite the lowest population density in the Midwestern, North and Northeast regions there is a shortage in the supply. In Minas Gerais the distribution of CT scanners by the areas of the State is not balanced. In the North State area 129 municipalities have their populations totally out of the access to the CT exams (Figure 2).
Figure 2. - Distribution of CT scanners in Minas Gerais State.
Source: IBGE, 2010.
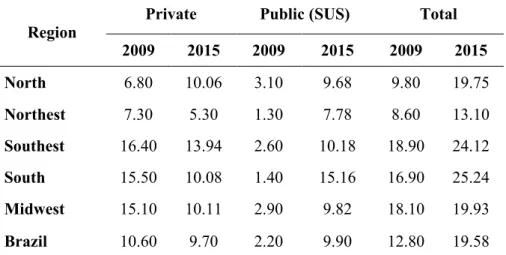
The majority of diagnostic procedures in Brazil is performed by the Sistema Único de Saúde (SUS) and complemented by the provision of private services. Table 1 presents the number of CT scanners by the regions of Brazil, in the years 2009 and 2015. The scenario of the technological park of CT scanners points a positive fit for the diagnostic procedures performed by the SUS in recent years. In the Southern Region in 2009, the rate was 1.40 per million and this grow up to 15.16 in 2015, overcoming the current reference index.
Table 1. Number of CT scanners per million in Brazil.
Region Private Public (SUS) Total 2009 2015 2009 2015 2009 2015 North 6.80 10.06 3.10 9.68 9.80 19.75 Northest 7.30 5.30 1.30 7.78 8.60 13.10 Southest 16.40 13.94 2.60 10.18 18.90 24.12 South 15.50 10.08 1.40 15.16 16.90 25.24 Midwest 15.10 10.11 2.90 9.82 18.10 19.93 Brazil 10.60 9.70 2.20 9.90 12.80 19.58
In 2009 there were 2,477 CT scanners installed in Brazil, which corresponded to an index of 12.80 scanner per million. In 2014, the number of CT scanners installed was 3,791, representing an addition of 53.05%compared to the year 2009, passing the index for 19.58 [7, 9].
3.2.-Brazil in the global scenario
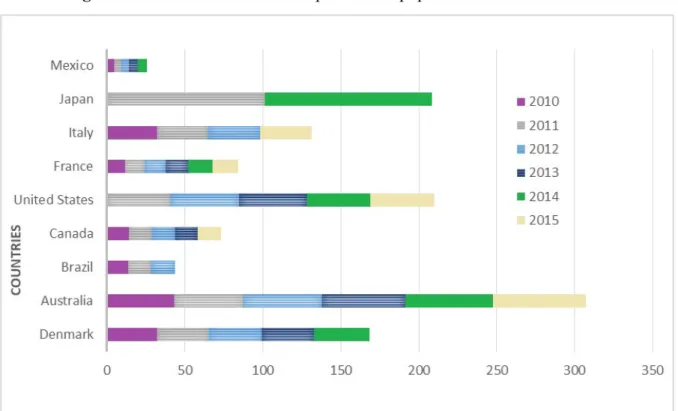
The increase in the number of CT scanners installed in the Brazilian technological park follow the world trend. The availability of CT scanners in Brazil is in the average of the countries selected for comparison of OECD (2017). The chart in Figure 3 presents the number of CT scanners per million inhabitants in some countries, in the years 2010 to 2015.
On the world stage of CT scanners (Tab. 2) between 2010 and 2015, Brazil occupies the 16th position having an index of 15.34 computed tomography equipment per million inhabitants. While the Japan is in the first position with an index of 107.11 scanner per million in 2014 [10], and Australia is on the second position with 56.09, in the same year [9]. Other works should be carried out considering its geographic distribution and the technological evolution of the CT scanners.
Figure 3: CT scanner distribution per million population – 2010 and 2015.
Source: IBGE, 2010.
Table 2. Number of CT scanners per million.
Year Germany Australia Brazil Canada USA France Italy Japan Mexico
2010 32.32 43.07 13.73 14.23 * 11.82 32.17 * 4.69 2011 32.86 44.32 14.49 14.62 40.87 12.53 32.62 101.28 4.52 2012 34.01 50.51 15.34 14.68 43.83 13.49 33.29 * 5.10 2013 33.72 53.68 * 14.73 43.43 14.50 33.10 * 5.32 2014 35.34 56.09 * * 40.97 15.33 * 107.12 5.92 2015 * 59.64 * 15.01 40.94 16.61 * * *
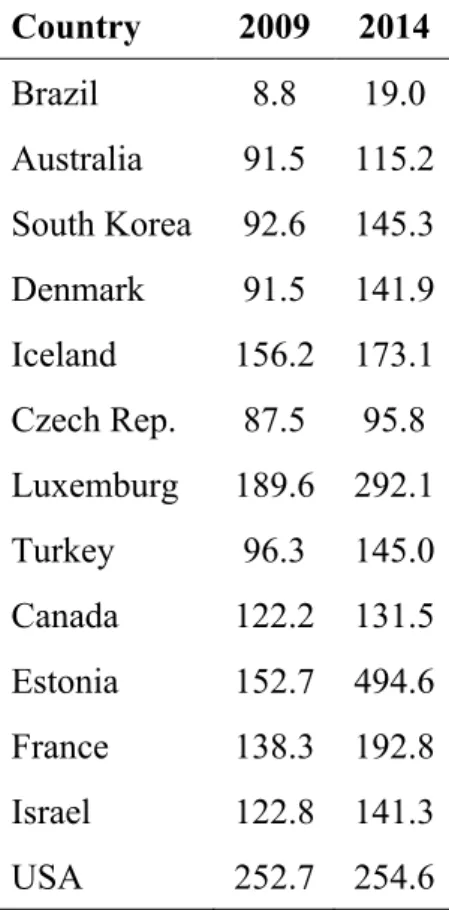
Table 3. Number of CT scans in 2009 and 2014 Country 2009 2014 Brazil 8.8 19.0 Australia 91.5 115.2 South Korea 92.6 145.3 Denmark 91.5 141.9 Iceland 156.2 173.1 Czech Rep. 87.5 95.8 Luxemburg 189.6 292.1 Turkey 96.3 145.0 Canada 122.2 131.5 Estonia 152.7 494.6 France 138.3 192.8 Israel 122.8 141.3 USA 252.7 254.6
A significant increase in the number of CT scans occurring in Brazil. Analyzing the data in Table 3, adapted to 2014, it is possible to compare the average Brazilian CT examinations performed for each 1,000 inhabitants and compare with other countries [9]. It is observed that the US was carried out 13.37 times more CT scans than in Brazil. Identifies that since 2009 the developed countries have produced an average of more than 100 CT scans for every 1,000 inhabitants. The Estonia in 2009 produced 152.7 for each 1,000 inhabitants and tripled this value in 2014. The Brazil produced on average 8.8 scans for each 1000 inhabitants in 2009 until 2014 practically doubled the number of scans [9].
4. DISCUSSION
The supply of CT scanners to meet all Brazilian municipalities, either in private or public service is more than enough when you consider the Park installed and the population, applying the Brazilian reference parameter proposed for provision of such equipment. However, as the data from this study demonstrate, the scanners are not distributed by nationwide according to population distribution, causing the population of several municipalities does not have an easy access to the CT examination. Therefore, the heterogeneous distribution of CT scanners with respect to the population distribution in the Brazilian territory, causes a portion of the population has a much higher offer than recommended and another portion has no possibility to access to the CT scans. Even the part of the population that lies in the region of surplus scanners does not have access to these CT exams, due to a non-egalitarian access to health services.
The increasing demand of CT scans is a reality worldwide. The solution to decrease this demand would limit prescribing unnecessary tests and reduce variability in the services. However, some factors may make the tests increase significantly in Brazil. Examples of these factors are: the highest scope of the exam in recent years by SUS, the aging of the population and the lack of information about benefits and risks.
5. CONCLUSION
There is no doubt the increase in the number of CT scanners in the Brazilian technological park, especially in recent years. However, the CT scanners are not distributed according to the population distribution in the territory. This fact does not indicate that the number of scanners is suited to current needs or the number of scans performed is sufficient or excessive. These uncertainties suggest the need for further researches on national guidelines for prescribing CT scans. In addition, to adopt strategies of radiological protection, due to the risk associated with the ionizing radiation it is important to know the geographical distribution and the park technological evolution, appropriate to local realities.
ACKNOWLEDGMENT
This codes. References to family members, political and religious institutions or entities will not be accepted. This work was supported by FAPEMIG (PPM) and the Brazilian Institute of Science and Technology (INCT) for Radiation Metrology in Medicine.
REFERENCES
[1] KALENDER, W. A. X-ray computed tomography: Institute of physics publishing physics in medicine and biology Phys. Med. Biol. Received 28 February 2006, in final form 4 April 2006, online at stacks.iop.org/PMB/51/R29, 51 (2006) R29–R43, 2006.
[2] COSTA, P. R. Application of the FDK algorithm for multi-slice tomographic image reconstruction. Revista Brasileira de Engenharia Biomédica; v. 26, p. 105-120, Brasil Ago, 2010. [3] CALZADO A.; Geleijns J. Tomografía Computarizada: evolución, principios técnicos y aplicaciones - Computed Tomography. Física Médica. Departamento de Radiología y Medicina Física. Universidad Complutense. Madrid. 2 Radiology Department. Leiden University Medical Center, Rev Fis Med, 11 (3): 163-180, 2010.
[4] FLOHR, T.C.; Schaller, S.; Stierstorfer, K.; Bruder, H.; Ohnesoege, B.N.; Joseph, S.U. Multi-detector row CT systems and image-reconstruction techniques. Radiology, 235:756-773, 2005. [5] GOLDMAN, L. W. Principles of CT: radiation dose and image quality, J Nucl Med Technol, 2007.
[6] BRASIL MINISTÉRIO DA SAÚDE. ANVISA Portaria nº 453, de 01 de junho de 1998. Diretrizes de proteção radiológica em radiodiagnóstico médico e odontológico./ Ministério da Saúde, Agência Nacional de Vigilância Sanitária. Brasília, DF: Diário Oficial da União, 1998. [7] BRASIL MINISTÉRIO DA SAÚDE. ANVISA. Departamento de Informática do Sistema Único de Saúde (DATASUS). Sistema de informações ambulatoriais SUS. Disponível em: http:// www.cnes2.datasus.gov.br. Acesso em out., 2018.
[8] IEES -INSTITUTO DE ESTUDOS DE SAÚDE SUPLEMENTAR São Paulo, 08 de abril de 2014, www.iess.org.br. Acesso 2014.
[9] OECD Organização para cooperação e desenvolvimento econômico Computed tomography (CT) exams (indicator). http://stats.oecd.org/index.aspx?DataSetCode> Acesso em: 17.10.2015, 2017.
[10] MASATOSHI M., Soichi K., Saori K., Kazuo A. – Geographic distribution of CT, MRI and PET devices in Japan: A longitudinal Analysis based on national census data. Journal pone 0126036, 2015.
[11] NISHIZAWA K , Matsumoto M , Iwai K , Maruyama T Survey of CT practice in Japan and collective effective dose estimation - Europe PMC, (PMID:15148792), 2004.
[12] UNSCEAR - Sources and effects of ionizing radiation. United Nations Scientific Committee on the Effects of Atomic Radiation 2010. Report to the General Assembly, with Scientific Annexes. Volume I: Sources. UN Sales Publication. New York, USA: United Nations, 2010.
[13] SODICKSON A., Baeyens P.F., Andriole K.P., Prevedello L.M., Nawfel R.D., Hanson R., Khorasani R. - Recurrent CT, cumulative radiation exposure, and associated radiation-induced cancer risks from CT of adults - Radiology. 2009 Apr; 251(1):175-84. 2009.
[14] INCA - INSTITUTO NACIONAL DE CÂNCER José Alencar Gomes da Silva. Coordenação de Prevenção e Vigilância Estimativa 2014: Incidência de Câncer no Brasil / Instituto Nacional de Câncer José Alencar Gomes da Silva, Coordenação de Prevenção e Vigilância. Rio de Janeiro: INCA, 2014.
[15] INSTITUTO BRASILEIRO DE GEOGRAFIA E ESTATÍSTICA (IBGE). Projeção da população do Brasil: 1980-2050. (tabelas on-line). Disponível em <URL: http://www.ibge.gov.br> Acesso em set 2016.
[16] CNES -. Ministério da Saúde. Secretaria de Atenção á Saúde – DATASUS. Cadastro Nacional de Estabelecimentos de Saúde. Brasil. Acesso em 28 fev, 2016.
[17] BRASIL MINISTÉRIO DA SAÚDE. ANVISA. Portaria GM/MS nº 1101, de 12 de junho de 2002. Estabelece os parâmetros de cobertura assistencial no âmbito do Sistema Único de Saúde – SUS. Diário Oficial da União, 2002.
[18] SANTOS, D. L., Leite H.J.D., Rassella D., Souza e Silva S.A.L. - Distribution of computed tomography, 2013.