ANO IV – Volume 1 - Número 1 2017 Artigo
The Impact of Budget Constraint in Hyper Caloric Food
Consumption
Breno de Paula Andrade Cruz1
Steven Dutt Ross2
Nathália Cândido da Silva3 Abstract:
The obesity is an actual fact in too many countries (NG et al., 2014). The goal of this study is to understand the impact of budget constraint on hyper caloric food consumption. Using an experiment with 60 consumers, three hypothesis were tested. The result of H1 shows us that with R$ 10,00 the same consumer had a hyper caloric consume (in a budget constraint context) buying an extra 180 calories per real spent compared to another context (R$ 50,00). H2 was tested identifying the impact of BMI in Food Caloric Density per Real Spent (FCDRS) with R$ 10,00 or R$ 50,00. H3 analyzes the relation between income (which is different from budget constraint) and the FCDRS showing us that there is not an impactful relation between the income and the caloric food consumption. These results show us various opportunities to future researches.
Keywords: Budget Constraint; Hyper Caloric Foods; Obesity. Resumo:
A obesidade é um fato real em muitos países (NG et al., 2014). O objetivo deste estudo é entender o impacto da restrição orçamentária no consumo de alimentos hipercalóricos. Usando um experimento com 60 consumidores, três hipóteses foram testadas. O resultado da H1 mostra-nos que, com R$ 10,00, o mesmo consumidor teve um consumo hipercalórico (em um contexto de restrição de orçamento), comprando 180 calorias extras por real gasto em comparação com outro contexto (R$ 50,00). O H2 foi testado identificando o impacto do IMC na Densidade Calórica Médica por Real Gasto (FCDRS), com R$ 10,00 ou R$ 50,00. H3 analisa a relação entre renda (que é diferente da restrição orçamentária) e o FCDRS, mostrando que não há uma relação impactante entre a renda e o consumo de alimentos calóricos. Esses resultados nos mostram várias oportunidades para pesquisas futuras.
Palavras-chave: Restrição orçamentária; Alimentos Hiper Calóricos; Obesidade.
1Professor do mestrado Acadêmico em Administração da Universidade Federal Rural do Rio de Janeiro
(UFRRJ). E-mail: [email protected]
2Docente da Universidade Federal do Estado do Rio de Janeiro (Unirio) 3Administradora Pública (UFRRJ); ex-bolsista de iniciação científica CNPq.
ANO IV – Volume 1 - Número 1 2017 Artigo 1. Introduction
The food consumption in Brazil has been changing since XX century, when we analyze social and economic challenges, e.g. consumers has been choosing food that mixes quality features, faster preparing and practical way to cook (SILVA; PAULA, 2003; SOUZA; OLIVEIRA, 2008). Despite these challenges, the contemporary trouble is obesity and other diseases associated to this clinical profile, becoming a public health problem (ESTIMA, 2012; GORGULHO, 2012; QUAIOTI; ALMEIDA, 2006). Numerous countries worldwide are planning public policies trying to solve or reduce this problem considering the relation between food consumption choices and obesity.
Food choice is a dynamic and personal system involving nutritional information and consumer budget constraint (JOMORI et al., 2008). Analyzing the food choice determinants Claro (2006) and Eufic (2005) show us six influencing factors: (i) biological; (ii) social; (iii) psychosocial; (iv) physical; (v) economical and (vi) food knowledge and attitudes. Cruz et al. (2015) showed in a qualitative study in Brazil that consumers who have scarce money buy fattening products instead of heathier ones.
Despite this result found by Cruz et al. (2015), we should not consider obesity as the result of consumer habits and behaviors because studies have shown other factors than the six factors presented above (CLARO, 2006; EUFIC, 2005). Nevertheless, we have to consider the food consumption style in big cities - consumers do not have time to prepare their daily meal (SILVA; PAULA, 2003; SOUZA; OLIVEIRA, 2008); or the budget constraint – when the consumer knows and decides to buy a product that has higher caloric density than others that are healthier but more expensive (CLARO, 2006). Would consumers intend to buy caloric density foods in a budget constraint context?
Even some studies had shown the relation between income and a density caloric diet (PEREIRA et al., 2003; QUAIOTI; ALMEIDA, 2006), Barbosa et al. (2009)’s findings evidences that people who have higher income also have bigger Body Mass Index (BMI) than people with a lower income. It might be controversial if we consider the World Obesity Ranking (NG et al., 2014) understanding that
ANO IV – Volume 1 - Número 1 2017 Artigo among the Top 10 obesity countries in this ranking, just two (USA, 2th and
German, 8th) are developed countries.
In this paper, the relation between budget constraint and caloric density consumption will be the only analyzed factor. First of all, the difference between income and budget constraint will be highlighted: (i) budget constraint context happens when a consumer has not enough money in a specific moment to buy a product or has a need to make savings; and (ii) income is a weekly, monthly or annual revenue. For example, a person with a higher income in an international trip could be in a budget constraint - this person could choose a fast food restaurant because the need of economizing in that trip.
The relation between our questions and a consumption context in Brazil is related to public policies because the prices of hyper caloric foods generally are lower than healthier and hypocaloric foods (AQUINO; PHILIPPI, 2002). For example, manufactured goods (such as ice creams, nuggets and cup noodles) are cheaper than others are (like salads, fruits or fish). The main question is: do consumers buy hyper caloric density products in a budget constraint context? Specifically, three other questions arise: (i) is there any budget constraint’s impact on individual hyper caloric diet consumption? (ii) is there any correlation between budget constraint and personal BMI? (iii) is there any relation between personal consumption income and Food Caloric Density per Real Spent (Brazilian currency)?
2. Constraint Budget, Hyper Caloric Diet and Obesity
Food consumption in Brazil is changing in the last decades. Involved by social and economic challenges, Brazilian consumers are looking for practicality, convenience, speed and quality when they cook at home (SILVA; PAULA, 2003; SOUZA; OLIVEIRA, 2008). Other determinants as urbanity, age and women working out are some of many characteristics we have to analyze to understand these challenges in Brazilian food consumption context (COELHO et al., 2009). A result of these challenges, specially manufactured or hyper caloric products
ANO IV – Volume 1 - Número 1 2017 Artigo that grown up in Brazil (AQUINO; PHILIPPI, 2002; SOUZA; OLIVEIRA, 2008),
could result in obese citizens.
Even obesity has not just a single determinant (QUAIOTI; ALMEIDA, 2006). We highlighted in this paper the economical determinants - as income, constraint budget and food available. It is not our intention to discuss obesity and its determinants but we consider obesity a public policy theme. Even having five other obesity determinants (biological, social, psychosocial, physical and food knowledge and attitudes) our goal is to understand the economical determinant, specifically constraint budget as a variable in the consumer decision process involving hyper or hypo caloric diet.
Regarding economical determinants, Kruchen-Pereira (2003) and Beting (2003) show us an important way to understand hyper caloric diet in families: numerous countries (including Brazil) has had an increase in the consumption of manufactured products - especially frozen food. According to these authors, from 1993 to 1998 this increase was about 25%. In Brazil, specifically in São Paulo, among teenagers, Estima (2012) emphasizes other way to understand the consumption of fat and sugar products: they do not have time to have their meals being fast foods a solution to this trouble. Adding up to Estima’s point of view, Gorgulho (2012) points out that eating out is a determinant to hyper caloric diet (sugar and fat meals).
A new academic study in Brazil has presented that consumers (homemakers) prefer to buy hyper caloric products because they are cheaper than natural ones and more practical, more convenient and quicker to cook (CRUZ et al., 2015). According to these consumers, even knowing about hyper caloric properties, they have to balance their constraint budget to food prices.
Snyder (2004) did a research in United States trying to understand the relation between poverty and obesity. Despite his findings, the sample of poor American citizens analyzed has presented that consumers preferred to eat hyper caloric products with lots of sugar and fats because they wanted to save money. In that sample, consumers have preferred to save money than buy hypo caloric and healthy products (more expensive than hyper caloric ones).
ANO IV – Volume 1 - Número 1 2017 Artigo In a frozen and manufactured product market, we have to highlight two
characteristics: (a) the practicality to prepare at home or in an office; and (b) competitive prices. Despite the first one, the consumption and life style can influence consumers to eat these kind of foods - e.g., small families do not have time to prepare a traditional meal and prefer to buy manufactured (SILVA; PAULA, 2003). The second reason is competitive prices - companies that offer these products generally are big food firms and they can produce big quantities reducing fix costs offering competitive products. About competitive prices, Aquino and Philippi (2002) discussed an interesting statistical data: even with the consumer’s purchasing power increase, the prices of manufactured products gone down helping people who are in bad social and economic stratum.
Claro (2006) emphasizes the food price and family income are primary determinants in consumer choice. Regarding this author, price is a prohibited mechanism in food consumption decision. In words others, we have a constraint budget as a prohibited mechanism to buy food. According to Aquino and Philippi (2002), Claro (2006) and Cruz et al. (2015) when the consumer has to decide about food consumption, competitive price is a very important determinant to buy (or not). Therefore, hyper caloric food characteristics seems less important than price. Batalha and Lambert (2005) affirm consumers are paying more attention to price than nutritional information.
It is important to emphasize that bigger income does not influence a good diet, for example as discuss Barbosa et al. (2009). These authors highlight that with Brazilian northeast men with higher income a bigger Body Mass Index (BMI) is perceived in comparison with men with lower income, for example. Could authors that were analyzing BMI and income find any correlation among the hyper caloric food decision context showed by Snyder (2005) to BMI and constraint budget?
Some authors discuss correlation between obesity and consumption - specifically hyper caloric diet (AQUINO; PHILLIPI, 2002; PEREIRA et al., 2003; SNYDER, 2005; QUAIOTI; ALMEIDA, 2006; CAROBA et al., 2008; CRUZ et al., 2015). On that note, ingesting hyper caloric foods might result in an obesity clinical disease. Understanding obesity as a public health problem, Quaioti and
ANO IV – Volume 1 - Número 1 2017 Artigo Almeida (2006) suggest two ways to solve this trouble: progressive and
retrogressive strategies. In a progressive strategy way related to budget constraint, is possible to subsidize health products. In a retrogressive way, tax hyper caloric foods.
3. Methodology
Concerning the analysis of Constraint Budget (CB) and Food Caloric Density by Real Spent we made a statistical experiment using two contexts: ‘CB 10’ is a Constraint Budget context in which the consumer has R$ 10,00 (ten Reais) and ‘CB 50’, in which the consumer has R$ 50,00 (fifty Reais). Our hypothesis are presented below:
H1
There is a difference amount of consumed calories by Real spent among groups with Budget Constraint (Group 1 = CB 10, Group 2 = CB 50).
H2
There is a linear association between BMI and Food Caloric Density by Real Spent.
H3
There is a linear association between individual income and Food Caloric Density by Real Spent.
3.1. Factorial Experiment Design and Manipulation
An experiment does not have the intention to generalize its results since its goal is to verify any impact of one or more independent variables in a dependent variable (MALHOTRA, 2001). In other words, the main goal in an experiment is to analyze a manipulation influence of independent variables in dependent
ANO IV – Volume 1 - Número 1 2017 Artigo variables. Seeking reassurance (accuracy results), an experiment must have 30
observations performed to any manipulated variable involved - to each manipulated variable there is another counterfactual (control group). Despite this, we have CB R$ 10,00 (30 consumers) and CB 50,00 (30 consumers) which adds up to 60 consumers.
3.2. Building the Dependent Variable
Food Caloric Density by Real Spent is a quotient between (i) kilocalories amount (Kcal) and (ii) the total of money spent at the simulated consumption context. The kcal amount variable scale here is all calories presenting at all products chosen by consumer. It was necessary to create this variable because 60 consumers should present different quantity of money and of kcal amount amongst them. For example, in a CB 10,00 context, a person chooses eight products adding 3.279 Kcal, spending R$ 9,78 - which adds up 335,78 kcal by Real spent (3.279/9,78). The same consumer in a CB R$ 50,00 context choose 12 products adding 6.105 Kcal, spending R$ 27,88 - adding up 218,97 by Real spent. The reason to create this variable is: the quantity of calories will be higher in absolute numbers if the constraint is higher but it might be lower regarding calories and the amount of Real spent. In other words, analyzing the example above, with R$ 10,00 a consumer spent 335,78 for each Real and with R$ 50,00, spent 218,97 for each Real. With just this quotient, we can analyze our hypothesis. The draw for a person falling into one of the groups was completely random.
3.2.1. Building and Testing the Survey
We designed three steps in this phase of our research. The first one was to identify hypo and hyper caloric foods. With the help of a specialist, we identified 41 foods that could be available to consumers in a simulated context. Each product had one direct substitute - e.g., a yogurt (hyper caloric) had a greek yogurt (not fat) or greek light yogurt (healthier - hypocaloric). For choosing these
ANO IV – Volume 1 - Número 1 2017 Artigo 41 products, we considered (a) higher caloric density and lower prices when
compared to healthier products, (b) lower caloric density and higher prices when compared to fatter products and (c) products that were among these extremes.
The second step was to consider consumers who could have any kind of food restriction – such as vegans, vegetarians, macrobiotics, hypertensive and diabetes could have their food consumption decision influenced by their historic of food restriction context. Despite this, we filtered and rejected these consumers on this survey because we understood that this kind of consumers could be affected by their personal food decisions or personal diseases.
The third step in this phase was conducting a survey’s pretest (i) trying to identify mistakes or other kinds of food restriction (such as doing a diet for cosmetic weight loss) and (ii) creating the simulated consumption context with 41 products. We called three specialists (one in qualitative and two in quantitative research) and five consumers to help us to find some mistakes or gaps, avoiding systematic errors. Some challenges were made after pretest and we reproduced after the simulated consumption context to 60 consumers.
3.3. Selecting Consumers and Data Collection
The research happened in Rio de Janeiro’s state (Brazil) from February to April of 2015. As various studies in Statistic have shown (CAMPBELL; STANLEY, 1979; MALHOTRA, 2001; MCDANIEL; GATES, 2006) in Social Applied Science, the research should approximate its simulated context to reality possibly influencing the quality of data. Before going to field for data collection, we tried to get a supermarket that could be our partner by offering us space and products to collect data but we were not able to use this strategy. In this context, we bought 41 products, organized a room at the university presenting all 41 products on table trying to reproduce a supermarket environment and we started to invite people to enter.
Before entering, a potential consumer had to answer some questions (filter questions - food restrictions). If the consumer had not any food restriction, he could enter in the room to contribute with our investigation. A brief explanation
ANO IV – Volume 1 - Número 1 2017 Artigo about the research was given to each consumer - the idea here was to explain
the goal without totally clarifying the research goals (which might be influence our consumers).
With all 41 products on table, the first 15 consumers had contact with Context 1. Other 15 consumers had contact with Context 2. The same strategy was used to the next 15 consumers and to the other last 15 ones (adding up to 60). We decided to use these groups in these two contexts to minimize any systematic error when collecting data – meaning we could not measure any difference or systematic error to start with R$ 10,00 or R$ 50, 00.
Board 1 - Data Collection Strategy to minimize systematic errors.
Context 1 Context 2
Action 1
A Constraint Budget context (CB R$ 10,00) was presented and consumers could spend no more than R$ 10,00 to buy all the food
for that day.
A Constraint Budget context (CB R$ 50,00) was presented and consumers could spend no more than R$ 50,00 to buy all the food
for that day.
Action 2
Expanding the Constraint Budget context (CB R$ 50,00), they could spend no more than R$ 50,00 to buy all the food for that
day.
Reducing the Constraint Budget context (CB R$ 10,00), they could spend the presented and consumers could spend no more than R$ 10,00 to buy all the food
for that day.
Source: Authors.
3.4. Data Analysis
We use two kinds of analysis in this investigation. The first one is exploratory data analysis (histogram, box plot, scatterplot, means and variance), which describes the sample results. The normality assumption was evaluated by Kolmogorov-Smirnov’s Test identifying the normal data distribution. The software used in all tests was R 3.2.0 version (www.r-projetc.org).
ANO IV – Volume 1 - Número 1 2017 Artigo The Mann-Whitney’s and Kruskal-Wallis’s tests (p < 0,05) were adopted
here because data did not present a normal statistical distribution. Even these tests are different, for they are simple and efficient when it comes to comparing groups. They have shown the same result here between CB R$ 10,00 and CB R$ 50,00 influencing to Caloric Density by Real Spent. In other words, there is a difference between these groups when we analyze the constraint budget. We tested the same person in both contexts (CB R$ 10; CB R$ 50,00). If there were any statistical caloric amount difference, we could have understood constraint budget impacts on Food Caloric Density by Real Spent.
The last step at Data Analysis was to proceed with the manipulation check. Every experiment should check the manipulation process. When the experiment measures personal perceptions (as studies at Applied Social Science), the survey has to present questions that can measure the perception of manipulation. Despite this, CB R$ 10,00 the mean was R$ 8,86 (sd 0,15) and CB R$ 50,00 was R$ 27,56 (sd 1,31). These values show consumers have perceived the effect of manipulation process in a constraint budget context.
4. Results
This part of our investigation shows our results. We divided this section in three parts being each one the hypothesis’ results of statistical tests done here. As we can see below, H1 was rejected and H2 and H3 were accepted.
4.1. The impact of Constraint Budget at Food Caloric Density per Real Spent
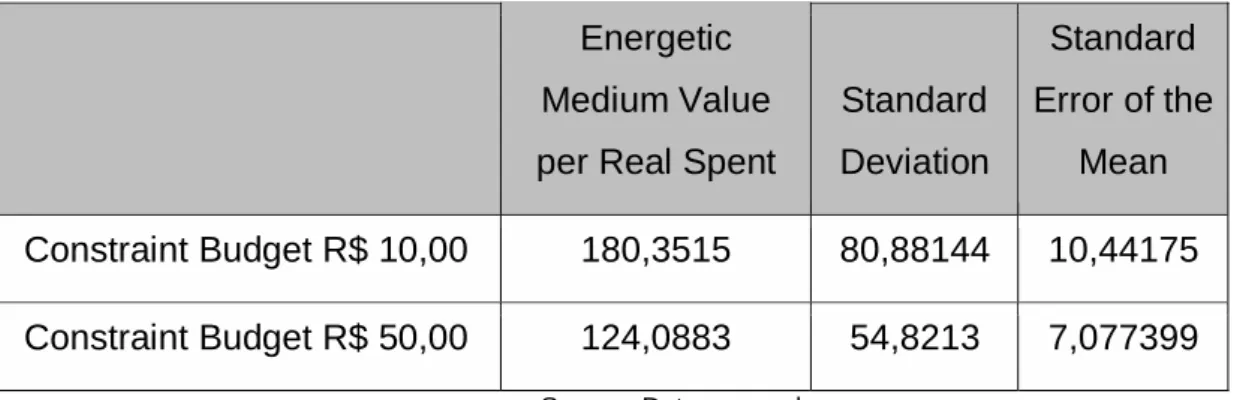
The Energetic Medium Value per Real Spent (EMVRS) shows a difference between groups. Group 1 (R$ 10,00) had a caloric medium value as 180 - meaning each R$ 1,00 spent by any consumer is equivalent to 180 kcal. Group 2 (R$ 50,00) had a caloric medium value as 124 kcal. This mathematical difference is also presented between these groups, and with that, we can affirm this result is statistical if we would test it by Mann-Whitney’s and Kruskal-Wallis’ method.
ANO IV – Volume 1 - Número 1 2017 Artigo Evidencing the statistical difference between these two groups, we tested
them by Man-Whitney and Kruskal-Wallis’ statistical tests assuming the impact of Constraint Budget at Food Caloric Density per Real Spent. The Man-Whitney’s result rejects the null hypotheses (H1) and confirms our initial idea in this experiment (test statistic was 293; p-value 0,0000004757): there is a difference between these groups. To step up this result, we tested H1 by Kruskal-Wallis’ test as well (Q-square - 17,28; p-value 0,000003226), corroborating the Man-Whitney’s results.
Table 1 - Descriptive Measures by Energetic Medium Value per Real Spent
Energetic Medium Value per Real Spent
Standard Deviation Standard Error of the Mean Constraint Budget R$ 10,00 180,3515 80,88144 10,44175 Constraint Budget R$ 50,00 124,0883 54,8213 7,077399
Source: Data research.
These statistical results in this experiment highlight among 60 consumers that there is constraint budget impact at Food Caloric Density per Real Spent – evidencing that the quantity of calories bought by consumers is impacted by their budget constraint. In other words, the lower would be the quantity of money, the higher could be the quantity of calories bought. This result proves our association between constraint budget and hyper caloric consumption.
4.2. Relation among Food Caloric Density per Real Spent, Constraint Budget and BMI
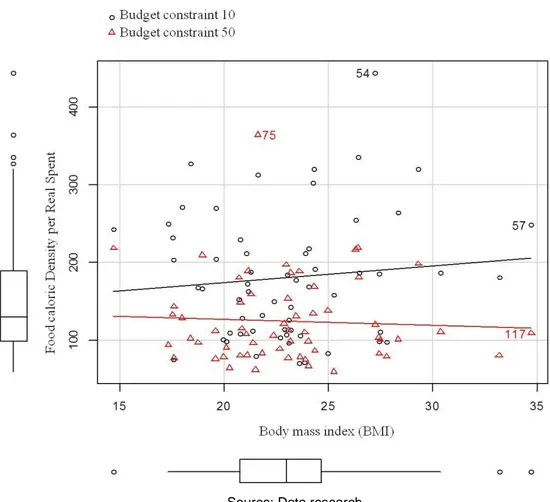
The BMI analyzes fat composition in human body identifying fat and fit mass. The higher is a person’s BMI, the fatter they are, as shows Jackson and Pollock’s Protocol (ROCHA, 2008). As we see in Graphic 1. There is a small inclination at CB 10,00’s straight, showing a positive correlation between BMI and Food Caloric Density per Real Spent FCDRS. Despite the visual information in
ANO IV – Volume 1 - Número 1 2017 Artigo Graphic 1 suggests correlation between these variables, the Pearson correlation
coefficient does not show correlation between BMI and FCDRS. Despite this, we reject H2 in this sample analyzed here.
The result presented above is interesting when we understand personal BMI because of biological, psychosocial, physical, social or food knowledge and attitudes - as we found on obesity’s determinants (JOMORI et al., 2008; CLARO, 2006; EUFIC, 2005). Although we found the impact of Constraint Budget on FCDRS, we do not have statistical evidences in this sample between FCDRS and BMI. It might be clearer analyzing, e.g. (a) daily personal consumer activities - doing exercises at gym; (b) genetic determinants; (c) geographic location - people who live in beach cities could be more body-conscious than non-beach ones; (d) muscle dysmorphic disorder. These arguments (not analyzed in this investigation) help us understanding the rejection of H2.
Graphic 1 - Dispersion Diagram of FCDRS between BMI and Constraint Budget
ANO IV – Volume 1 - Número 1 2017 Artigo 4.3. Personal Income Impacting Food Caloric Density per Real Spent
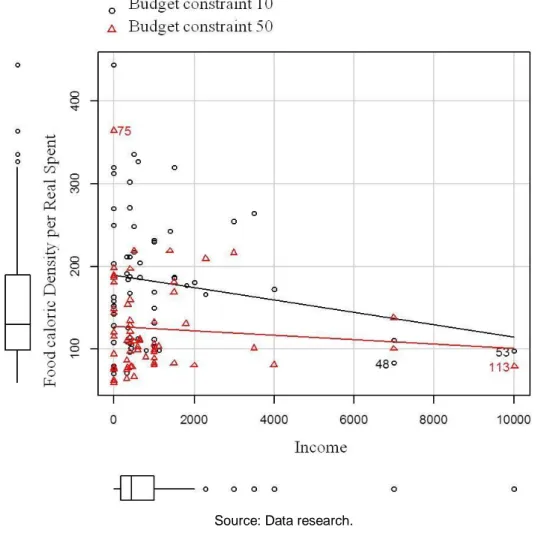
Personal income and Constraint Budget are different variables in this study as we shown before. Analyzing personal income and FCDRS by Pearson Correlation Coefficient we have 0,9097 as p-value (too big in comparison to 0,05). There is no personal income impact on FCDRS (Graphic 2). Despite this, we rejected H3 in this sample. This result reveals an interesting finding because consumers buy hyper caloric products in a constraint budget but does not matter if they have a lower or a higher income. Our findings here suggest constraint budget is more important as a determinant on food liberty choice than personal income - considering the rejection of H3. Understanding the argument, we suggested in this sample, the healthier food choice is not a social or economic choice because food choice depends on financial context in a specific moment.
Graphic 2 - Dispersion Diagram of FCDRS with Personal Income within groups of constraint budget
ANO IV – Volume 1 - Número 1 2017 Artigo Clarifying the argument before mentioned, we present a Brazilian example
involving tourism. Generally, Brazilians traveling abroad are in a good personal (or familiar) income context. Real (Brazilian currency) has no same value as Euro or Dollar, what make an international trip more expensive because this difference. Despite this, too many Brazilian tourists in USA or Europe prefer fast food restaurants because they are cheaper than regular ones. If these people have a good personal income, they would prefer regular restaurants than fast food but they generally are in a constraint budget context traveling abroad. These examples highlight how a constraint budget context might affect a hyper caloric food consumption.
5. Final Remarks
This study intended to discuss the consumer constraint budget and the possibility of this context influence the food consumption decision (hyper or hypo caloric foods). Rejecting null H1 hypothesis (There is no amount of consumed calories by Real spent among groups with Constraint Budget - Group 1 = CB 10; Group 2 = CB 50) we accepted here the difference among groups that evidences an impact of consumer constraint budget on Food Caloric Density per Real Spent. In this sample, we can affirm consumers in a constraint budget context buy hyper caloric products in comparison with other context when they do not have constraint budget. They preferred to buy hyper caloric products than hypo ones (healthier) because the latter are more expensive.
Although we cannot generalize these results in an experiment (CAMPBELL, 1979), the empirical findings highlight the importance to think about Public Policies involving obesity and food consumption in Brazil. It is not our goal to understand the obesity and related diseases, but we keep in mind the possibility to discuss consumption and hyper caloric foods. As we have shown before, the economic factor is just one among six other determinants to obesity (EUFIC, 2005; CLARO, 2006; JOMORI et al., 2008). It might be naive supposing obesity is a result of consumers’ food caloric density, for example.
ANO IV – Volume 1 - Número 1 2017 Artigo Relating our findings to Public Policies, we can start some reflections about
strategies to communicate to citizens how important it is to eat healthier products avoiding future problems involving obesity. If the number of obese people in Brazil increases, we might overcrowd the public health system (SUS) because too many diseases are associated with obesity (others are its reflex).
According to various authors in different countries and areas (Healthy, Psychology or Economic), obesity is a contemporary problem and governments must pay attention to it, by planning public policies. Bonnet et al. (2014) analyzed French consumers during two years and the results show French people eat too much fat and public policies are needed to reduce individual fat consumption. Fan and Jin (2014, p. 125) discussed in their study that USA “knowledge based anti-obesity intervention policies are likely to have limited effects” because obese self-control is the most difficult way to self-control BMI.
Understanding Seiders and Petty (2004)’s argument that food consumption behavior is a key to make public policies related to obesity, our results here become stronger to think hyper caloric consumption and obesity. Despite Brazilian context involving food caloric density consumption, we see two ways related to our findings: (i) education or (ii) tax policy. Regarding education, TV programs like Bem Estar (CRUZ et al., 2015) or campaigns are really effective to discuss hyper caloric food consumption and its results. Schools could encourage children and teenagers to have an organic home gardening, showing them the possibility to have cheaper and healthier foods; or, in a deep and difficult way, change hyper caloric ingredients in cultural plates by healthier ones. Chang and Nayga-Jr (2009) highlight the correlation between children’s TV viewing and fast food consumption - they suggest parents reduce children’s time in front of TV and public policies, which force food industry, make healthy children foods.
In other way, tax policy might be the last and more effective way to minimize the consumption of hyper caloric foods. Obviously, this is a difficult and quarrelsome way, because involves industrial food actors and their interests. Overtaxing manufactured foods might be a solution to minimize future obesity cases at health public system in Brazil. In an opposite direction, the government
ANO IV – Volume 1 - Número 1 2017 Artigo could subsidize healthier or natural products and strategies, which would mix
lower cost and healthier benefits.
About manufactured foods, our findings are going the same direction to Cruz et al. (2015)’s qualitative research: consumers in a constraint budget preferred to buy hyper caloric foods (as cookies, hot dog sausages, burger steak or manufactured lasagnas). All of this kind of products quoted by consumers at Cruz et al.’s investigation was presented here as hyper caloric foods and H1 highlights the consumer decision involving constraint budget.
Other extra interesting finding in this study is the difference between food caloric density consumption between women and men. Although this result was not our goal here, data showed us different behavior between them (Graphic 3): while for women there is a minor relationship between hyper caloric food consumption and budget constraint (straight lower regression), for men this association is sharper (higher straight regression). This suggests that women are more concerned with their choices in the types of food. This result might become interesting if we analyze it by Seiders and Petty (2004)’s argument. If education is the way to plan obesity public policies, women could be an important actor to share information about obesity programs in their family, for example.
ANO IV – Volume 1 - Número 1 2017 Artigo
Graphic 3 - Dispersion Diagram of FCDRS with Gender within groups of constraint budget
Source: Data research.
It is important to highlight we do not intend to show a correlation among constraint budget, hyper caloric consumption and obesity in this study. There are six determinants to food choice as we presented before (JOMORI et al., 2008) and economical determinant is just one of them. We cannot analyze the relation between obesity and budget constraint (it might be a future research) but we can suppose a relation among them, since studies discuss the correlation between hyper caloric diet and obesity (PEREIRA et al., 2003; SNYDER, 2005; QUAIOTI; ALMEIDA, 2006).
Finally, we highlight that the experiment did not allow generalizing results but helped understanding some contexts involving consumer behavior. Our sample was not probabilistic but chosen with higher level of rigor - as showed at methodology section in this paper. Although these results do not represent a
ANO IV – Volume 1 - Número 1 2017 Artigo general consumer behavior, they can help other studies to start reflections about
hyper caloric food consumption, constraint budget and other related topics.
Refferences
AQUINO, Rita de C.; PHILIPPI, Sonia T. Consumo infantil de alimentos industrializados e renda familiar na cidade de São Paulo. Revista de Saúde
Pública. v. 36, n. 6: 655-660, 2002.
BARBOSA, Janine M. et al. Fatores socioeconômicos associados ao excesso de peso em população de baixa renda do Nordeste brasileiro. Archivos
Latinoamericanos de Nutricion. v. 59, n. 1: 22-29, 2009.
BATALHA, Mário L.; LAMBERT, Jean L. Hábitos de consumo alimentar no Brasil: realidade e perspectivas, in: Batalha, M. O., ed., Gestão de agronegócios: textos
selecionados. São Carlos: Editora UFSCar, 2005.
BETING, Joelmir. Feijão ou requeijão?, available at: www.uol.com.br/aprendiz/n_colunas/j_beting/id061000.htm (accessed 26 February 2014).
BONNET, Céline et al. Household food consumption, individual caloric intake and obesity in France. Empire Econ. v. 46, n. 3:1143-1166, 2014.
CAROBA, Daniela C. R., PHILLIPPI, Sonia T.; DA SILVA, Marina V. Participação dos Grupos de Alimentos no Valor Energético Total, nos Domicílios Rurais e Urbanos das Regiões Nordeste e Sudeste do Brasil. Revista Segurança
Alimentar e Nutricional. v. 15, n. 2: 16-31, 2008.
CAMPBELL, Donald T.; STANLEY, Julian C. Delineamentos experimentais e
quase-experimentais de pesquisa. São Paulo: EPU – EDUSP, 1979.
CHANG, Hung-Hao; NAYGA-JR, Rodolfo M. Television viewing, fast-food consumption, and children’s obesity. Contemporary Economic Policy. v. 27, n. 3: 293-307, 2009.
CLARO, Rafael M. Influencia da renda e preço dos alimentos sobre a
participação de frutas, legumes e verduras no consumo alimentar das famílias do município de São Paulo. M.Sc. Universidade de São Paulo, 2006.
COELHO, Alexandre B.; AGUIAR, Danilo R. D. de; FERNANDES, Elaine A. Padrão de consumo de alimentos no Brasil. Revista de Economia e Sociologia
Rural. v. 47, n. 2: 335-362, 2009.
ESTIMA, Camilla de C. P. Por que os adolescentes comem o que comem?
ANO IV – Volume 1 - Número 1 2017 Artigo EUFIC. European Food Information Council. The determinants of food choices.
EUFIC Review. 17: 1-7, 2005.
FAN, Maoyong; JIN, Yanhong. Obesity and Self-control: Food Consumption, Physical Activity, and Weight-loss Intention. Applied Economic Perspectives and
Policy. v. 36, n. 1: 125-145, 2013.
GORGULHO, Bartira M. Alimentação fora do lar e sua relação com a qualidade
de dieta de moradores de São Paulo. D.Sc. Universidade de São Paulo, 2012.
JOMORI, Manuela M.; PROENÇA, Rosana P. da C.; CALVO, Maria C. M. Determinantes de escolha alimentar. Revista de Nutrição. v. 21, n. 1: 63-73, 2008.
KRÜCKEN-PEREIRA, Lia; ABREU, Aline F. de; BOLZAN, Ariovaldo. A necessidade de inovar: um estudo na indústria de alimentos, available at: www.cad.cse.ufsc.br/artigos/07-02.htm (accessed 01 February 2014).
MALHOTRA, Naresh K. Pesquisa de Marketing. Porto Alegre: Bookman, 2001. MADANIEL, Carl and GATES, Roger. 2006. Pesquisa de Marketing. São Paulo: Thomsom.
NG, Marie et al. Global, regional, and national prevalence of overweight and obesity in children and adults during 1980–2013: a systematic analysis for the Global Burden of Disease Study 2013. The Lancet. v. 384, n. 9945:766-781, 2014. PEREIRA, Luciana O.; FRANCISCHI, Rachel P. de; LANCHA-JR, Antonio H. Obesidade: Hábitos Nutricionais, Sedentarismo e Resistência à Insulina. Arq
Bras Endocrinol Metabol. v. 47, n. 2:111-127, 2003.
QUAIOTI, Tereza C. B.; ALMEIDA, Sebastião de S. Determinantes Psicobiológicos do Comportamento Alimentar: uma Ênfase em Fatores Ambientais que Contribuem para a Obesidade. Psicologia USP. v. 17, n. 4:193-211, 2006.
ROCHA, Paulo E. C. P. da. Medidas e Avaliação em Ciências do esporte. Rio de Janeiro: Sprint, 2008.
SEIDERS, Kathleen; PETTY, Ross D. Obesity and the role of food marketing: a policy analysis of issues and remedies. Journal of Public Policy and Marketing. v. 23, n. 2:153-169, 2004.
SILVA, Joselis M. da; PAULA, Nilson M. de. Alterações no padrão de consumo de alimentos no Brasil após o plano real, available at: www.pet-economia.ufpr.br/banco_de_arquivos/00015_artigo_evinvi_Joselis.pdf
ANO IV – Volume 1 - Número 1 2017 Artigo SOUZA, Noa P. P. de; OLIVEIRA, Maria R. M. de. O ambiente como elemento
determinante da obesidade. Revista Simbio-Logias. v. 1, n. 1: 157:173, 2008. SNYDER, Ursula. Obesity and Poverty, available at: www.medscape.com /viewarticle/469027 (accessed 27 May 2013).