Murinometric Evaluations and Feed Efficiency
in Rats from Reduced Litter During Lactation
and Submitted or Not to Swimming Exercise
CIÊNCIAS DO EXERCÍCIO E DO ESPORTE
Original Article
Cybelle da Silva Nery1
Isabeli Lins Pinheiro2
Gisélia de Santana Muniz3
Diogo Antônio Alves de Vasconcelos4
Sabrina Pereira de França5
Elizabeth do Nascimento3
1. Departamento de Fisioterapia-Universidade Federal de Pernambuco-UFPE
2. Núcleo de Educação Física e Desportos - Universidade Federal de Pernambuco - UFPE
3. Departamento de Nutrição-Universidade Federal de Pernambuco- UFPE
4. Instituto de Ciências Biomédicas - Universidade de São Paulo-ICB/USP 5. Centro Acadêmico de
Vitória-Universidade Federal de Pernambuco-CAV/UFPE
Correspondence address:
Elizabeth do Nascimento UFPE/ CCS, Departamento de Nutrição. Av. Prof. Nelson Chaves, S/N – Cidade Universitária – 50760901 – Recife-PE. [email protected]
ABSTRACT
Introduction: Overfeeding in early life can persistently modify consumption and body weight. Adoption of exercise is one useful strategy to prevent excessive weight gain. Objective: to assess body growth and feed efficiency in rats from reduced litters during lactation. Methods: On day 3 of life, litters were formed with 4 (GN4) or 10 animals (GN10) (n = 25). When weaned, Wistar male rats were kept in individual cages and at day 60 (± 2) they were divided into sedentary (SED) and exercised (NAT - swimming), forming thus four groups: GN4SED; GN10SED; GN4NAT and GN10NAT. Assessment consisted of weight, weight gain and specific rate of weight gain, epididymal fat, Body Mass and Lee Indices, consumption and feed efficiency, blood glucose and lactemia. Results: At day 21, GN4 had body weight 52% above GN10 (P = 0.001). However, at days 30 and 60, their weight was not different. At the end of the period, GN10NAT showed lower weight (356.82 ± 23.04) that GN10SED (409.28 ± 17.30), but GN4NAT was heavier (417.85 ± 37.91) than GN4SED (413.69 ± 57.45) and GN10NAT. GN4 presented higher rate of weight gain during lactation, but slower after weaning. Regardless of litter size, rate of weight gain reduces as age progresses. At the end of this period, blood glucose, total and relative epididymal fat, and Lee and BMI indices did not differ between groups. Pre and post-exercise lactate values are consistent with moderate effort. In periadolescence, GN4 showed lower food intake, but with no differences in adulthood. Conclusion: Reduced litter during lactation did not affect body weight or food intake persistently. However, the swimming protocol was effective in reducing weight gain in control animals, but not in animals from reduced litters.
Keywords: anthropometry, physical activity, food intake, rat pups.
INTRODUCTION
The correlation between nutrition in perinatal period and continuation in adulthood has been reported by several researchers (1-4). In 1960, Widdowson and McCance(1) demonstrated that the size of adult rats was
related to their nutritional status in the lactation period. Studies have demonstrated that there is a reverse relation between size of the litter and the body mass mean at weaning. One of the experimental models proposed to introduce overfeeding, subsequent weight increase and hyperphagia in adulthood is the re-duction of the litter size at birth (2-4).
Overfeeding induction with rat litters composed of three pups early detected increase of body weight, hyperglycemia, hyperinsulinemia with insulin resistance and alterations in hypothalamic structures of food control (2).
The hypothesis of overfeeding during lactation is supported by the fact that the neonate rat does not seem to have control over this ingestion until the 14th-16th day of postnatal life (3). Thus, when there is high
offer of milk the pups ingest the maximum volume of their gastrointestinal tract capacity(5). This excessive
ingestion may lead the animal to hyperfeeding, since the hypothalamic control in the beginning of the postnatal life is not totally structured yet (6). Thus, induction of excessive perinatal feeding has been related
to the installation of surplusweight as well as hyperphagia in adulthood (2).
However, permanent weight or adipose mass increase by this method is still controversial among studies. Wurtman and Miller(4) did not find differences in adipose mass or body weight in animals aged 21 or 58
days from litters with two, four, eight or 12 pups in lactation. However, in mice, Epstein(7) found differences
in growth and body weight velocity at weaning when the litters were composed of four and six animals compared to the control with eight animals.
Another environmental stimulus which can interfere in total weight gain (8), in body mass distribution (9)
or localized fat (10) and also in food intake r(11) is the performance of physical exercise. In humans, the results
generated by regular physical activity initiated in childhood play favorable roles in the organism during the growth period as well as adulthood (12). Nevertheless, the benefits of physical exercise to health are
50
can be light, moderate or intense, from physiological parameters such as maximum heart rate (HRmax), oxygen maximal uptake (VO2max) in
response to the effort test and blood lactate concentrations (13).
Within this context, the application of an extrinsic stimulus in animals which may have received excessive feeding at life beginning seems to be interesting. Thus, there is the hypothesis that reduction in litter persistently increases body weight, anthropometric indices and food consumption of young adult rats, and that moderate physical exercise would minimize such alterations. Therefore, the study proposed to assess the body growth as well as feeding efficiency of rats derived from reduced litters at lactation and that were submitted or not to chronic swimming exercise during adolescence.
METHODS
Animals and experimental conditions
25 Wistar male rats, derived from the breeding colony of the Nutri-tion Department of the Federal University of Pernambuco were used. At the third postnatal Day, the litters were manipulated to 10 (control, n = 13) or four animals (reduced, n = 12). During lactation, each litter remained with the number of animals set. Had the number of males been insufficient, the litter was completed with females during lac-tation. After weaning, the males were kept in individual cages and received water and commercial food by Labina® (standard show from the animal facility, provided by Purina of Brazil), ad libitum during the entire experiment. The animals were kept at temperature of 22 ± 1oC
and 12-hour light/dark cycle (light: from 6 to 18h; dark: from 18 to 6h). From the age of 60 days (± 2) the animals were subdivided in sedentary (SED) and exercised (NAT- swimming), making four groups: GN4SED and GN10SED (came from non-exercised litters with four and 10 animals, respectively) and GN4NAT and GN10NAT (came from exercised litters with four and 10 animals, respectively). The study was approved by the Ethics in Animal Experimentation Committee from the Center of Bio-logical Sciences of the Federal University of Pernambuco (CEEA-UFPE), document number 28/07 and file number 003918/2007-15.
Physical exercise
The exercised group was initially familiarized with the water envi-ronment during the first week, starting with Five minutes and adding 10 minutes per day until completion of 45 minutes/day. Water temperature was kept at about 31ºC (± 1°C). The aim of the familiarization was to reduce the animal’s stress, adapting it to the water environment. From week two to seven, the animals freely exercised 45 minutes/day, three times per week. The control group remained during the same period of the exercised in container with water with no swimming performance. This procedure had the aim to equal the water stress.
Assessed parameters
Body weight and length – weight was checked from the third postnatal day until weaning, with interval of every three days, and at 30, 60 and 110 days of life. Weight gain (Final weight – Initial weight) was calculated in the days of life 3-21; 21-30; 30-60 and 60-110 inter-vals. An electronic digital scale by Marte (model ASF11), maximum capacity of 500g and minimum of 0.002g was used for measurement. Naso-anal length was performed at the end of the experiment, after the animal had been anesthetized and measurements were recorded on millimeter paper.
Lee index – Calculated at the end of the experiment, from the ratio between the cubic root of body weigth and the nasoanal length of the animal [3√Weight (g)/NAL(cm)] (14).
Body mass index (BMI) and Specific rate of weight gain (g/kg) – are, respectively, determined from the ratio between body weight (g)/nasoanal lenght (cm2)(14) and the ratio between: dM/Mdt(14), where
dM represents body weight gain during dt (t2-t1) and M is the body weight of rats in t1 (initial date of the period). This variable was assessed at 3-21; 21-30; 30-60 and 60-110 days of life.
Food consumption – it was followed in the periadolescence (befo-re the age of 60 days), from 45 to 55 days and in adolescence, from 70 to 110 days of life, when some animals already performed swimming exercise. Its calculation was obtained by the daily subtraction between the food quota offered and the leftovers from the subsequent day.
Feeding efficiency – it was measured by the coefficient of feeding efficiency (CFE) and the weight gain per caloric consumption (WGCC). From 45 to 55 days and from 70 to 110 days of life the animals were weighted and the CFE quantified according to the food intake (15) and
the WGCC according to the caloric intake for each group.
The coefficient of feeding efficiency os the ratio between weight gain per amount of food ingested: CFE = (FW – IW) / TA
Where FW: final weight (g) of the animal during the follow-up pe-riod; IW: initial body weight of the animal in grams, TA: total amount of ingested food in the period in grams.
Weight gain per caloric consumption: WGCC = (FW-IW) / kcal ingested Where FW: final body weight (g) of the animal during the period, IW: initial body weight of the animal (g) for the experiment; Kcal: caloric value of the diet ingested.
Glycemia – At the end of the experiment, the animals were kept at 15-hour fasting for determination of glycemia. Bloos samples were obtained from a small incision on the anima’s tail and stored on bands specific for reading in Accutrend GC machine®.
Epididymal fat – At the end of the experiment, from 24 to 48 hours after the end of the exercise, the animals were anesthetized with urethane at 12.5% and chloralose at 0.5% and opened by the peritoneal region to allow exposure and removal of the epididymal adipose tissue(16). After total removal, fat was immediately weighted
on an electronical scale, Marte (model ASF11).
Lactemia – Blood samples were collected in intercalated weeks of the experiment before and immediately after physical exercise, from a small incision on the animal’s tail and placed on reading bands spe-cific with subsequent reading of the results in a Accutrend Lactato® machine.
Statistical analysis
Data were fed to Excel program and subsequently assessed in the SigmaStatv3.1 and GraphPad Prisma v4.0 programs for Windows. The Student’s t test or Mann-Whitney test according to data equivalence and normality was used for comparison between two samples. Analysis of variance (ANOVA), according to the effects of the tested factors (one way or two way) and repeated measures (ANOVA RM) for parametric data was applied for comparison among three or more groups. Whene-ver ANOVA revealed significance, the Holm-Sidak test was used in order to identify which groups were different from each other. The Kruskal-Wallis test, followed by the Dunn’s test was used for non-parametric data. Statistical significance established was of p < 0.05.
RESULTS
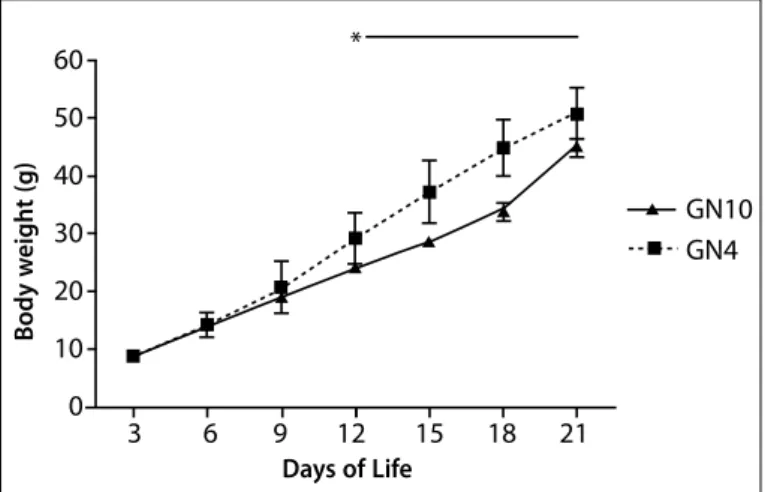
The ponderal evolution of animals from litters with four or 10 pups during lactation reveals that, from the 12th day of life, group GN4
during the period was 52% higher than in the control group [GN4 = 483.29 (53.22); GN10 = 431.69 (54.84) p = 0.033].
The absence of weight difference between sedentary groups at 30, 60 and 110 days is corroborated by the lower weight gain velocity of the respective periods. In the exercised groups, it was observed that GN10NAT presents lower weight at 110 days of life (figure 2). These results were corroborated by the lower specific rate of weight gain of 21 to 30 days (table 1) in group GN4-SED (8.19 ± 1.16) compared to group GN10-SED (9.72 ± 1.18) (p = 0.007) and absence of difference from 30 to 60 days of life, as well as the lower velocity of group GN10NAT from 60th to 110th days of life.
After the swimming inclusion, it was observed that GN4NAT pre-sented higher weight gain than GN10NAT as well as higher gain velo-city compared to GN4SED. However, in group GN10-NAT the opposite situation is observed compared to its sedentary pair.
In the evaluation of the specific rate of weight gain or velocity of weight gain reduction is observed with age increase regardless of the manipulation of the litter size during lactation, since no inter-group differences were found (figure 3).
The performance of anthropometric measurements revealed shor-ter nasoanal length in group GN10NAT and no difference in the
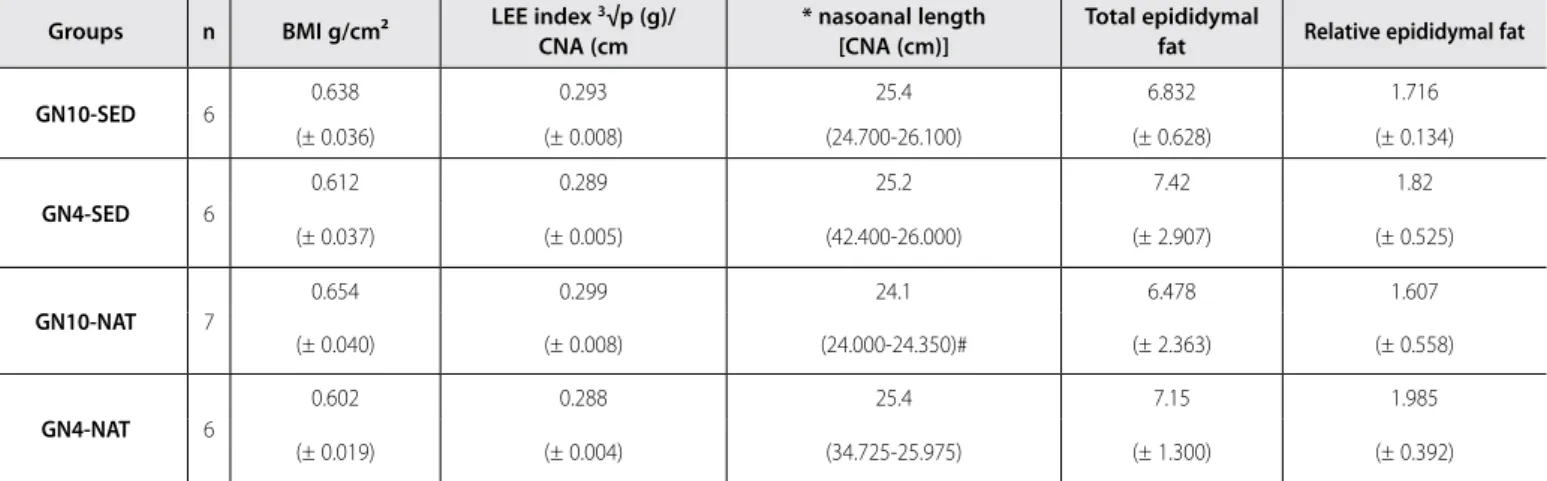
remai-ning measurements. The total and relative amount of epididymal fat (visceral) did not present differences either (Table 2).
The study of the correlation (Pearson coefficient correlation) between indices (BMI and Lee) revealed positive and significant association
betwe-Figure 1. Ponderal evolution of litters manipulated concerning the number of pups during lactation (n = 25). GN4 = litter of four animals during lactation; GN10 = litter with 10 animals during lactation. *Indicates significance of GN4 compared to GN10 (p = 0.001). (two-way ANOVA RM).
Figure 2. Effect of the litter size in lactation and of swimming on the body weight of young Wistar rats (n = 25). GN4SED = litter of four animals in lactation and sedentary; GN10SED = litter of 10 animals in lactation and sedentary; GN4NAT = litter of four animals in lactation and swimmers; GN10NAT = litter of 10 animals in lactation and swimmers.
*Difference concerning GN10SED and GN4NAT; ξ difference concerning GN10 NAT (p
< 0.05). (two-way ANOVA RM).
Tabela 1. Ganho de peso corporal (g) e taxa específica de ganho de peso (g/kg) em ratos Wistar segundo a redução da ninhada no aleitamento e natação na idade jovem (p < 0.05); (n = 25).
Groups
Weight gain (g) Speciic rate of weight gain (g/kg)
3-21 days 30-60 days 60-110 days 3-21 days 21-30 days 30-60 days 60-110 days GN10-SED 36.79 (± 2.24) 187.44 (± 12.96) 131.78 (±14.95) 77.7 (± 9.87) 9.72 (± 1.18) 64.67 (± 14.59) 23.78 (± 2.92) GN4-SED 42.03* (± 3.53) 191.24 (± 20.73) 133.85 (± 31.87) 86.99* (± 9.58) 8.19* (± 1.16) 76.16 (± 13.91) 23.75 (± 4.15)
GN10-NAT – – 81.77*
(± 33.17) – –
16.29* (± 5.16)
GN4-NAT – – 138.75 # – – 24.75*
(± 21.42) (± 2.62)
*Significância em relação ao GN10SED; #diferença em relação ao GN10NAT.
Figure 3. Effect of age and litter manipulation during lactation on the specific rate of weight gain (g/kg). n = 25, p = 0.05. GN4SED = litter of four animals in lactation; GN10SED = litter of 10 animals in lactation..
en them (figure 4). Such fact denotes that both can be used as determi-nant of body mass and act as predictor of surplus weight in rats.
The effects of the manipulation of the litter size or the swimming exercise over the food consumption and feeding efficiency are presented in table 3. In the periadolescence period (before the age of 60 days), group GN4 demonstrated lower food intake (absolute and relative) than group GN10. However, no inter-group difference was seen in the coefficients of feeding efficiency (CFE) or weight gain per calory (WGCC) in the 45-55 days and 70 to 110 days of life. The effect of the manipulation of the litter size in lactation and/or of swimming exercise over the fasting glycemic values and lactemia presented in table 4 did not reveal differences in the glycemic values nor in the intra-group lactate values before and imme-diately after the end of the exercise.
60 50 40 30 20 10 0
3 6 9 12 15 18 21
GN10 GN4 P e so c o rp o ra l ( g )
Dias de Vida * B ody w eigh t (g)
Days of Life
30 60 110
GN10 SED GN4 SED GN10 NAT GN4 NAT P e so c o rp o ra l ( g )
Dias de Vida
* 450 400 350 300 250 200 150 100 50 0 ξ B ody w eigh t (g)
Days of Life
150
100
50
0
6-30 30-60 60-110 GN10 SED GN4 SED
Taxa específica de ganho de peso (g/kg)
52
Table 2. Effect of litter reduction in lactation and of swimming on murinometric parameters and visceral fat in young adult Wistar rats (one-way ANOVA).
Groups n BMI g/cm² LEE index 3√p (g)/
CNA (cm
* nasoanal length [CNA (cm)]
Total epididymal
fat Relative epididymal fat
GN10-SED 6 0.638 0.293 25.4 6.832 1.716
(± 0.036) (± 0.008) (24.700-26.100) (± 0.628) (± 0.134)
GN4-SED 6
0.612 0.289 25.2 7.42 1.82
(± 0.037) (± 0.005) (42.400-26.000) (± 2.907) (± 0.525)
GN10-NAT 7
0.654 0.299 24.1 6.478 1.607
(± 0.040) (± 0.008) (24.000-24.350)# (± 2.363) (± 0.558)
GN4-NAT 6
0.602 0.288 25.4 7.15 1.985
(± 0.019) (± 0.004) (34.725-25.975) (± 1.300) (± 0.392)
Lee = 3√weight (g)/CNA(cm) *Data in median; #difference between the remaining groups.
Figure 4. Study of the correlation between body mass index (BMI and Lee index of young Wistar rats (n = 25). Person correlation test (p = 0.001).
0.325 0.320 0.315 0.310 0.305 0.300 0.295 0.290 0.285 0.280 0.275 0.270
Indice de L
ee (g/cm�)
���� ���� ���� ���� ���� ����
IMC (g/cm�)r= 0.895
p=0.001
Table 3. Effect of the litter size as well as swimming on the food consumption, the coefficient of feeding efficiency and the coefficient of weight gain by caloric consumption in the periadolescence period (45 to 55 days) and in young adult rats (70-110 days), (Student’s t test and one-way ANOVA). *Dfiference concerning GN10SED.
Groups n
Period: 45 -55 days Period: 70-100 days
Food consumption
CFE WGCC n Food consumption CFE WGCC
Absolute Relativo
GN10-SED 13
23.73 10.79 0.19 0.05 6 27.38 0.11 0.03
(± 1.69) (± 1.26) (± 0.05) (± 0.01) (± 1.73) (± 0.03) (± 0.15
GN4-SED 12
21.1 9.04 0.21 0.06
6
29.48 0.08 0.02
(± 1.75)* (± 1.61)* (± 0.05) (± 0.01 (± 5.69) (± 0.01) (± 0.00)
GN10-NAT – – – – – 7
26.84 0.1 0.03
(± 1.50) (± 0.00) (± 0.00)
GN4-NAT – – – – – 6
29 0.08 0.02
(± 4.22) (± 0.02) (± 0.00)
Table 4. Values of Lactemia (mmol/L) and glycemia (mg/dL) ar test and of lactemia immediately after the end of swimming in griuops manipulated concerning the size of the litter during lactation and exercise at young age (p < 0.05). N = 25 animals. One-way Anova and paired t test (p < 0.05).
Groups N Fasting
glyce-mia (X ± SD)
Lactate (X ± SD)
Before exercise After exercise
GN10 SED 6 108.44 (±
28.57) – –
GN4 SED 6 99.00 (± 17.07) – –
GN10 NAT 7 92.11 (± 34.43) 3.07 (± 0.51) 3.53 (± 0.47)
GN4 NAT 6 115.00 (±
14.30) 2.77 (± 0.36) 2.83 (± 0.94)
Lee
inde
x
DISCUSSION
An interesting finding of the study refers to higher body weight at weaning presented by the animals of reduced litter compared to the control. The reduction of the number of pups from the third Day of life seem to affect the higher availability of milk from the mother, higher food consumption of the pups and early induction of surplus weight in the pups(17). This higher offer is associated with the initial adjustment
of the synthesis of mother’s milk due to the number of pups born (18).
Consequently, there will be probably higher food intake coherent to the immaturity of the control mechanism of food intake of the pups this age, resulting in higher body weight gain (3).
Our results at 21 days, concerning body weight, are similar to the ones found in a previous study (19) which used similar methodology.
Assessment of the specific rate of body mass gain in the group with reduced litter in this period supports our findings. Differently, Wurtman and Miller(4), when manipulated Sprague-Dowley litters with two, four,
eight, 12 and 16 animals, did not demonstrate differences in body weight at 21 days between litters from two to 12 animals. The lack of difference in this study may be due to the moment of manipulation of the litter, which occurred 6h after birth. According to the literature, in this period adjustment of the milk amount according to the number of pups born has not occurred yet and the production will tend to adapt to the total of pups present in the litter (18).
As age progresses, the body weight differences at 30 to 60 days of life will disappear. The absence of significance was corroborated by the lower velocity in weight gain observed post-weaning (21 days) at 30th
day of life in group GN4 compared to the control and its insignificance in the 30 to 60 days of life period. Wurtman and Miller(4) performed
litter manipulation during lactation and did nor detect difference in body weight at 58th day(4). Our findings corroborate these studies and
differ from the hypothesis that litter reduction during lactation causes persistent alteration in body weight.
Inclusion of exercises after the age of 60 days promoted lower wei-ght gain and lower body weiwei-ght at the end of the period in GN10NAT. It is a consensus that regular exercise practice, especially of aerobic predo-minance, is able to alter body composition causing higher mobilization of the lipid storage, probably in order to preserve lean mass (9). Silveira
et al.(20) state that in response to physical training, increase of lean
mass and reduction of fat mass, with increased fatty acids absorption by the exercised tissue occur. Studies have shown that exercising can also increase the brown adipose tissue(21), contributing to the increase
of thermogenesis and reduction of total body weight.
The same situation was not observed concerning the reduced litter, Group GN4NAT did not preset lower body weight at the end of the exercise period. In this group, an inverse process of the control group may have occurred. That is to say, the lean mass gain was not counter-balanced by the fat mass loss or greater mobilization. Since we do not have results about the body composition of these animals, we suggest further studies which can be able to verify the proportion of lean and fat mass in animals exercised according to the adopted protocol.
Several studies in the literature which used different swimming pro-tocols with no litter manipulation obtained, in their majority, reduction in weight gain in the exercised animals. Adolescent rats or at young age, which performed swimming exercise, either interval or continuous, three to five times per week, with overload between 2 and 5% of body weight, regardless of the kind of used diet, observed reduced weight
gain in the exercised groups compared to their sedentary pairs (10, 21).
Although the findings are not excluding, these differences may be attributed to the experimental outlining (overload duration, frequency and/or nutritional manipulation).
Previous nutritional manipulation, exercise volume, frequency, in-tensity and duration may reflect on distinct results on the metabolism, body composition and use of energetic substrates. The presence of litter manipulation during lactation plus swimming at young age in a single experimental outlining caused difficulty in confronting our results with similar studies. However, it can be hypothesized that the used swimming protocol did not have the same effect on body weight or weight gain in the groups manipulated during perinatal life. There-fore, it is possible that the effect of neonatal nutritional manipulation causes distinct physiometabolic alterations and that its association with exercise requires further and deeper investigations.
Nevertheless, regardless of the litter size, it is evident that the wei-ght gain and consequently the ponderal evolution, reduces with age progression. Similar results were seen in the investigations by Novelli et al.(14) where the authors followed this decline until the age of 150
days of life. Regarding the prediction indices of surplus weight (Lee nd BMI) no differences have been found between groups. According to Bernardis and Patterson(22), the Lee index higher than 0.3 can be
used as indicator of body fat excess. However, none of our groups demonstrated values above 0.3. Similarly, Novelli et al.(14) state that the
BMI can also be used as an assessment instrument of body fat in rats, as well as an indicator of lipid alterations.
Concerning total and relative epididymal fat, either between groups with number of pups manipulated during lactation or among those which performed swimming, no differences have been identified. The determination of the visceral fat in animals has received importance due to its association with metabolic and biochemical alterations as well as increase in risk of chronic diseases onset (8). The literature states
that rats submitted to swimming exercise presented lower amount of epididymal fat and total visceral fat than their sedentary pairs (10,21) while
adult rats exercised five times per week during 50 minutes for a period of five weeks do not present differences in amount of epididymal fat compared to the sedentary group (23).
Basset and Craig(24) demonstrated differences in the number of
adipocyte cells found in the epididymal fat in animals with 80 days of age while the litters were reduced to four pups during lactation; ho-wever, differences in total weight have not been reported. It is possible that the differences in amount of epididymal fat between the studies are due to the used exercise protocol, since the great majority of the studies used overload related to the body weight or greater activity volume. Concerning the relative fat, Zambon et al.(10) verified in
exer-cised animals lower epididymal and retroperitoneal adiposity than in sedentary animals. However, similarly to our findings, Moura et al.(25) did
not find difference in retroperitoneal fat of animals fed with diet rich in fructose during the post-weaning period until 90 days of life.
Regarding control of food consumption, it is observed that it was reduced in animals from litters of four pups during lactation in the pe-riadolescence period. From 70 to 100 days of life, difference in the food intake or coefficient concerning the number of pups during lactation or the used exercise protocol have not been observed.
54
tation though, the opposite was not verified in the assessed periods. The biochemical readings do not reveal differences in fasting glyce-mia between groups. Silveira et al.(30), when assessed the effect of
ae-robic training during four weeks with five weekly sessions of 1h each, did not verify alteration in glycemia or post-exercise muscle glycogen, but in hepatic glycogen and serum concentration of free fatty acids instead. Possibly, lower use of glucose occurs with the exercise increase for increase of lipid mobilization and oxidation, keeping the glycemic homeostasis. However, Bernardes et al.(21), when submitted animals to
hypercaloric/hyperlipidic diet associated with swimming training for eight weeks, 90minday and five days/week, observed 100% of increa-se in glycemia of theincrea-se animals when compared to the normocaloric group. It was concluded hence that the positive effects of exercise on the metabolism of lipids and carbohydrates are harmed by the offer of a hypercaloric diet.
FINAL CONSIDERATIONS
Reduction in the number of pups in lactation did not cause per-sistent surplus weight in the litter neither did it alter the food intake and central fat accumulation in the young adult animals. However, superfeeding induction during lactation seems to promote alteration in growth in the post-weaning period opposite to what was observed in animals which suffer perinatal malnutrition. This finding is important when we observe that the greatest growth period of the animal oc-curs before 60 days of age and that until 30 days this velocity is very remarkable. On the other hand, free swimming exercise performed only three times per week does not seem to induce to great alterations in body composition of the animals, which suggests the performance of further studies which confirm or refute the findings of this model, or even perform measurements of other parameters which are able to clarify such findings.
Finally, we consider that the alteration in availability of amount and/or food quality during lactation deserves further investigation due to the vulnerability of this period to environmental and nutritional in-fluences which can predispose to increase of adipose tissue, as well as permanent metabolic alterations.
All authors have declared there is not any potential conflict of in-terests concerning this article.
with the lower food intake observed in the animals in the periadoles-cence period, before the beginning of the exercise. Conversely, animals which suffer malnutrition in the perinatal period tend to increase food intake with fast weight gain at this age, characterizing this process as catch-up growth (growth catch-up or rapid weight gain). In rats pre-viously malnurtured, Santhiago et al.(23) observed higher food intake
at this age. In this study, the animals were submitted to hypoprotein diet from 21 until 60 days of life. The malnurtured animals presented food intake significantly higher (22. ± 4.09) than its control (17.4 ± 4.11) at the end of the observed period. These phenomena, known as natal catch-down and catch-up refer to the alteration in post-natal adipose mass.
Appetite increase in rats submitted to exercise is not a consensus in the literature. In this study differences between exercised and sedentary groups were not observed. Our results are similar to the ones by Bernar-des et al.(21) who have not observed differences in food consumption
of exercised and sedentary rats either. Nonetheless, they were different from those which performed any kind of lipid or calorie increase, whose food consumption may be increased (10) or reduced (26).
When rats were submitted to exercise of high intensity, Lewis et al.(27) observed increase of hipothalamic expression of Y neuropeptides,
an important orexigenic component of food intake. However, it is ad-vocated that moderate exercise causes higher release of anorexigenic hormones such as leptin and insulin and that these can have their activity boosted during an acute exercise session, promoting decrease in appetite (28). Therefore, exercise peculiarities, such as effort intensity,
can play distinct metabolic effects on the appetite regulator center or even hormonal influences, considering the effects mentioned above.
Differences in the coefficient of feeding efficiency or weight gain by caloric consumption have not been verified either. These coeffi-cients assess the capacity of the animal to lose or gain weight when submitted to different diets (global or specific analysis of nutrients) or even concerning some previous environmental manipulation, which may lead to alteration of metabolic efficiency. In malnurtured animals in perinatal life, Prazeres et al.(29) found lower coefficient of feeding
efficiency in young animals from 40 to 105 days. Considering the facts hence, it seems that nutritional need leads to subsequent reducntion in feeding efficiency. In our superfeeding induction model during
lac-REFERENCES
Widdowson E, McCance RA. Some effects of accelerating growth. I. General somatic development. 1.
Proc Roy Soc (Biol.) 1960;152:188-206.
Plagemann A, Rake A, Harder T, Melchior K, Rhode W, Dorner G. Reduction of cholecystokinin-8s-2.
neurons in the paraventricular hypothalamic nucleus of neonatally overdeed weanling rats. Neurosci Letters 1998;258:13-6.
McMillen IC, Adam CL, Mühlhäusler BS. Early origins of obesity: programming the appetite regulatory 3.
system. J Physiol 2005;565:9-17.
Wurtman JJ, Miller SA. Effect of litter size on weight gain in rats. J Nutr 1976;106:697-701. 4.
Houpt KA, Epstein AN. Ontogeny of controls of food intake in the rat: GI fill and glucoprivation. Am 5.
J Physiol 1973;225:58-66.
Pozzo Miller LD, Aoki A. Postnatal development of the hypothalamic ventromedial nucleus: neurons 6.
and synapses. Cell Mol Neurobiol 1992;12:121-9.
Epstein HT. The Effect of Litter Size on Weight Gain in Mice. J Nutr 1978;108:120-3. 7.
Estadella D, Oyama LM, Dâmaso AR, Ribeiro EB, Oller do Nascimento CM. Effect of palatable hyperlipidic 8.
diet on lipid metabolism of sedentary and exercised rats. Nutrition 2004;20:218-24.
Oscai LB, Holloszy JO. Effects of Weight Changes Produced by Exercise, Food Restriction, or Overeating 9.
on Body Composition. The J Clin Invest 1969;48:2124-8.
Zambon L, Duarte FO, Freitas LF, Scarmagnani FRR, Dâmaso A, Duarte ACGO, et al. Efeitos de dois 10.
tipos de treinamento de natação sobre a adiposidade e o perfil lipídico de ratos obesos exógenos. Rev Nutr 2009;22:707-15.
Santhiago V, da Silva ASR, Gobatto CA, de Mello MAR. Treinamento físico durante a recuperação 11.
nutricional não afeta o metabolismo muscular da glicose de ratos. Rev Bras Med Esporte [online] 2006;12:76-80.
Malina RM. Physical activity, growth, and functional capacity. In: Johnton FE, Roche AF, Susanne C. (Eds.) 12.
Human physical growth and maturation: methodologies and factors. New York, Plenum Press, 1980.
Leandro CG, Manhaes de Castro R, Nascimento E, Pithon-Curi TC, Curi R. Mecanismos adaptativos do 13.
sistema imunológico em resposta ao treinamento físico. Rev Bras Med Esporte 2007;13:343-8.
Novelli ELB, Diniz YS, Galhardi CM, Ebaid GMX, Rodrigues HG, Mani F, et al. Anthropometrical parameters 14.
and markers of obesity in rats. Lab Anim 2007;41:111-9.
Campbell JA. Method for determination of PER and NPR. In: FOOD and nutrition board. Committee 15.
on Protein Quality. Evaluation of Protein Quality 1963;31-2.
Figueiró-Filho EA, Duarte G, El Beitune P, Quintana SM, Marcolin AC. Efeito diabetogênico das drogas 16.
anti-retrovirais em ratas Wistar prenhes. Rev Bras Ginecol Obstet 2004;26:31-6.
Plagemann A, Harder T, Rake A, Voits M, Fink H, Rohde W, et al. Perinatal elevation of hypothalamic 17.
Davidowa H, Plagemann A. Inhibition by insulin of hypothalamic VMN neurons in rats overweight due 18.
to postnatal overfeeding. Neuroreport 2001;12:3201-4.
Xiao XQ, Williams SM, Grayson EB, Glavas MM, Cowley MA, Smith MS, et al. Excess weight gain dur-19.
ing the early postnatal period is associated with permanent reprogramming of brow adipose tissue adaptive thermogenesis. Endocrinology 2007;148:4150-9.
Silveira LR, Fiamoncini J, Hirabara SM, Procopio J, Cambiaghi TD, et al. Updating the effects of fatty 20.
acids on skeletal muscle. J Cell Physiol 2008;217:1-12.
Bernardes D, Manzone MSJ, Souza CP, Tenório N, Dâmaso AR. Efeitos da dieta hiperlipídica e do 21.
treinamento de natação sobre o metabolismo de recuperação ao exercício em ratos. Rev Bras Educ Fís Esp 2004;18:191-200.
Bernardis LL, Patterson BD. Correlation between ‘Lee index’ and carcass fat content in weanling and 22.
adult female rats with hypothalamic lesions. J Endocrinol 1968;40:527-8.
Santhiago V, da Silva ASR, Voltarelli FA, Pauli JR, Romero CEM, Ferreira L, et al. Respostas fisiológicas 23.
em ratos wistar submetidos ao estresse térmico durante treinamento aeróbio de natação. Ciên Agr Saúde 2006;6:7-14.
Basset DR, Craig BW. Influence of early nutrition on growth and adipose tissue characteristics in male 24.
and female rats. J Appl Physiol 1988;64:1249-56.
Moura RF, Cambri LT, Quadros Junior AC, Nascimento CMC, Arantes LM, Sebastião E, et al. Capacidade 25.
aeróbia de ratos alimentados com dieta rica em frutose. Rev Bras Med Esporte 2008;14:422-6.
Franco LD. Dieta hiperlipídica e exercício físico: conseqüências sobre o metabolismo e a peroxidação 26.
lipídica – Estudo em modelo animal. 2007. 107 f. Dissertação (Mestrado em Alimentos e Nutrição) – Faculdade de Ciências Farmacêuticas – Universidade Estadual Paulista, São Paulo.
Lewis EJ, Hunsicker LG, Bain RP, Rohde RD. The effect of angiotensin-converting-enzyme inhibition on 27.
diabetic nephropathy. N Engl J Med 1993;329:1456-62.
Flores MBS, Fernandes MF, Ropelle E, Faria MC, Ueno M, Velloso LA, et al. Exercise improves insulin and 28.
leptin sensitivity in hypothalamus of wistar rats. Diabetes 2006;55:2254-61.
Prazeres FG, Pessoa DCNP, Bion FM, Arnauld TMS. Exercício Físico, Crescimento e Desenvolvimento: 29.
Estudo em ratos jovens desnutridos pela dieta básica regional (DBR) e recuperados nutricionalmente. Rev Bras Educ Fis Esp 2004;18:7-16.
Silveira RF, Leme JACA, Manchado FB, Lopes AG, Hirayama MS, Garcia DR, et al. Utilização de substratos 30.