Applicability of the “Frame of Reference” approach for environmental monitoring of
offshore renewable energy projects
Erwan Garela,∗, Cibran Camba Reyb, ´Oscar Ferreiraa, Mark van Koningsveldc,d
aCentre for Marine and Environmental Research (CIMA), Algarve University, Edifcio 7, Campus de Gambelas, 8005 - 139 Faro, Portugal bAcciona Energa S.A. Avda. Ciudad de la Innovacin 5, 31621 Sarriguren, Spain
cVan Oord Dredging and Marine Contractors B.V., P.O. Box 8574, 3009 AN, Rotterdam, The Netherlands
dDelft University of Technology, Faculty of Civil Engineering and Geosciences, P.O. Box 5048, 2600 GA, Delft, The Netherlands
Abstract
This paper assesses the applicability of the Frame of Reference (FoR) approach for the environmental monitoring of large-scale offshore Marine Renewable Energy (MRE) projects. The focus is on projects harvesting energy from winds, waves and currents. Environmental concerns induced byMREprojects are reported based on a classification scheme identifying stressors, receptors, effects and impacts. Although the potential effects of stressors on most receptors are identified, there are large knowledge gaps regarding the corresponding (positive and negative) impacts. In that context, the development of offshoreMRErequires the implementation of fit-for-purpose monitoring activities aimed at environmental protection and knowledge development. Taking European legislation as an example, it is suggested to adopt standardized monitoring protocols for the enhanced usage and utility of environmental indicators. Towards this objective, the use of the FoR approach is advocated since it provides guidance for the definition and use of coherent set of environmental state indicators. After a description of this framework, various examples of applications are provided considering a virtual MREproject located in European waters. Finally, some conclusions and recommendations are provided for the successful implementation of the FoRapproach and for future studies.
Keywords: marine renewable energy; large-scale projects; environmental monitoring; environmental indicators; monit-oring framework; frame of reference
1. Introduction
1
Offshore winds, waves and currents have a large
poten-2
tial for long-term electricity generation world wide (Pelc
3
and Fujita, 2002;Thresher and Musial, 2010). The wind
4
industry is leading the way, whilst devices to harvest
off-5
shore wave and current energy are still under development
6
(Sutherland et al.,2008;Inger et al.,2009; Bedard et al.,
7
2010). Offshore wind energy is harvested by turbines
ro-8
tating about a horizontal axis, which are derived from the
9
well-established technology used on land. Nowadays,
com-10
mercial offshore wind turbines have seafloor foundations,
11
the most common ones being monopiles driven into the
12
bed, gravity-based foundations, tripod foundations and
13
jacket foundations. However, with wind parks moving
14
towards deeper water, various types of floating
founda-15
tions are being developed (Butterfield et al.,2007;Main(e)
16
International Consulting, 2012). For waves, the
techno-17
logy is relatively immature and no commercial design has
18
emerged yet amongst the very large variety of existing
con-19
cepts (seeDrew et al.,2009;Bald et al.,2010). Regarding
20
currents, the most significant technology offshore consists
21
∗Corresponding author
Email address: : [email protected] (Erwan Garel)
of rotating devices on horizontal axes (similar to wind tur- 22
bines), even though other designs including vertical axes 23
are also considered (see O’Rourke et al., 2010; Polagye 24
et al.,2011). 25
As wind energy projects are moving further offshore, they 26
are also increasing in size (seeEWEA,2012). The worlds 27
largest (in surface area) Marine Renewable Energy (MRE) 28
project currently operating offshore is the Greater Gab- 29
bard (southern North Sea), covering 146 km2with a nom- 30
inal capacity of 504 M W ; it should be soon exceeded by 31
the 1,000 M W London array project (230 km2 surface 32
area) which is currently being developed in two phases 33
(Phase 1: 175 turbines over 121 km2 generating 630 M W
34
is fully operating since April 2013). The future of both 35
wave and tidal energy converters is also to cover such large 36
areas including hundreds of devices (see Johnson et al., 37
2012). In addition, the offshore energy industry is con- 38
sidering large-scale (i.e., area > 10 km2, at least)
multi-39
platform projects combining various MRE devices (e.g., 40
wind turbines and wave converters) or activities (e.g., en- 41
ergy conversion and aquaculture), in order to increase the 42
utilisation factor per site and the overall revenue. That ef- 43
fort is testified by the relatively large number of recent EU- 44
funded projects related to this domain (e.g., MARINA; 45
Multi-platform or not,MREprojects are also expected to
47
cumulate at specific locations offshore because of grid and
48
land access considerations, together with site-specificity
49
regarding the resource (especially for waves and currents).
50
In the Irish Sea, for example, three windfarms are
cur-51
rently operating within a radius of less than 20 km
(Wal-52
ney, Barrow and Ormonde, covering an area of 73 km2,
53
10 km2and 8.7 km2, respectively) and a fourth very large
54
one is proposed (West Duddon, 66 km2). The
develop-55
ment of these large-scale projects, and their addition to
56
other anthropogenic activities offshore, is accompanied by
57
environmental concerns (Pelc and Fujita,2002;Gill,2005;
58
Michel et al., 2007; Sutherland et al., 2008; Inger et al.,
59
2009;Masden et al.,2010;Simas et al.,2010;Wilhelmsson
60
et al.,2010;Shields et al.,2011).
61
The evaluation of environmental effects in the offshore
62
realm is a difficult task, because the marine
environ-63
ment is a highly complex system where physical,
chem-64
ical and biological properties interact at several spatial
65
and temporal scales. Although being ambiguously defined
66
(Heink and Kowarik, 2010), “environmental indicators”
67
generally reduce the complexity of a problem, or of a
68
large number of parameters, to a smaller number of
key-69
parameters that enable the description or quantification
70
of the status and trends of (entire or partial) ecosystems.
71
As such, indicators may facilitate management decisions
72
as they provide the necessary information for
decision-73
makers about where, when and how to act (Gubbay,2004;
74
Davidson et al., 2007). They are also useful for the
com-75
munication of overall progress on stated goals and
bench-76
marks.
77
During the last decade, indicators have been increasingly
78
developed, including for the marine environment
(Dav-79
ies et al., 2001; Gubbay, 2004), and used at global (e.g.
80
World Bank, United Nation, Organization for Economic
81
Co-operation and Development), regional (e.g., European
82
Environment Agency), national and local levels, as well as
83
in the private sector. For example, environmental
indicat-84
ors are commonly used by the offshore oil and gas industry
85
to assess the impact of exploitation on the benthic ecology
86
and water quality (e.g.,Olsgard and Gray,1995;Andrade
87
and Renaud, 2011).
88
Indicators are commonly defined and organized in
frame-89
works that facilitate their understanding and
interpret-90
ation ensuring at the same time the appropriate match
91
between end-users and scientists (Gabrielsen and Bosch,
92
2003; Gubbay, 2004). Frameworks can also help to
93
understand the inter-relations between various
indicat-94
ors (Stegnestam, 1999). Several environmental
frame-95
works have been proposed, depending on the
applica-96
tion and scale of the problem considered. For example,
97
the Drivers-Pressures-Status-Impacts-Response (DPSIR)
98
model provides an overall approach for analysing
envir-99
onmental issues, generally with regards to sustainable
de-100
velopment (Borja et al., 2006). This framework is useful
101
as a descriptive method reporting the environmental im- 102
pacts of a particular sector through the use of indicators; 103
as such, it is largely used to report indicators set at na- 104
tional levels and is able to provide a link between the socio- 105
economic aspects of an activity and the induced environ- 106
mental changes. DPSIRmay be therefore well-adapted for 107
the strategic development of the offshore MRE industry 108
(Elliott, 2002). However, this type of framework might 109
not be relevant -or difficult to implement- if the focus is 110
on environmental monitoring of specific projects, where 111
guidance is required to select specific indicators. In this 112
case, other prescriptive and fully quantitative frameworks 113
that explicitly link objectives and quantitative parameters 114
are more adequate. 115
This paper assesses the applicability of the Frame of Refer- 116
ence (FoR) approach for the environmental monitoring of 117
offshoreMREprojects. Even though the proposed method 118
is applicable to any type of offshore large-scale project, the 119
focus is upon projects harvesting energy from winds, waves 120
and currents (multi-platform or not). 121
2. Environmental effects and impacts of offshore 122
MRE projects 123
2.1. Classification of environmental effects 124
Given the complexity of the marine environment and the 125
multiplicity of technologies to harvestMRE, it is conveni- 126
ent to classify environmental effects within a framework. 127
The framework used in the present paper is based on the 128
one proposed by McMurray (2008) for wave converters, 129
subsequently modified by Boehlert and Gill (2010) and 130
by Polagye et al. (2011) for application to various MRE 131
devices. 132
The framework describes environmental concerns in terms 133
of stressors, receptors, effects and impacts. Stressors are 134
features that may induce environmental changes. Recept- 135
ors are elements of the ecosystem that may (or may not) 136
respond to the stressor. Effects describe how the receptor 137
is affected by the stressor, but do not indicate magnitude 138
or significance. Impacts deal with severity, intensity or 139
duration of the effect, and also with its direction (i.e., pos- 140
itive or negative). Impacts are generally recognized when 141
the effects induce changes in specific variables that are 142
used to define the status of the concerned receptor. These 143
impacts can be either direct or indirect (the latter obvi- 144
ously being more difficult to evaluate). Indicators can be 145
used to determine if the effects are strong enough to induce 146
impacts and if a response is required. 147
148
2.2. Stressors and receptors 149
In the context of offshore wind, wave and current projects, 150
Physical presence of device
Dynamics Release of chemicals Generation of sound Electro-Magnetic Fields
Physical Artificial reef Scouring
environment Seabed disruption
Hydrodynamic changes Aerodynamic changes Sediment dynamic
changes
Marine Collision potential Hearing injuries Behavioural change
mammals Aggregation effect Site avoidance
and turtles Obstruction of migratory Stress increase
route Acoustic masking
Pelagic Collision potential Hydrodynamic changes Hearing injuries Behavioural change habitat and Artificial reef Aerodynamic changes Site avoidance
communities Aggregation effect Pressure effects near Stress increase
No take zone rotating devices Acoustic masking
Steppingstone effect
Benthic Artificial reef Scouring Pollution from Acoustic masking Behavioural change
habitat and No take zone Seabed disruption dredging Sediment temperature
communities Steppingstone effect Hydrodynamic changes increase
Flora and fauna impact Aerodynamic changes by moorings Sediment dynamic
changes
Marine birds Collision potential Site avoidance
Aggregation effect Obstruction of migratory
route
Water Artificial reef Seabed disruption Leaching quality Light reduction Hydrodynamic changes Spilling
Sediment re-suspension Aerodynamic changes Pollution from by moorings Sediment dynamic dredging
changes Pollution from maintenance
Table 1: Potential effects of stressors (top row) upon receptors (far left column), associated to offshore MREdevices. For simplicity, the stressor “cumulative impacts” and the receptor “ecosystem interactions” are not included. Environmental effects and main potential impacts are discussed in more detail insubsection 2.3.
1. physical presence of (fixed and moving) parts of the
152
devices in the water and in the air (including the
in-153
troduction of material or substrate at the bed);
154
2. dynamics, which relates to (near- and far-field)
155
changes in the air and water pressure fields and in
sed-156
iment dynamics (including changes in sediment
distri-157
bution due to seabed disruption during construction);
158
3. release of chemicals in the area from the equipment
159
and vehicles linked to the activity and from seabed
160
removal;
161
4. generation of sound, both above and under water;
162
5. Electro-Magnetic Fields, produced by cables (during
163
the operational phase); and
164
6. cumulative impacts of stressors from several
large-165
scale projects and other human activities.
166
For each stressor, the stage of development of the project
167
(survey, construction, operation and maintenance, and
de-168
commissioning) should be considered, together with the
169
time scale (duration and frequency) and spatial extent.
170
Both the time scale and spatial extent are highly
project-171
and site-specific (e.g., the construction phase may take
172
years to complete in the case of very large projects), and
173
are not considered in this paper (for detailed information, 174
seeWilhelmsson et al.,2010). 175
Seven groups of receptors are considered with respect to 176
MREactivities: 177
1. the physical environment, i.e. the atmospheric and 178
marine (wave and current) climates and the bed sed- 179
iment (near-field and far-field); 180
2. marine mammals and sea turtles; 181
3. pelagic habitat and communities, including planktonic 182
and nektonic organisms (excluding marine mammals 183
and sea turtles); 184
4. benthic habitat and communities, including macro- 185
phytes, invertebrates and vertebrates living in asso- 186
ciation to bed sediment; 187
5. marine birds, living or migrating near the project 188
area; 189
6. water quality, measured based on its physical and 190
chemical properties; and, 191
7. ecosystem interactions, such as (but not only) food 192
Amongst these receptors, marine birds, marine mammals
194
and sea turtles are often protected by specific
environ-195
mental policies, conventions and international agreements.
196
For this reason (and also due to public perception) they are
197
of particular importance for the development of offshore
198
MREprojects. Due to their potential impacts on specific
199
pelagic and benthic receptors (habitats and communities),
200
large scale projects may indirectly change ecological
pro-201
cesses and dynamics of marine food webs (e.g., cascading
202
effects). The response of this receptor group (“ecosystem
203
interactions”) to stresses is the most difficult to evaluate,
204
because of its complexity and also because impacts may
205
occur even if no discernible changes are observed on other
206
receptors.
207
2.3. Environmental effects and main potential
im-208
pacts
209
The potential effects of stressors upon receptors at
off-210
shore MRE projects were identified based on a literature
211
review and reported in Table 1. Information from the
fol-212
lowing sources was used: CMACS(2003);Gill(2005);Gill
213
et al. (2005); Hastings and Popper (2005); Zucco et al.
214
(2006);BSH(2007);Linley et al.(2007);Brostrom(2008);
215
Evans (2008); OSPAR (2008); Vize et al. (2008); Gill
216
et al. (2009); Inger et al. (2009); USDOE (2009); Bald
217
et al. (2010); Boehlert and Gill (2010); Mueller-Blenkle
218
et al.(2010);Wilhelmsson et al.(2010);Normandeau et al.
219
(2011);Shields et al.(2011);Smith et al.(2012). Although
220
the potential effects of stressors on most receptors are
iden-221
tified, there are large knowledge gaps regarding the
cor-222
responding (positive and negative) impacts (Zucco et al.,
223
2006; Inger et al., 2009; Bald et al., 2010; Boehlert and
224
Gill,2010;Wilhelmsson et al.,2010). To date, results from
225
only few long-term (years) monitoring surveys at
wind-226
farms (all with fixed foundations) are available (e.g.,
Dan-227
ish Energy Authority, 2009; Degraer and Brabant, 2009;
228
Stenberg et al.,2011). The lack of knowledge of individual
229
stressor impacts inhibits the realisation of adequate
cumu-230
lative effects assessments (Polagye et al.,2011).
231
Despite large uncertainties, most of the negative
envir-232
onmental impacts of a single offshore MRE project are
233
considered of small intensity, short-term and/or of
lim-234
ited spatial extent (see Wilhelmsson et al., 2010). One
235
often cited potential negative impact upon marine birds
236
results from the risk of collision with (fixed or moving)
237
parts of the devices. Available studies indicate, however,
238
that collisions have small impacts at a population scale
239
level, although they can be significant for certain species
240
(Desholm,2009; Wilhelmsson et al., 2010). Concerns for
241
marine birds are higher in case of fragmentation of
co-242
herent ecological units and habitat loss that can be
in-243
duced by an avoidance behaviour due to the presence of
244
the devices and to the production of noise; likewise, by
245
deflection of migration routes, especially for daily
com-246
muting species which might not have enough energy to
247
cope with the changes (e.g.,Larsen and Guillemette,2007; 248
Masden et al., 2009). In general, the greatest risks faced 249
by marine mammals are hearing injuries and habitat loss 250
due to the production of sounds during the construction 251
phase (Bald et al., 2010; Wilhelmsson et al., 2010), even 252
though strikes by the blades of current devices may also be 253
of concern in some cases (Boehlert and Gill, 2010). Fur- 254
thermore, the production of noise during operation may 255
mask bio-acoustics for communication and navigation of 256
long-distance migrating whales and sea turtles (Samuel 257
et al., 2005; Wilhelmsson et al., 2010). The newly con- 258
structed structures may serve as steppingstones for in- 259
vasive species (dispersal effect), which might pose as a 260
threat for local benthic and pelagic communities (Bulleri 261
and Airoldi,2005;Glasby et al.,2007;Wilhelmsson et al., 262
2010). The production of magnetic fields by cables may 263
also modify the behaviour of resident or migratory species 264
that use geomagnetic field for localisation and orientation 265
(CMACS,2003; Gill,2005; Gill et al., 2009;Normandeau 266
et al., 2011; Wilhelmsson et al., 2010). Overall, oil slick 267
resulting from aircraft or ship accident is considered to 268
have the largest potential negative impact upon all recept- 269
ors in terms of duration, spatial extent and intensity (Bald 270
et al.,2010). 271
The main potential positive impacts are associated with 272
the physical presence of MRE devices. The exclusion of 273
fishing activities, including trawling, within the project 274
area should act as a “no take zone”, with positive impacts 275
for pelagic species (e.g., increase of fish stocks) and benthic 276
communities with a more favourable environment for long- 277
lived rather than opportunistic species (Defew et al.,2012; 278
Fayram and De Risi,2007;Wilhelmsson et al.,2010). Fur- 279
thermore, the introduction of hard structures (e.g., piles, 280
foundations, scouring protection, buoys) will provide ad- 281
ditional (or new) settlement surface/habitat for benthic 282
organisms and fishes (Langhamer et al., 2009), thus act- 283
ing as an “artificial reef” (Langhamer et al., 2009); ob- 284
servations at artificial reefs and wind farms suggest that 285
this effect generally results in positive impacts in terms 286
of ecosystems and biodiversity (Petersen and Malm,2006; 287
Seaman, 2007; but see also Inger et al., 2009). In par- 288
ticular, the new settled communities may attract pelagic 289
and nektonic organisms, forming a so-called “fish aggreg- 290
ation device” (Wilhelmsson et al., 2006). The resulting 291
modification of pelagic and benthic habitats, communities 292
and prey distributions may in turn enhance feeding op- 293
portunities for certain species of seabirds, cetaceans and 294
pinnipeds (Wilhelmsson et al., 2010). 295
3. Indicators implementation 296
3.1. Importance of environmental monitoring pro- 297
grams 298
The key environmental regulations of offshoreMREactiv- 299
from various international agreements and conventions. In
301
particular, an Environmental Impact Assessment (EIA) is
302
generally required prior to project consent, in order to
en-303
sure that the responsible authority makes a decision with
304
the full knowledge of any significant effects (cumulative,
305
positive and negative) on the environment. In this paper,
306
Europe is taken as an example since it is where the
off-307
shore wind power sector is the most developed (EWEA,
308
2010; Tuebke and Hernandez Guevara, 2011; Madariaga
309
et al.,2012).
310
The European Directive 2011/92/EU requires that
Mem-311
ber States carry out an EIA for the consent of projects
312
which are considered to have significant effects on the
en-313
vironment, including offshore wind project (e.g., CEFAS,
314
2004). For otherMRE projects, the necessity to conduct
315
an EIA is at the discretion of the Member States, even
316
though in practice it is assumed that an EIAwill be also
317
required (Huertas-Olivares et al.,2007;Woolf,2011;
Mar-318
gheritini et al.,2012). The findings of anEIAare reported
319
in an Environmental Statement (ES), where the
environ-320
mental factors that may be affected by the proposed
pro-321
ject are described (e.g.,Talisman,2004), ideally, from
con-322
struction to decommissioning. The ES also indicates the
323
measures to implement for the mitigation of the potential
324
negative impacts (seeCEFAS,2004). Moreover, an
Envir-325
onmental Management Plan (EMP) should be provided for
326
the follow-up of effects that may threaten the environment
327
(Huertas-Olivares et al., 2007).
328
The exact requested content of the EIAis highly variable
329
in between Member States (and also sometimes in between
330
projects within the same country) (Huertas-Olivares et al.,
331
2007). A cumulative impact assessment should also be
332
undertaken as part of the EIA process, but such
assess-333
ments are rarely considered satisfactorily (Masden et al.,
334
2010). In any case, with regards to the large knowledge
335
gaps about the impacts of offshore MRE projects, it can
336
be considered that the general policy is to “deploy and
337
monitor”, as opposed for example to the “precaution
prin-338
ciple” which is applied to a large range of other activities
339
and supported by EU regulation (Johnson et al., 2012).
340
This is because the need to perform long-term research
341
on environmental impacts is dominated by the imperative
342
to develop marine energy which is driven by urgent
polit-343
ical, economic and climate change considerations (Athanas
344
and McCormick, 2013; SEL, 2010). Such a “deploy and
345
monitor” policy requires the implementation of effective
346
monitoring activities aimed at environmental protection
347
and knowledge development. Therefore the EMP should
348
be regarded as one of the most important outputs of the
349
EIA, with the following general objectives:
350
to provide feedback and early warning of potential
351
environmental damages;
352
to ensure that impacts do not exceed legal standards;
353
and,
354
to check the implementation of mitigation measures 355
in the manner described in theES report. 356
The use of environmental indicators to report the results 357
of theEMP represents a great asset for the development 358
of the incipient offshore MRE industry because indicat- 359
ors: 360
conveniently convey information to government and 361
industries about environmental effects (negative as 362
well as positive); 363
help to determine whether observed effects are ac- 364
ceptable or not through the upfront specification of 365
thresholds and trigger levels; 366
allow the effectiveness assessment of mitigation meas- 367
ures; 368
allow comparisons with similar (MRE) projects and 369
with other human activities; and, 370
may be used as a tool for communication with other 371
stakeholders, such as non-governmental organizations, 372
the general public, etc. 373
The need to implement indicators for the evaluation of 374
the environmental impacts of offshore windfarms has been 375
recognized (Degraer and Brabant, 2009), but rarely put 376
into practice. Some examples include the clicks’ records 377
of acoustic porpoise’s detectors (T-Pods) which are used 378
to define various indicators for density, abundance, activ- 379
ity, etc. (Rye et al., 2008; Lindeboom et al., 2011). At 380
the Horns Rev 1 offshore windfarm, sand eels have been 381
also used as indicators of the ecosystem health (Sten- 382
berg et al., 2011). However, existing indicators are gen- 383
erally site-specific and not explicitly linked to objectives 384
and quantitative parameters or thresholds (e.g.,Henriksen 385
et al.,2003). With tighter environmental legislation that 386
promotes the use of environmental indicators in marine 387
areas, standardized monitoring protocols should be adop- 388
ted to enhance their usage and utility (seeJohnson,2008; 389
Degraer and Brabant, 2009). In that context, the use of 390
tools such as theFoRapproach may be useful for the defin- 391
ition and use of coherent sets of environmental indicators 392
at offshore MREprojects. An additional benefit of these 393
tools is the possibility to compare between different applic- 394
ations of the same indicator, in a process of gradual im- 395
provement. These approaches also help to evaluate if the 396
cost of measuring the indicator is justified by the expected 397
gain (increased level of environmental protection). 398
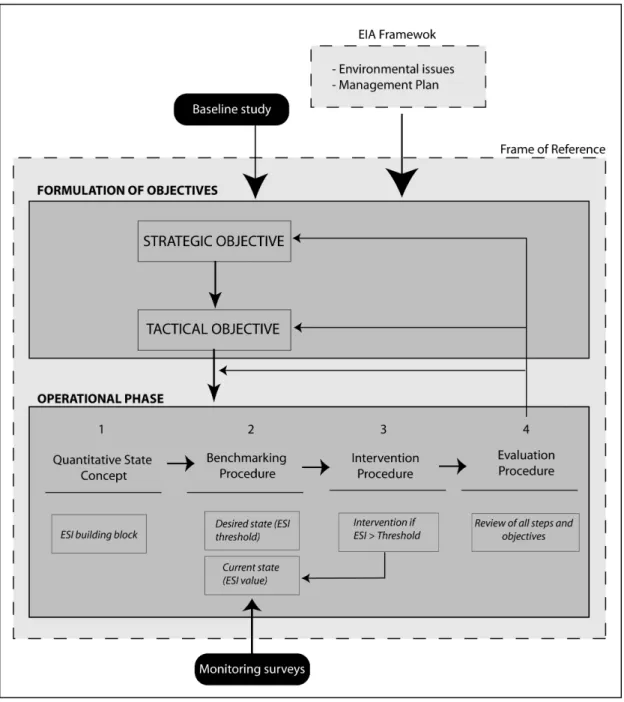
3.2. The Frame of Reference approach 399
The Frame of Reference (FoR) approach was developed to 400
help researchers from different fields to use one method 401
generically applicable to embed their results in a practical 402
decision context (Van Koningsveld et al.,2003;Van Kon- 403
Figure 1: The Frame of Reference framework and application to offshore MRE projects (adapted fromVan Koningsveld et al.,2007). The basic actions which are required at each steps of the operational phase are indicated in italics.
The approach is characterised by the definition of clear
ob-405
jectives at strategic and operational (or tactical) levels and
406
an operational phase where indicators are defined to verify
407
whether or not these objectives are met (Figure 1).
408
The FoR framework has been used so far for the
imple-409
mentation of coastal state indicators that help decision
410
making with respect to the protection of eroding coasts,
411
through enhanced communication between scientists and
412
coastal managers (Van Koningsveld et al.,2007;Davidson
413
et al., 2007; Ciavola et al., 2011; Marchand et al., 2011;
414
De Vriend and Van Koningsveld, 2012). In fact, it has
415
been used implicitly over the last decade in The
Nether-416
lands for the successful development and implementation
417
of a coastal erosion policy (Van Koningsveld and Mulder, 418
2004;Van Koningsveld and Lescinski,2007;Mulder et al., 419
2011). 420
The first step of the FoR approach is the formulation of 421
“strategic objectives” based on the long-term vision about 422
the desired status of the system (Figure 1). In a second 423
step, the means of satisfying (at least partly) each strategic 424
objective at the short-term are made explicit through the 425
definition of one or several “operational objectives”. Fol- 426
lowingMarchand et al.(2011) andMulder et al.(2011), it 427
might be more adequate to qualify these objectives as “tac- 428
tical” -rather than “operational”- because this step implies 429
ponding strategic objective. The words and phrases used
431
for the formulation of the objectives should be considered
432
with extreme caution as they steer all consequent thinking;
433
iteration is required in order to think through the process
434
several times and ensure that the objectives are
conceptu-435
alised adequately regarding the environmental issues which
436
are at stake.
437
At the next level, an operational decision recipe consisting
438
of four stages is applied in order to meet each of the
pre-439
defined objectives:
440
1. the Quantitative State Concept (QSC);
441
2. the Benchmarking procedure;
442
3. the Intervention procedure, and
443
4. the Evaluation procedure.
444
The QSC defines for each tactical objective one or more
445
quantifiable parameters that will be used in the decision
446
making. This step is determinant regarding the actions
447
to be implemented at the next stages, as it specifies the
448
quantitative building block that is used to construct
indic-449
ators (second stage), to establish the intervention
proced-450
ure (third stage), and to help to assess whether or not the
451
objectives are met (fourth stage).
452
Threshold values are attributed to the parameters defined
453
at the QSC during the benchmarking procedure stage.
454
These thresholds determine the desired state of the
sys-455
tem, whilst the current state is established based on
mon-456
itoring. The benchmarking procedure is therefore the
in-457
dicator since it is at this stage that impacts are indicated
458
through comparison of the current and desired state. In
459
case of impact, the intervention procedure (third stage)
460
prescribes the actions to implement for restoring the
sys-461
tem toward the desired state. The current state is updated
462
with (new) data from monitoring surveys, prior to another
463
benchmarking procedure. It is important to design
inter-464
ventions as such that after implementation they influence
465
the indicators status as desired. This may seem trivial,
466
but it is not. Finally, the success of the actions undertaken
467
at the three previous stages is assessed through an
eval-468
uation procedure, which determines whether the strategic
469
and operational objectives are being met. At this stage,
470
all the various steps of the framework should be subject to
471
re-assessment. In particular, new parameters or threshold
472
levels can be defined through newQSCand benchmarking
473
procedures; both the strategic and operational objectives
474
may also be modified if required. A FoRmay also be
dis-475
carded if it is found irrelevant or uneconomic for a given
476
project or objective.
477
4. Applicability of the Frame of Reference to off- 478
shore MRE projects 479
4.1. General aspects 480
The complexity of ecosystem processes and interactions 481
in the offshore environment may result in a mismatch 482
between scientists and decision makers’ needs regarding 483
the development of offshoreMREprojects. Although ori- 484
ginally developed for the implementation of coastal policy, 485
the FoR approach could help through the construction 486
of Environmental State Indicators (ESI) used to verify 487
whether or not formulated objectives are met. 488
Obviously, the strategic objectives should derive from the 489
key environmental issues identified through theEIA pro- 490
cess. They might follow from (national or international) 491
legislation, conventions or treaties. Strategic objectives 492
might as well derive from binding conditions set by envir- 493
onmental agencies and local authorities for project con- 494
sent, or by informal commitment of project managers. To 495
ensure that all separate elements of the generally long last- 496
ing EIA process still fit together at the end of the pro- 497
cess, a common framework for impacts classification, such 498
as the stressor-receptor framework described inSection 2 499
(Boehlert and Gill,2010), should be adopted during both 500
the EIA and FoR procedures. This facilitates the com- 501
munication between the various parties involved at any 502
stage of theEMP. For example, stressor-receptor matrixes 503
can be drawn to represent impacts severity, the temporal 504
and spatial scales and uncertainties (see Polagye et al., 505
2011). 506
The operational phase should rely on the specific actions 507
proposed in theEMPregarding the identification, follow- 508
up and mitigation of impacts. At offshore wind farms 509
(and presumably at any type of futureMREprojects), the 510
EMP commonly follows the Before-After Control-Impact 511
(BACI) approach (Green, 1979), where the current state 512
of the site is compared to previous and/or pristine environ- 513
mental conditions known from the baseline study and from 514
concurrent measurements at “reference areas”. The defin- 515
ition of thresholds representing the “desired state” might 516
be one of the most difficult tasks of impacts evaluation, 517
since natural temporal and spatial variability of paramet- 518
ers must be considered. In some cases, indicator thresholds 519
are fixed by legal requirements. In most cases, however, 520
they must be established based on robust expertise to- 521
gether with a good knowledge of the natural environmental 522
conditions at various spatial and temporal scales. Simil- 523
arly, monitoring surveys alone might not be enough to em- 524
brace the natural variability (both spatial and temporal) 525
of the measured parameters. The establishment of the cur- 526
rent state may also be based on statistical and numerical 527
models. Not only do these tools allow the interpretation of 528
a limited number of measurements over broader areas and 529
longer time-scales, but they can also be useful in defining 530
Receptor Stressor Effect Environmental Issue Description
Mammals Sound Avoidance Porpoise protection Porpoises may escape the
pro-posed area due to the produc-tion of sound
Benthos Presence of
devices
Artificial reef Habitat conservation The shell deposits of the newly settled blue mussel may induce a change from soft- to hard-bottom substrates
Birds Presence of
devices
Collision Common Eider ducks
protec-tion
Migrating Eider ducks popula-tion may suffer large loss from collision with rotating blades
Water quality Chemical Spilling Water pollution The activity induces a risk of
oil spilling from device compon-ents and vessels
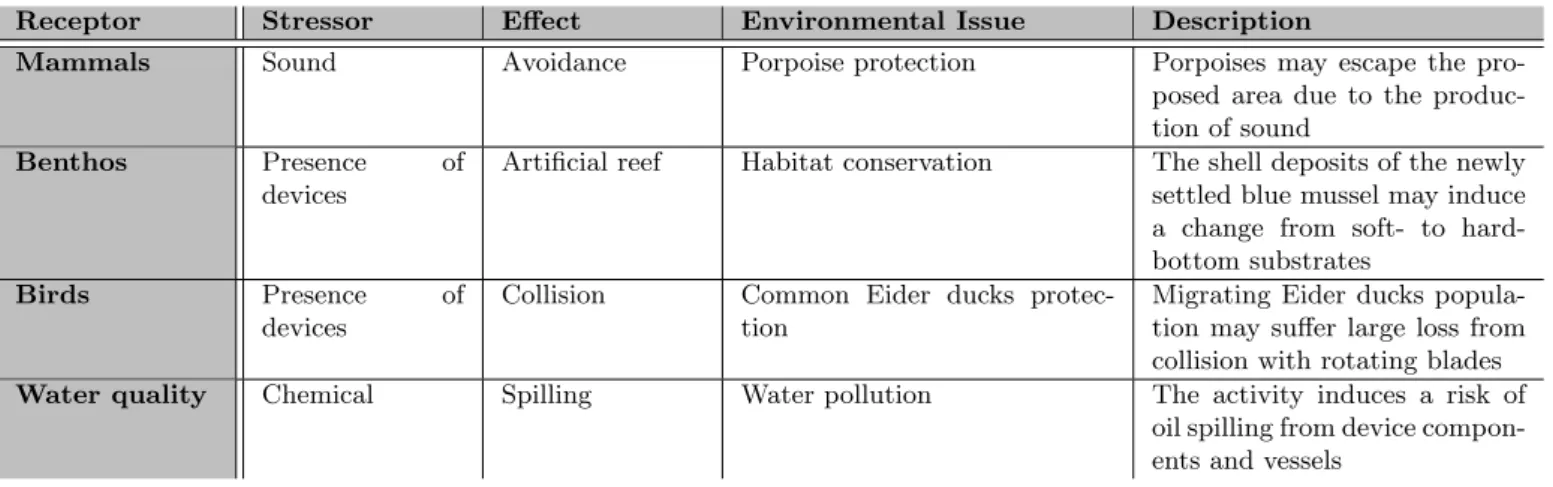
Table 2: Example of Environmental Issues identified during the EIA of a MRE project. The environmental concerns are explained in more detail inSubsection 4.2.
532
4.2. Examples of application
533
In order to illustrate how the FoRapproach works, a
vir-534
tual offshore MRE project in Europe is considered, for
535
which the EIA has reported the following environmental
536
concerns (see alsoTable 2):
537
Mammals: Harbour porpoises (Phocoena phocoena)
538
are abundant in the area and may suffer hearing
in-539
juries and death due to the emission of underwater
540
sound from devices and vessel activities, during
con-541
struction, operation and maintenance, and
decommis-542
sioning. Harbour porpoises are strictly protected in
543
Europe under the Habitat Directive, and several
con-544
ventions.
545
Benthos: The proposed project sites on sandy shoals,
546
which are markedly distinct from the surrounding in
547
terms of benthic habitat. The benthic communities
548
of these shoals are considered to have a high
eco-549
logical value, as they provide key ecological services
550
at multiple trophic levels (e.g., Dubois et al., 2009).
551
Blue mussels (Mytilus edulis) dominate the regional
552
hard bottom fauna communities and are expected to
553
settle on the immerged structures and scour
protec-554
tions around foundations. The deposit of mussel shells
555
at the bed may induce a shift from sandy towards
556
hard substrate benthic habitat with potential
negat-557
ive impacts on the structure of the ecosystem. The
558
key environmental issue is the conservation of sandy
559
habitats.
560
Birds: The migrating route of Common Eider ducks
561
(Somateria mollissima) passes in the vicinity of the
562
proposed area. Available studies show that Eider
563
ducks generally avoid flying close or into (single) wind
564
farms (Masden et al., 2009). However, this
beha-565
viour relies on vision and there are large uncertainties
566
about their flight patterns during periods of dark- 567
ness and conditions of poor visibility such as fog or 568
snow (Larsen and Guillemette, 2007). Under these 569
bad visibility conditions, the probability of collision 570
with wind turbines may be significantly enhanced, es- 571
pecially if birds are attracted by illuminated turbines 572
(Fox et al., 2006). Eider ducks are protected under 573
the EU Bird Directive. 574
Water quality: The water quality may be affected as a 575
result of oil spilling from components (e.g., gear boxes, 576
hydraulic pumps) ofMREdevices, and also from ves- 577
sels and helicopters supporting the activity. 578
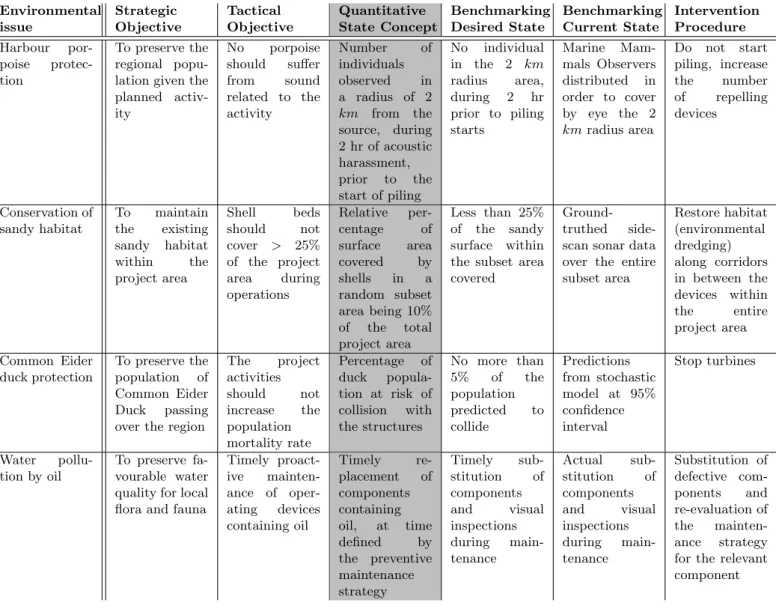
Regarding harbour porpoise protection against underwa- 579
ter sound, the long-term strategic objective of the FoR 580
could be ‘to preserve the regional population given the 581
planned activity’ (Table 3). Studies have shown that wind 582
farm related sound, for example, has the potential to af- 583
fect the behaviour and physiology of harbour porpoises at 584
considerable distances. Physiological effects include Tem- 585
porary and Permanent Hearing Threshold Shifts and more 586
severe injuries up to death, depending of the distance of 587
the individual to the source. Hence, one tactical object- 588
ive could be that ‘no porpoise should suffer from sound 589
related to the activity’ (Table 3). More specifically this 590
objective could be achieved by either reducing the sound 591
at the source or by physically keeping the porpoise away 592
from areas where sound levels are potentially harmful. The 593
underwater sound hazard is greatest during the construc- 594
tion phase, when porpoises are present in the area. Past 595
experience has shown that porpoises avoid areas where pil- 596
ing activities take place; lethal hearing injuries may occur 597
if they are located too close to the source when hammer- 598
ing starts. In this example we will focus on keeping the 599
porpoises at a safe distance from the sound source. Re- 600
cent studies have indicated that during piling, severe in- 601
juries are estimated to occur in a radius of 1.8 km from 602
the source (Thomsen et al., 2006). TheESI in this case 603
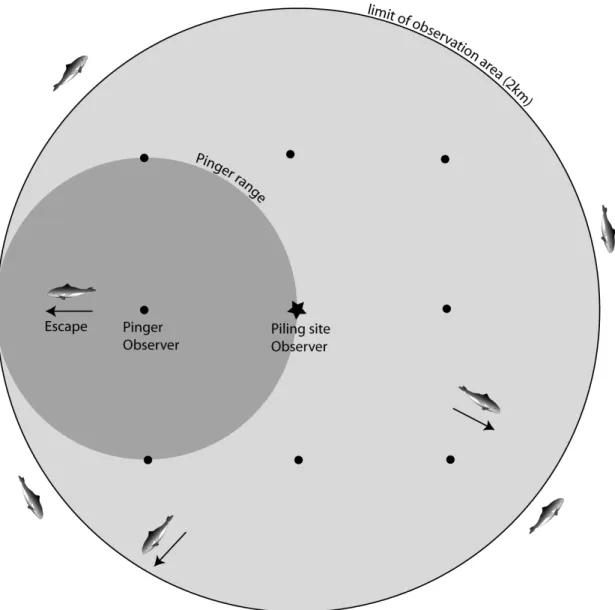
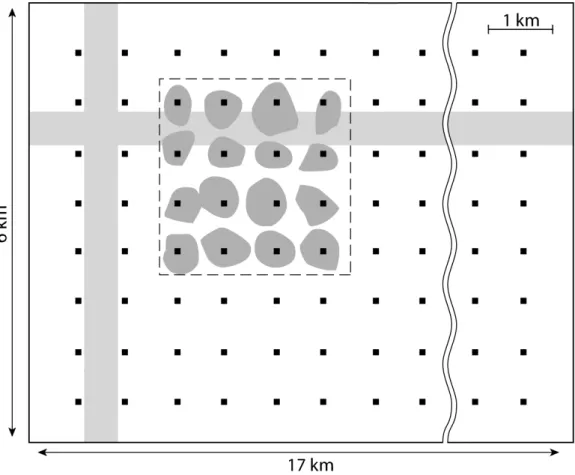
Figure 2: Example of field set up for an operational phase designed to scare porpoises during piling (see tactical objective). Eight pingers (dots) with 1 km range each (see the dark grey area, represented for one pinger only) are used to scare porpoises before piling starts to allow them to escape the area. Marine mammal observers, one at each pinger location plus one at the piling site, establish the current state (benchmarking), by checking for the presence of porpoise in the 2 km radius area of potential injuries by sound (light grey area). Piling is allowed to start if no porpoise is observed in this area during the preceding 2 hr (ESI).
individuals within 2 km from the source, after the
deploy-605
ment of acoustic harassment (or scaring) devices, during a
606
certain time (e.g., 2 hr) prior to conduct the piling
opera-607
tions’ (QSC,Table 3;Figure 2). Several devices might be
608
necessary, depending on their range of effectiveness (e.g.,
609
Cox et al.,2001;Culik et al.,2001). The desired state is the
610
absence of individual within the 2 km radius during this
611
time interval (Table 3). The current state could be
estab-612
lished based on marine mammal observers deployed in
or-613
der to visually cover the total area of restriction (Figure 2;
614
Table 3). If no individual is observed, piling can start
615
without concerns for porpoises. Otherwise, operations
616
should be postponed until reaching the desired state; the
617
use of additional or other types of repelling devices might
618
be necessary (Intervention procedure, Table 3).
Evaluat-619
ing the proposed procedure it seems likely that this FoR
620
will contribute to its strategic objective. The tactical ob- 621
jective is vulnerable to marine mammals observers missing 622
porpoises that still are present despite the period of har- 623
assment. Put in practice procedures should be optimized 624
to minimize this risk. 625
626
The proposed project will undoubtedly induce local phys- 627
ical changes of habitat (if only for the introduction of hard 628
structures in the water). The development of organisms 629
such as mussels on the structures may create locally “hot 630
spots” of biological activity (e.g., Norling and Kautsky, 631
2008) that could be beneficial to the ecosystem (including 632
the shoal benthic community). Thus, one strategic ob- 633
jective could be to enhance biodiversity and productivity, 634
Environmental issue Strategic Objective Tactical Objective Quantitative State Concept Benchmarking Desired State Benchmarking Current State Intervention Procedure Harbour por-poise protec-tion To preserve the regional popu-lation given the planned activ-ity No porpoise should suffer from sound related to the activity Number of individuals observed in a radius of 2 km from the source, during 2 hr of acoustic harassment, prior to the start of piling No individual in the 2 km radius area, during 2 hr prior to piling starts Marine Mam-mals Observers distributed in order to cover by eye the 2 km radius area Do not start piling, increase the number of repelling devices Conservation of sandy habitat To maintain the existing sandy habitat within the project area Shell beds should not cover > 25% of the project area during operations Relative per-centage of surface area covered by shells in a random subset area being 10% of the total project area Less than 25% of the sandy surface within the subset area covered
Ground-truthed side-scan sonar data over the entire subset area Restore habitat (environmental dredging) along corridors in between the devices within the entire project area Common Eider duck protection To preserve the population of Common Eider Duck passing over the region
The project activities should not increase the population mortality rate Percentage of duck popula-tion at risk of collision with the structures No more than 5% of the population predicted to collide Predictions from stochastic model at 95% confidence interval Stop turbines Water pollu-tion by oil To preserve fa-vourable water quality for local flora and fauna
Timely proact-ive mainten-ance of oper-ating devices containing oil Timely re-placement of components containing oil, at time defined by the preventive maintenance strategy Timely sub-stitution of components and visual inspections during main-tenance Actual sub-stitution of components and visual inspections during main-tenance Substitution of defective com-ponents and re-evaluation of the mainten-ance strategy for the relevant component
Table 3: Examples of application of the FoR approach to MRE projects. The gray column (QSC) corresponds to the quantitative building block that is used for the construction of the indicator at the benchmarking procedure stage. For explanations, see text.
greater predation- on the shoal benthic community
(an-636
otherFoRmay be defined to tackle this latter issue); this
637
objective could be achieved through the selection of
un-638
derwater structures designed to favour the colonisation of
639
selected species (see Martins et al., 2010; De Vriend and
640
Van Koningsveld, 2012;De Vriend et al., 2014). Another
641
(more defensive) approach, taken as example here, could
642
be to ‘maintain the existing sandy habitat within the
pro-643
ject area’ (Strategic objective, Table 3). This approach
644
supposes that it has been previously evidenced that
reduc-645
tion of this habitat induces negative impacts (at present,
646
this effect is generally not a major concern, but it could
647
become substantial in the case of farms with several
hun-648
dreds of devices operating for decades). It is technically
649
difficult and costly to inhibit the colonisation of organisms
650
on newly introduced material. Thus, the tactical
object-651
ive could be that ‘shell beds should not cover more than
652
25% of the project area during operation’ (Table 3). The
653
QSC stage may define the parameter to quantify the
ex-654
tension of shell beds as the ‘relative percentage of surface 655
area which is covered by shell deposits within a subset 656
region (selected randomly) corresponding to 10% in sur- 657
face area of the proposed project’ (Table 3). This requires 658
that the distinction between sandy and mussel bed hab- 659
itats is clearly defined at the benchmarking procedure, as 660
it depends on the method used to establish the current 661
state. For example, if mechanical sediment sampling is 662
involved, the classification of sand mixed with mussels as 663
“sandy” or “shell” habitats requires the definition of limit 664
values, e.g., in terms of relative weight of shells or grain size 665
parameters. Our example contemplates (ground-truthed) 666
side-scan sonar images since they generally allow a clear 667
distinction of hard and soft beds based on their tonal con- 668
trast (Table 3). The desired state corresponds to ‘less than 669
25% of shell beds within the subset area’. More complex 670
proactive approaches could rely on the outputs from mod- 671
els of mussels growth and deposition (e.g., Maar et al., 672
Figure 3: Implementation of the operational phase designed to control the development of mussel beds within the project area (Tactical objective). The total area (plan view) is 100 km2 and includes 176 MREdevices (dots). Ground-truthed side-scan sonar surveys are conducted in a 10 km2area (dashed line) to distinguish sandy bed (white) from shell beds (dark grey). If shell beds represents > 25% of the survey area, environmental dredging is performed along parallel corridors over the entire project area to remove the mussel layer (examples of these corridors are shown in light grey).
onmental dredging guided by video to remove the excess of
674
deposited layer of material and restore the original habitat
675
along corridors in between the devices (Table 3;Figure 3).
676
Such a mitigation option requires strong awareness
regard-677
ing the financial implication of its implementation. For
678
example, economic feasibility will be dependent of the
re-679
quired dredging frequency (every year? every ten years?),
680
estimated based on modelling tools (e.g., coupled
hydro-681
dynamic and mussel deposit models). Careful economic
682
assessment whether the cost associated with a measure can
683
be justified by the environmental gain is crucially
import-684
ant. In the end it might be concluded that environmental
685
dredging is too expensive to be implemented, in which case
686
more reachable objectives must be set at the start of the
687
FoR process. Another issue could be that the proposed
688
intervention (environmental dredging) itself is hampering
689
the strategic objective (preservation of the existing sandy
690
habitat). Such potential points of contention highlights
691
the importance of adopting an iterative approach when
for-692
mulating the strategic and operational objectives.
693
Any impact of the project on migrating Common Eider
694
ducks must be analysed at a population level. As a
stra-695
tegic objective, the project activities should ‘preserve the
696
population of Common Eider ducks passing over the re- 697
gion’ (Table 3), where the extension of the “region” is 698
clearly defined. One way of meeting this objective could be 699
‘to prevent any increase of their mortality rate related to 700
the project activities’ (Tactical objective,Table 3). At the 701
QSCstage, this objective may lead to the development of 702
a parameter representing the percentage of the duck pop- 703
ulation risking collision with the structures. For selected 704
periods, the current state can be predicted with a level of 705
certainty (for example, 95% confidence interval) based on 706
stochastic models built from compilations of observations 707
(Figure 4; Table 3). In particular, reliable model predic- 708
tions require estimates of the number of individual Eider 709
duck collisions within the project area and of their fluxes 710
throughout the project area (e.g., Band, 2000; Petersen 711
et al.,2006; Troost,2008). Collision estimates can be ob- 712
tained using non-contact sensors (e.g., acoustic sensors, 713
microphones) deployed on a number of turbines, especially 714
during periods of heavy migration (spring and autumn). 715
Likewise, surveillance radars are useful to measure the 716
volume of bird movement and to track their altitude and 717
trajectories through the area (visual observations are also 718
Figure 4: Illustration of the definition of the current state for selected periods of Eider duck migration. Observations (radar and collision monitoring data) are compiled to build a stochastic model. The current state is derived from model prediction of the percentage of bird risking collision with the turbines at a 95% confidence interval.
tion). The desired state (Table 3), for example ‘no more
720
than 5% of the population predicted to collide’, should be
721
fixed considering the effects of the increased mortality on
722
the population over longer time periods (Fox et al.,2006).
723
As a proactive intervention measure, it could be possible to
724
shut down turbines during the periods when the indicator
725
threshold is exceeded (Table 3).
726
With respect to water pollution, one obvious strategic
ob-727
jective is ‘to preserve favourable water quality for local
728
flora and fauna’ (Table 3). One of the various tactics that
729
can contribute to meet this objective is to ensure a ‘timely
730
proactive maintenance of the operating devices containing
731
oil’, e.g., gear boxes, hoses, in order to prevent oil leaks
732
from happening (Table 3). In this case, theQSCcan make
733
use of the maintenance task which is generally established
734
for each component (based on reliability figures like failure
735
rate) for preventive maintenance throughout the duration
736
of the project (Table 3). The comparison between the
de-737
sired and current states is then performed by comparing
738
the planned replacement of components with the actual
739
recorded replacement. In addition to the preventive
re-740
placement of device components, the mitigation
proced-741
ure may request to revise the maintenance strategy (e.g.,
742
frequency) in order to avoid future oil leaking from the
743
relevant component (see the example in Figure 5).
Com-744
pared to the harbour porpoise example this FoR is likely
745
to achieve its tactical objective. The strategic objective,
746
however, remains vulnerable as other potential causes for
747
leakage are not addressed. This issue should be addressed
748
with the definition of additional tactical objectives.
749
5. Conclusions and recommendations
750
It is in the interest of the incipient offshoreMREindustry
751
to carefully address the environmental impacts induced
752
by large-scale projects. This task is presently difficult to
753
achieve satisfactorily due to large knowledge gaps about
754
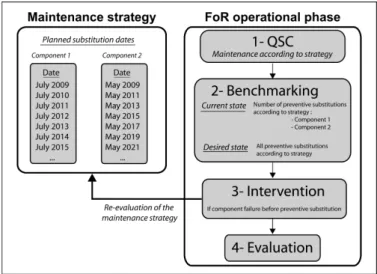
Figure 5: Example of the operational phase of aFoR(right panel) designed for a proactive maintenance of components containing oil (tactical objective). The maintenance strategy (left panel) defines the dates of component substitution (for simplicity, two components are considered). TheQSC (Stage 1) is based on the maintenance strategy to indicate impacts during the benchmarking procedure (Stage 2). If failure occurs before the planned substitution of the components, the intervention procedure (Stage 3) requires a revision of the maintenance strategy.
impacts. Thorough long-term (years) EMPs should be 755
implemented in order to enhance scientific knowledge re- 756
garding impacts. The implementation of environmental 757
indicators within these programs is recommended as they 758
generally describe in a convenient (simplified) manner the 759
status of (complex) systems and thus may facilitate man- 760
agement decisions. 761
For the implementation of indicators within EMPs, the 762
FoR approach is advocated over other frameworks due 763
to its prescriptive nature. The FoR provides clear guid- 764
ance for the selection of indicators that are linked dir- 765
ectly to specific management issues. This framework also 766
makes sure that predefined intervention procedures will be 767
implemented if mitigation or remediation actions are re- 768
quired. 769
The examples presented in this contribution describe the 770
use ofFoRas a remediation tool. However, the most effect- 771
ive options to mitigate environmental impacts are gener- 772
ally available during the design phase of the project, i.e., 773
during the selection of the site, of the technology to be 774
used, and of the project layout. It is recommended to im- 775
plement theFoRapproach at various phases of the lifecycle 776
of a project. 777
The development of a FoR framework is recommended 778
for each of the potential environmental issues. The pos- 779
sible interaction between management issues from differ- 780
ent FoRs must be addressed. In particular, future re- 781
search should seek to optimise the collaborative effort not 782
only between scientists of distinct disciplines, but also 783
isations, nature conservation organisations, stakeholders,
785
managers, policy makers). Furthermore, the development
786
of severalFoRs may require the integration of various time
787
and space scales. It is therefore also recommended to
788
investigate the articulation between the distinct
manage-789
ment scales (see Mulder et al.,2006).
790
The occurrence of many environmental issues may also
791
lead to the development of FoRs with conflicting
object-792
ives. In such a case, optimising a particular ESImay be
793
detrimental to other objectives. Hence, it would be
help-794
ful to have some methods that help to decide what the
795
best option is. Some tools should be developed to rank or
796
prioritise theFoRwith conflicting objectives.
797
Furthermore, it is important that an open policy
regard-798
ing data access is implemented at a national, European
799
and international level (e.g., the “OpenEarth” approach;
800
Van Koningsveld et al.,2005b;Baart et al.,2012;De Boer
801
et al.,2012; Van Koningsveld et al., 2013). Such a policy
802
would be highly beneficial for research about
environ-803
mental impacts, and for the industry to establish
cost-804
efficientEMPs while demonstrating a strong commitment
805
toward environmental protection.
806
Management decisions may have strong ecological
influ-807
ences and substantial financial implications. This fact
of-808
ten leads to reluctance to embrace new, unproven
method-809
ologies. It is therefore essential to rigorously test theFoR
810
approach against real cases in order to firmly demonstrate
811
how it can improve the management of specific
environ-812
mental issues. At last, there should be a strong awareness
813
of the potential financial implications of the managing
de-814
cisions proposed in the various indicator schemes. As a
815
final recommendation, any set of indicators should be
al-816
ways, as much as possible, scrutinized and tested for
prac-817
tical applicability in relation to the overall protection
ob-818
jective.
819
6. Acknowledgements
820
EG, ´OF and CC acknowledge support from the MARINA
821
(Marine Renewable Integrated Application) Platform
pro-822
ject, a Collaborative Project of the 7th Framework
Pro-823
gramme (Grant agreement number: 241402).
824
The work by MvK was executed as part of the Marine
825
Ingenuity program that has been established by Van Oord
826
to stimulate innovation and knowledge transfer.
827
References
828
Andrade, H., Renaud, P.E., 2011. Polychaete/amphipod ratio as an
829
indicator of environmental impact related to offshore oil and gas
830
production along the norwegian continental shelf. Marine
Pollu-831
tion Bulletin 62(12), 2836–2844. doi:10.1016/j.marpolbul.2011.
832
08.032.
833
Athanas, A.K., McCormick, N., 2013. Clean energy that safeguards 834
ecosystems and livelihoods: Integrated assessments to unleash full 835
sustainable potential for renewable energy. Renewable Energy 49, 836
25–28. doi:10.1016/j.renene.2012.01.073. 837
Baart, F., De Boer, G., De Haas, W., Donchyts, G., Philippart, M., 838
Van Koningsveld, M., Plieger, M., 2012. A comparison between 839
WCS and OPeNDAP for making model results and data products 840
available through the internet. Transactions in GIS 16(2), 249– 841
265. doi:10.1111/j.1467-9671.2012.01312.x. 842
Bald, J., Del Campo, A., Franco, J., Galparsoro, I., Gonz´alez, 843
M., Liria, P., Muxika, I., Rubio, A., Solaun, O., Uriarte, A., 844
Comesa˜na, M., Cacabelos, A., Fern´andez, R., M´endez, G., Prada, 845
D., Zubiate, L., 2010. Protocol to develop an environmental im- 846
pact study of wave energy converters. Revista de Investigaci´on 847
Marina 17(5), 62–138. 848
Band, W., 2000. Windfarms and birds: Calculating a theoretical col- 849
lision risk assuming no avoiding action. Technical Report. Scottish 850
Natural Heritage (SNH). URL: http://www.snh.gov.uk/docs/ 851
C205425.pdf. p. 10. 852
Bedard, R., Jacobson, P.T., Previsic, M., Musial, W., Varley, R., 853
2010. An overview of ocean renewable energy technologies. The 854
Oceanography Society 23(2), 22–31. URL:http://www.tos.org/ 855
oceanography/archive/23-2_bedard.pdf. 856
Boehlert, G.W., Gill, A.B., 2010. Environmental and 857
ecological effects of ocean renewable energy development: 858
a current synthesis. The Oceanography Society 23(2), 859
68–81. URL: http://ir.library.oregonstate.edu/xmlui/ 860
bitstream/handle/1957/16152/23-2_boehlert_hi.pdf. 861
Borja, A., Galparsoro, I., Solaun, O., Muxika, I., Tello, E.M., Uri- 862
arte, A., Valencia, V., 2006. The European Water Framework 863
Directive and the DPSIR, a methodological approach to assess 864
the risk of failing to achieve good ecological status. Estuarine, 865
Coastal and Shelf Science 66(1-2), 84–96. doi:10.1016/j.ecss. 866
2005.07.021. 867
Brostrom, G., 2008. On the influence of large wind farms on the 868
upper ocean circulation. Journal of Marine Systems 74(1-2), 585– 869
591. doi:10.1016/j.jmarsys.2008.05.001. 870
BSH, 2007. Investigation of the Impacts of Offshore Wind Turbines 871
on the Marine Environment (StUK 3). Technical Report BSH- 872
Nr. 7003. Bundesamt f ur Seeschiffahrt und Hydrographie (BSH). 873
Hamburg and Rostock. URL:http://www.bsh.de/en/Products/ 874
Books/Other_publications/Stuk-eng.pdf. p. 57. 875
Bulleri, F., Airoldi, L., 2005. Artificial marine structures facilitate 876
the spread of a non-indigenous green alga, Codium fragile ssp. 877
tomentosoides, in the north Adriatic Sea. Journal of Applied Eco- 878
logy 42(6), 1063–1072. doi:10.1111/j.1365-2664.2005.01096.x. 879
Butterfield, S., Musial, W., Jonkman, J., 2007. Engineering Chal- 880
lenges for Floating Offshore Wind Turbines, Offshore wind confer- 881
ence. Technical Report. National Renewable Energy Laboratory. 882
Copenhagen, Denmark. P. 13. 883
CEFAS, 2004. Offshore Wind Farms: Guidance Note for Environ- 884
mental Impact Assessment in Respect of FEPA and CPA Require- 885
ments. Technical Report. Marine Consents and Environment Unit 886
(MCEU). P. 48. 887
Ciavola, P., Ferreira, O., Haerens, P., Van Koningsveld, M., Armar- 888
oli, C., 2011. Storm impacts along European coastlines. Part 2: 889
lessons learned from the MICORE project. Environmental Science 890
& Policy 14(7), 924–933. doi:10.1016/j.envsci.2011.05.009. 891
CMACS, 2003. A baseline assessment of electromagnetic fields gen- 892
erated by offshore windfarm cables. Technical Report. Centre for 893
Marine & Coastal Studies CMACS. COWRIE Report EMF-01- 894
2002 66, p. 71. 895
Cox, T.M., Read, A.J., Solow, A., Tregenza, N., 2001. Will harbour 896
porpoises (Phocoena phocoena) habituate to pingers? Journal of 897
Cetacean Research and Management 3(1), 81–86. 898
Culik, B.M., Koschinski, S., Tregenza, N., Ellis, G.M., 2001. Reac- 899
tions of harbour porpoises Phocoena phocoena and herring Clupea 900
harengus to acoustic alarms. Marine Ecology Progress Series 211, 901
255–260. 902
Danish Energy Authority, 2009. Offshore Wind Farms and the Envi- 903