Prokaryotic picoplankton distribution within the oxygen minimum zone
of the central Mexican Pacific across environmental gradients
Marine picophytoplankton has become an important
issue to understand the global ecology of phototrophic
forms, due to its wide distribution and contribution to
biomass and productivity. We studied the abundance,
distribution and signature pigments of the prokaryote
picophytoplankters
Prochlorococcus
and
Synechococcus
during an oceanographic cruise (26 April to 7 May,
2011) in the central Mexican Pacific, a relatively
poorly-known oxygen minimum zone (OMZ), and the effect
of three environmental gradients.
Prochlorococcus
and
Synechococcus
abundances were comparable with those
found in other tropical areas (0.17 to 30.37 X 10
4cells
mL
-1, and 0.9 to 30.97 X 10
4cells mL
-1, respectively).
Prochlorococcus
abundances reached highest numbers
in deeper waters, often coinciding with the second
deep
in situ
fluorescence (and chlorophyll α) maxima,
at oceanic stations, below the nitratecline, whereas
Synechococcus
abundances were higher at subsurface
waters and its concentration maxima usually coincided
with the subsurface
in situ
fluorescence maxima, with
slightly higher abundances in coastal stations. Statistical
analyses support significantly these results. Distribution
of divinyl-chlorophyll α was erratic along the water
column and occasionally coincided with the deep
in
situ
fluorescence maxima, whereas the distribution
of zeaxanthin usually followed that of chlorophyll α
and the abundances of
Synechococcus
, and peaked
together. These results are similar to those previously
found in the study area and in more temperate zones,
and also to the general trend in OMZ, but confirm that
the second deep chlorophyll α maxima are attributed to
high
Prochlorococcus
densities. We additionally found
the abundance and distribution of
Prochlorococcus
and
Synechococcus
strongly driven by the environmental
gradients observed.
A
bstrAct
Zuleima Santana-Vega
1, David Uriel Hernández-Becerril
1*, Alejandro R. Morales-Blake
2,
Francisco Varona-Cordero
1, Martín Merino-Ibarra
11 Instituto de Ciencias del Mar y Limnología - Universidad Nacional Autónoma de México (Ciudad Universitaria, Coyoacán, México, D.F. 04510)
2 Facultad de Ciencias Marinas - Universidad de Colima (Manzanillo, Colima 28868, Mexico)
*Corresponding author: [email protected]
Descriptors:
Mexican
Pacific,
Oxygen
minimum zone,
Prochlorococcus
,
Prokaryote
picophytoplankton, Synechococcus
.
O picophytoplankton marinho tornou-se uma questão
importante para compreender a ecologia global das for
-mas fototróficas, devido à sua ampla distribuição e
con-tribuição para a biomassa e a produtividade. Estudamos
os pigmentos de abundância, distribuição e assinatura do
picofitoplâncton procarionte
Prochlorococcus
e
Synecho-coccus
durante um cruzeiro oceanográfico no Pacífico
central mexicano, uma zona mínima de oxigênio relati
-vamente poco conhecida (OMZ) e o efeito de três gra
-dientes ambientais. As abundâncias de
Prochlorococcus
e
Synechococcus
foram comparáveis às encontradas em
outras áreas tropicais (0.17 to 30.37 X 10⁴ células
mL-1, e 0.9 to 30.97 X 10⁴ células mL-mL-1, respectivamente).
As abundâncias de
Prochlorococcus
atingiram o maior
número em águas mais profundas, coincidindo
frequente-mente com a segunda intensidade de fluorescência in situ
profunda (e clorofila a), em estações oceânicas, abaixo da
nitratoclina, enquanto as abundâncias de
Synechococcus
foram maiores nas águas de subsuperficie e sua
concen-tração máxima geralmente coincidiu com os máximos de
subsuperficie de fluorescência in situ, com abundâncias
ligeiramente mais altas nas estações costeiras. As análises
estatísticas suportam significativamente esses resultados.
A distribuição da divinil-clorofila a foi errática ao longo
da coluna de água e coincidiu ocasionalmente com os
máximos de fluorescência in situ profundos, enquanto
que a distribuição da zeaxantina seguiu geralmente a da
clorofila a e as abundâncias de
Synechococcus
e atingiu
o pico. Estes resultados são semelhantes aos encontrados
anteriormente na área de estudo e em zonas mais
tempera-das, e também à tendência geral na OMZ, mas confirmam
que a clorofila profunda a maxima é atribuída a altas
den-sidades de
Prochlorococcus
. Além disso, encontramos a
abundância e distribuição de
Prochlorococcus
e
Synecho-coccus
fortemente conduzida pelos gradientes ambientais
observados.
r
esumo
Descritores:
Pacífico Mexicano,
Prochlorococcus
,
INTRODUCTION
Marine picophytoplankton (less than 2 µm in size) are important a very important issue to understand the global ecology of phototrophic forms and may contribute up to 70% of the phytoplankton biomass and productivity, and can dominate in tropical, subtropical and oligotrophic waters
worldwide (Fogg, 1986, 1995; Raven, 1998; Partensky et al., 1999; Buitenhuis et al., 2012). Picophytoplankton
is constituted by both eukaryotes and prokaryotes, being
the coccoid unicellular picocyanobacteria Synechococcus
and Prochlorococcus the smallest and most widespread phototrophic organisms in the planet (Scanlan and West,
2002; Buitenhuis et al., 2012; Massana and Logares, 2013; Biller et al., 2015).
The genera, Synechococcus and Prochlorococcus, are closely related and may coexist in the oceanic habitats,
but they may occupy different niches, ecotypes and clades (Scanlan and West, 2002; Ting et al., 2002; Bouman et al., 2006; Biller et al., 2015). These differences are
mainly related to three features: temperature restrictions,
differential photosynthetic light-harvesting system, and differential assimilation of nutrients, particularly sources of nitrogen (Palenik, 2001; Ting et al., 2002; Rocap et al.,
2003). Thus, it is evident that environmental gradients of light, nutrients and temperature play a key role in determining picocyanobacteria community structure,
especially in vertical profiles of the water column (Fuller
et al., 2006).
In Mexican waters, the first insight of the importance
of the picophytoplankton to total phytoplankton biomass and productivity was most possibly a study
conducted in the Gulf of California by Berman (1975).
A pioneer evaluation of the abundance and distribution of Synechococcus in the Mexican Pacific was made by
Díaz and Maske (2000), whereas considerably high
densities of Prochlorococcus were detected deeper
than an oxygen minimum layer, in the tropical Mexican
Pacific (in front of Acapulco) by Goericke et al. (2000). More recently, Lara-Lara and Bazán-Guzmán (2005)
found a variable and yet important contribution of the picophytoplankton to the biomass and primary production
in waters from the Mexican Pacific, then followed by
analysis of the prokaryote biomass (Prochlorococcus
and other cyanobacteria) and its contribution to the total
phytoplankton chlorophyll α, which reached between
60-80% in the tropical Mexican Pacific (Almazán-Becerril and García-Mendoza, 2008) and approximately 70% in
the western coasts off Baja California, Mexican Pacific (Almazán-Becerril et al., 2010). Also, in the southern Gulf
of Mexico, the general structure of the photosynthetic picophytoplankton (both prokaryotes and eukaryotes) was
studied using different protocols and approaches such as epifluorescence and transmission electron microscopy, flow cytometry, biomarker photosynthetic pigments and
molecular probes, and its relationship with environmental
conditions (Hernández-Becerril et al., 2012; Aquino et al.,
2013).
The Oxygen Minimum Zones (OZM’s) are certain areas of the oceans which have a very low concentration
of Dissolved Oxygen very close to surface. One important area is the Eastern North Pacific (ENP). It was recently
hypothesized that OMZ’s are going to spread in the coming
decades as a consequence of global climate change and
that are also keys to understanding the present unbalanced nitrogen cycle and the oceans’ role on atmospheric
greenhouse control (Paulmier and Ruiz-Pino, 2009). The central part of the Mexican Pacific (e.g. between the
entrance to the Gulf of California to the most northern
limit of the Gulf of Tehuantepec) is situated in the Eastern Tropical North Pacific (ETNP) and has been poorly characterized. Paulmier and Ruiz-Pino (2009) mentioned that the ETNP is one the less known OZM areas. In other areas of the world with an OMZ (off Chilean waters)
the genus Prochlorococcus forms a deep chlorophyll α
maximum (Lavin et al., 2010; Ulloa et al., 2012).
In this study, recognition, abundance and distribution of the prokaryotic picophytoplankton are investigated
in the first time for the central Mexican Pacific, located
within an oxygen minimum zone (OMZ), where
previous studies (Cepeda-Morales et al., 2009) had
detected recurrent deep chlorophyll maximum layers in oceanic stations, which were unempirical attributed
to high Prochlorococcus populations. We also provide
information on the differential distribution (from the coast
to the ocean, latitudinal and vertical) of Synechococcus
and Prochlorococcus and their pigment signatures across environmental gradients.
MATERIAL AND METHODS
Study area
This study was conducted in an area of the tropical
and important pelagic fisheries, enhanced by different
mechanisms of natural fertilization such as mesoscale phenomena (plumes and eddies) and upwellings, and
shallow thermoclines reducing stratification and keeping relatively high phytoplankton biomass values
(López-Sandoval et al., 2009). Another interesting point is that this area is located within an oxygen minimum zone
(Paulmier and Ruiz-Pino, 2009; Ulloa et al., 2012), and some hydrographic features might affect the vertical
distribution of biological properties such as chlorophyll α
(Cepeda-Morales et al., 2009).
Hydrographic data and water sampling
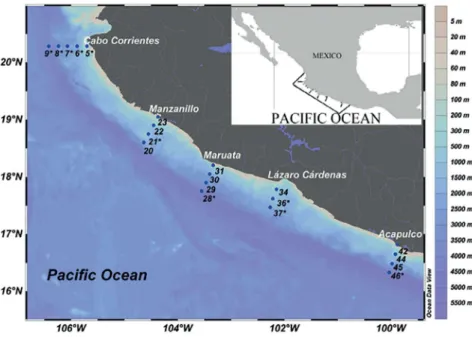
Samples were collected at forty-seven fixed stations during the oceanographic cruise “MareaR III”, carried out from 26 April to 7 May 2011, on board the R/V “El Puma”, considering five zones: Cabo Corrientes (CC), Jalisco, Bays of Manzanillo-Santiago (BMS), Colima, Maruata (MAR) and Lázaro Cárdenas (LC), Michoacán, and Acapulco (ACA), Guerrero (Figure 1). Seawater and
hydrographic data (temperature, salinity and dissolved
oxygen) were obtained in vertical profiles using a CTD-Rosette system with 10-L Niskin bottles (Seabird SBE 911 Plus), fitted with an additional sensor of fluorescence (Wet Labs ECO-AFL/FL). Transects perpendicular to
the coastline of three to five stations were set for each of the five zones (Figure 1). Five sampling depths (usually 5, 20, 30, 40 and 70 or 100 m), according to the in situ fluorescence (chlorophyll α) maximum layers or peaks:
(A) for picoplankton analysis, 4.5 mL were transferred in cryovials and fixed with 1% glutaraldehyde, (B) for phytoplankton pigments, 1 L was filtered with a vacuum pump through GF/F (47 mm diameter) membranes, (C)
for discrete measurements of chlorophyll α, an additional
1 L was filtered with a vacuum pump and added few
drops of MgCO3. Samples (A), (B) and (C) were stored in
liquid Nitrogen or in a -20° C freezer, and (D) for nutrient
analysis, 20 mL were held in polypropylene containers,
after filtration with 0.45 and 0.22 μm (Millipore™ type HA) nitrocellulose membranes, and kept frozen (-4° C). Information on remote sensing was obtained from NASA Ocean Biology (OB. DAAC), MODIS Ocean Color Data (https://earthdata.nasa.gov/about/daacs/daac-obdaac,
accessed on 2016/07/07).
Laboratory analysis
In order to recognize and quantify picophytoplankton populations, flow cytometry analyses were conducted,
following the protocol of Marie et al. (1999). Water samples were thawed at room temperature and then
Figure 1. Map of the study area, showing the sampling stations along transects in five zones. Stations represented in vertical profiles of various
injected into a FACSCalibur (Becton Dickinson) flow
cytometer. The following parameters were considered:
forward light scatter (FSC, E01), side light scatter (SSC, 450), and four fluorescences (FL1, 650 green, FL2, 650 orange, FL3, 650 red and FL4, 650 red). Additionally, 0.95 and 2.0 µm fluorescent microspheres (Becton Dickinson)
were used for calibration. Picophytoplankton populations
were identified and quantified by analyzing all cytograms using the software Cyflogic 1.2.1.
Phytoplankton pigments were analyzed by reverse-phase HPLC (Waters 2695), following the proposals of Vidussi et al. (1996), once the pigment extraction in 90% acetone was made with the aid of filter trituration and clarified by centrifugation. We used a reverse-phase C8 column (RP-C8, Waters Sunfire), and two mobile phases: A (70:30, methanol: 0.5 N ammonium acetate, aq.), and B (methanol), initially 75% A and 25% B, then from 1 minute 50% of A and B, and then changed to 0% A and 100% B in 15 minutes, followed by the initial proportion 75% A and 25% B in minute 19 (Vidussi et al., 1996). 200 µL of each extract was injected to the HPLC system.
Only the pigments divinyl chlorophyll α (specific pigment for Prochlorococcus) and zeaxanthin (marker pigment for
Synechococcus) (Jeffrey et al., 1997) were considered and quantified in this study. Standards of these two pigments were obtained from DHI Lab Products (Hoersholm, Denmark).
Chlorophyll α was extracted from filters using 4
mL of acetone, kept at 4° C during 24 h, centrifuged to
recover the supernatant. Subsamples were analyzed by
a spectrophotometer at absorbances 750, 665, 664, 647, 645 and 630 nm, and then appropriate calculations of its concentration were calculated following Jeffrey and Humphrey’s (1975) equations.
Nutrients samples were analyzed on a Skalar San Plus II segmented-flow continuous auto-analyzer, using the standard nutrient methods as adapted by Grasshoff et al.
(1983) and the circuits suggested by Kirkwood (1994).
Data analysis
Sampling map was generated using Ocean Data View (version 4.7.10) with the DIVA algorithm for
variable resolution in a rectangular grid. (Schlitzer, 2016). Multivariate analyses were performed in order to detect
spatial differences in the abundances of the prokaryotic
picophytoplankton, and also to evaluate the contribution of
each taxon to the spatial variability. Bray-Curtis similarity
indices were calculated, after treatment of the original
values (squared roots transformation), and then used to generate a non-metric multi-dimensional scaling (nMDS)
analysis, in combination with a Cluster grouping analysis based on the unweighted pair group method (Clarke
and Warwick, 2001). Both nMDS and Cluster analyses
were performed using software Primer 6.1.4 (Clarke and Gorley, 2006). Additionally, a Spearman’s correlation analysis was performed to assess the association between environmental variables and abundances of prokaryotic picophytoplankton and was represented in a correlogram, for this we used the online software of Kassambara (2016).
RESULTS
Hydrography and oceanographic conditions
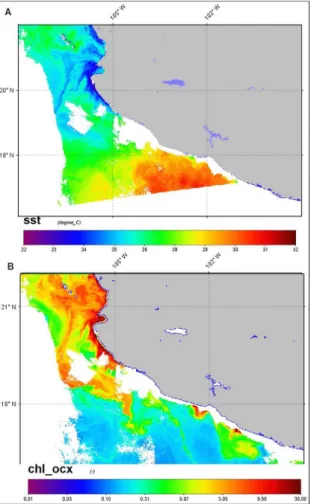
The general hydrographical conditions showed a conspicuous gradient from the north zone (CC) to the
south zone (ACA). Surface water was colder (about 24°
C) in the north zone than in the south zones (at station
46 surface temperature was close to 30° C), and surface
chlorophyll α was associated to the SST distribution, with
higher concentrations in the northern zone (Figures 2A, B). Shallower thermoclines in the northern zones were located below or at 20 m depth (CC and BMS) (Figures
3, 4, Table 1), whereas thermoclines were deeper (up to
30 m) in the south zones (LC and ACA) (Figure 4, Table 1). Dissolved oxygen followed a similar pattern to the
thermoclines: surface concentrations decreased very
quickly within the first 20 m depth in the north zone
(CC), but the oxycline was deeper towards to south zones,
notably at stations 36 (LC) and 46 (ACA) (Figures 3, 4). Additionally, concentrations of NO3 were low in surface
layers but increased rapidly (nutriclines) at approximately 20 m depth in the north zone (stations 6 and 8, situated in CC), but at about 40 m depth in south (stations 28, 36
and 46) (Figures 3, 4, Table 1). Values and distribution
of salinity did not change considerably and they are not shown.
All subsurface fluorescence maxima were located
below the main thermoclines, although they were very
variable: ranging from 10-15 m depth in the CC zone, about 18-28 m depth in the BMS zone, between 20 and 30 m depth in MAR, around 25-40 m depth in LC zone, and between 28 and 40 m depth in ACA (Figures 3, 4). In more
oceanic stations (stations 9, 21, 28, 37 and 46) and few
intermediate stations (station 6, CC), deep fluorescence
maxima were detected, almost all of them having less
Figure 2. A. Spatial patterns of remote sensed Sea Surface
Temperature (SST), and B. Chlorophyll α (MODIS-Aqua), for day 28-04-11, cloudy areas are colored in white.
of those), except at station 28, where the deep maximum is nearly 80% the concentration of the subsurface one
(Figure 4). Discrete measurements of chlorophyll α followed the vertical distribution of in situ fluorescence
profiles, and their maxima were located at about the same depth of that of the fluorescence maxima (Figures 3, 4).
Transects of the five zones also support the different
hydrographic and oceanographic conditions found in the
study area. The isotherm of 25° C raised close to coast, at station 6 in the zone CC (Figure 5A), whereas the isotherm of 26° C also raised close to the coast, at station 23 in the zone BMS (Figure 5B), both indicating weak upwellings,
these two transects are located in the north portion of the
study area. The transect of MAR (Figure 5C) showed an
oceanographic structure with a nucleus of warm water
(isotherm of 29° C) concentrated within stations 29
and 30, where the presence of an oceanographic eddy is believed to occur. The other two transects (LC and
especially ACA) appeared more stable, with well-stratified water up to 40 m depth (Figures 5D, E). On the other
hand, the concentration of chlorophyll α indicated by the
in situ fluorescence, diminished considerably from north
(CC) to south (ACA) zones, always showing maximum concentrations in coastal areas, at subsurface, and deeper
high concentrations in more oceanic areas (Figures 5A-E).
Prokaryote picophytoplankton abundances
and distribution
Total cell densities of both Prochlorococcus and
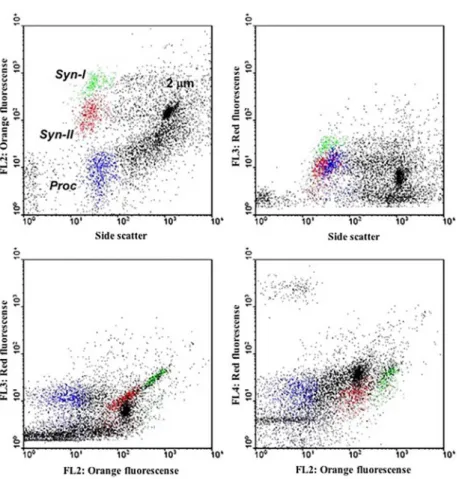
Synechococcus were calculated from “populations” having slightly dissimilar features in flow cytometry (Supplementary Figure 1), and ranged from 0.17 to
30.37 X 10⁴ cells mL-1, and 0.9 to 30.97 X 10⁴ cells
mL-1, respectively (Table 1). The maximum density of
Prochlorococcus was detected at station 7 at 74 m depth
(CC), whereas of Synechococcus was found in station 34
at 20 m depth (LC).
The distribution of Prochlorococcus and
Synechococcus densities was very variable and changed with latitude, proximity to the coast, and through the water column.
General tendencies of Prochlorococcus abundances
were: highest densities found in north zones (CC and
BMS) which were decreasing toward the south zones (M, LC and ACA) (Table 1, Figures 5A-E), highest abundances towards more oceanic stations (Figures 5A-E), and highest densities lower than 30 m depth (commonly between 75
and 110 m depth, especially in oceanic stations, although
there is one exception) (Figures 3, 4). On the other hand, Synechococcus abundances followed a general pattern of being higher at surface and subsurface layers and lower with depth.
The vertical distribution of Prochlorococcus and
Synechococcus densities was very variable, although four general patterns were observed: (1) Highest densities of Prochlorococcus in deeper layers (75 m
at station 8 and 50 m at station 9) and Synechococcus abundances maxima found in surface layers (first 6 m) in the north zone CC (stations 8 and 9) (Figures 3A, C), (2) Densities of Prochlorococcus increasing with
depth and Synechococcus abundances maxima at 20 m
in CC (station 6), BMS (station 21) and LC (station 31) (Figures 3C, I), (3) Prochlorococcus densities increasing
with depth in MAR (stations 28 and 29), LC (station
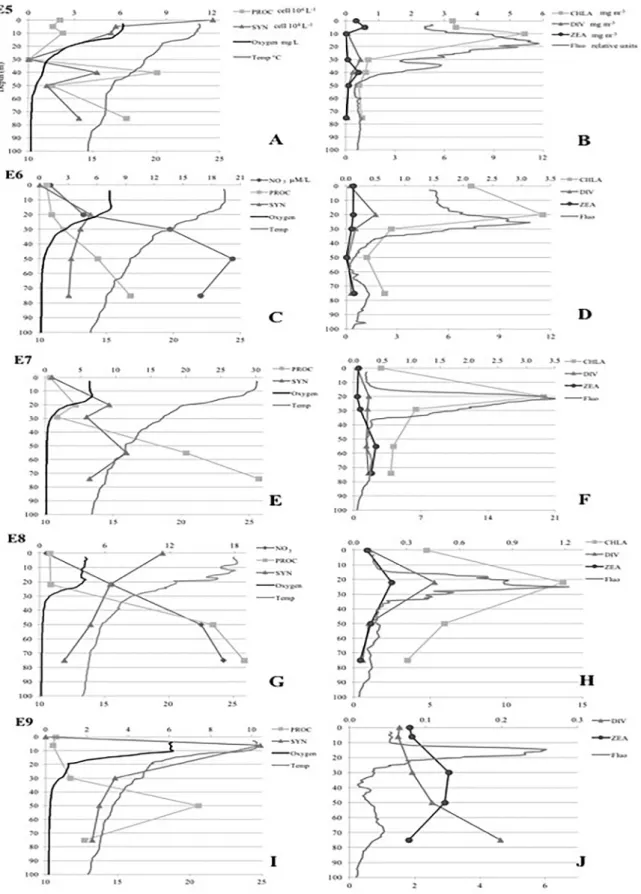
Figure 3. A, C, E, G, I. Vertical profiles of physical-chemical variables (temperature, dissolved oxygen, Nitrate concentrations) and Prochlorococcus
and Synechococcus abundances. B, D, F, H, J. Vertical profiles of in situ fluorescence, chlorophyll α, and signature pigments (divinyl-chlorophyll
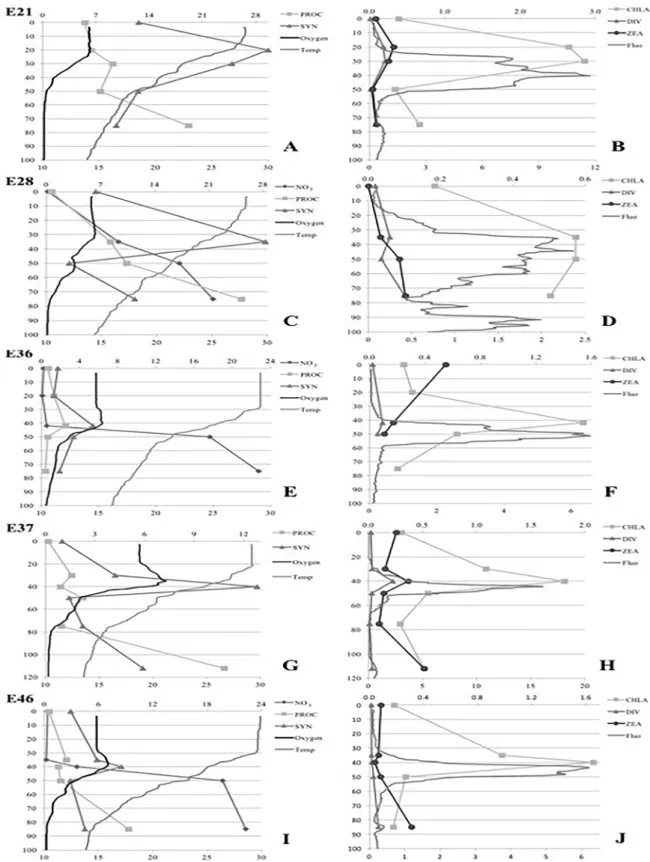
Figure 4. A, C, E, G, I. Vertical profiles of physical-chemical variables (temperature, dissolved oxygen, Nitrate concentrations) and Prochlorococcus
and Synechococcus abundances. B, D, F, H, J. Vertical profiles of and in situ fluorescence, chlorophyll α, and signature pigments (divinyl-chlorophyll
Variable CC BMS MAR LC ACA Thermocline
depth (m) 10-15 18-20 22-30 25-40 28-40
Nitratecline 15-20 20-25 22-35 30-42 30-40
Divinyl-chlorophyll α mg m-3 0.03-0.57 0.02-0.25 0.01-0.27 0.01-0.22 0.01-0.11
Zeaxanthin 0-0.57 0-1.09 0-0.29 0-0.55 0-0.31
Prochlorococcus
x 104 cells mL-1 0.36-30.37 3.20-19.15 0.55-25.14 0.17-10.79 0.53-9.30
Synechococcus 0.90-12.06 6.67-29.59 1.54-28.23 1.01-30.97 1.50-12.05
Table 1. Hydrographic characteristics (depth of the main thermoclines and nitrateclines) and minimum-maximum intervals
of signature pigments (divinyl-chlorophyll α and zeaxanthin) and abundances (cell numbers) of Prochlorococcus and
Synechococcus found in the five zones of the study area. Zones are: CC= Cabo Corrientes, BMS= Bahías Manzanillo-Santiago, M= Maruata, LC= Lázaro Cárdenas, ACA= Acapulco.
Figure 5. Transects of five zones showing distribution of isotherms, in situ fluorescence (in relative units), and Prochlorococcus (Proc) and
Synechococcus (Syn) abundances. Letters denote the five zones: A=
Cabo Corrientes, B= Bahías Manzanillo-Santiago, C= Maruata, D= Lázaro Cárdenas, and E= Acapulco.
maxima densities between 30 and 42 m (Figures 4C, G, I), and (4) Vertical distributions of Prochlorococcus and
Synechococcus densities were similar at stations 5, 7 and 36 and in station 36 and followed chlorophyll α distribution at station 36, peaking at 41 m depth (Figures 3A, E, 4E).
Phytoplankton pigments
The concentrations of the signature pigments of both
Prochlorococcus and Synechococcus ranged from 0.01 to
0.57 mg.m-3 for divinyl-chlorophyll α, and from undetectable
to 1.09 mg.m-3 for zeaxanthin. The latitudinal and vertical distributions of the signature pigments did not usually follow that of the respective Prochlorococcus and Synechococcus abundances. At station 8 (CC) the fluorescence maxima,
discrete chlorophyll α, divinyl-chlorophyll α and
zeaxanthin coincided (22 m depth), whereas at the oceanic
station 9 (CC), divinyl-chlorophyll α increased with depth
and reached to a maximum concentration at 75 m depth coinciding with the fluorescence maximum (Figures 3H, J). At station 21 (BMS), divinyl-chlorophyll α and zeaxanthin followed a similar pattern, which was coincided with that of chlorophyll α (Figure 3B). At oceanic station 28 the vertical
distributions of Prochlorococcus abundances and
divinyl-chlorophyll α were also similar (Figure 4D). At station 37
(LC), peaks of fluorescence, discrete chlorophyll α and
zeaxanthin coincided at 40 m and 110 depths (Figure 4H).
Statistical analysis results
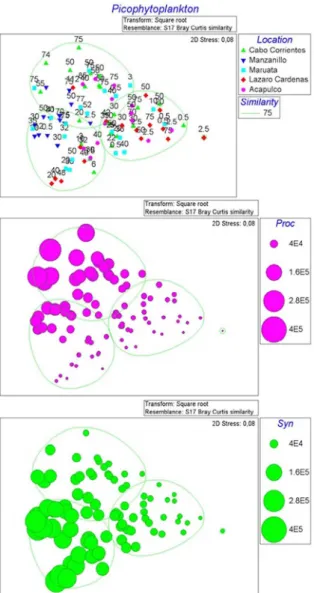
The nMDS analysis, based on picophytoplankton
abundances by sample, showed a reliable (0.08 stress value)
ordination (Figures 6 A-C). This stress level corresponds to an “adequate” representation in two dimensions of the
similarity of samples within and among groups (Clarke, 1993). The Cluster analysis allowed to recognize three
Figure 6. A. nMDS ordination of picophytoplankton coupled to a
cluster analysis. B, C. Overlapping bubble plots Prochlorococcus and
Synechococcus abundances, respectively. Solid lines represent the
principal clusters identified a 75% of Bray Curtis similarity.
Figure 7. Spearman rank correlogram between the abundances of prokaryote picophytoplankton, signature pigments and environmental variables. Positive correlations are displayed in blue and negative in red. Color intensity and the size of the circle are proportional to the
correlation coefficients.
transition of the picophytoplankton superficial to a deeper
community. In the third group are the samples deeper
than 30 and less than 50 m depth. The distributions of the
abundances of both Prochlorococcus and Synechococcus
(Figures 6B, C) do support such results.
Spearman’s correlations showed significant
relationships (either positive or negative) among abundances of prokaryote phytoplankton and environmental variables
(Figure 7). Prochlorococcus related significantly and
negatively to the dissolved oxygen (r=-0.64), temperature (r=-0.74) and ammonium (r=-0.33), whereas the
relation was significant and positive with depth (r=0.75).
Conversely, Synechococcus abundances were associated
to chlorophyll α (r=0.20). Other significant relationships among environmental variables were a negative correlation of temperature with nutrients (PO4, NO2 and NO3) and a positive one with dissolved oxygen, and salinity associated negatively with dissolved oxygen (r=0.75).
DISCUSSION
The hydrographic and oceanographic conditions found
during this study clearly show at least three different environmental gradients. The first gradient was latitudinal
(from north to south), with lower surface temperatures
(Figure 2A) and shallower main “clines” (e.g. thermoclines,
oxyclines and nutriclines) in the north zones (especially CC), gradually lowering in depth toward to south zones (particularly ACA). The temperature gradient has been previously documented in the study area (Gallegos et al., 2006). Additionally, as the subsurface in situ fluorescence
and chlorophyll α maxima occurred at all stations and
were associated to the depth of the main thermoclines,
consequently they were located deeper in the water column
toward the south zone.
Another conspicuous environmental gradient was from
the coast to ocean, in which not only differences in depth
eddy at intermediate stations (Figures 5A, B). The most oceanic stations also differed from the coastal ones because of the presence of a second and deep fluorescence and chlorophyll maxima. And finally, the third gradient
is provided by the vertical distributions of almost all
physical-chemical variables, previously described. One of
the most important features of this gradient is given by dissolved oxygen concentrations (oxygen minimum zone).
Prochlorococcus and Synechococcus abundances were comparable with those found in other tropical areas, ranging from 0.17 to 30.37 X 10⁴ cells mL-1, and 0.9 to 30.97 X 10⁴ cells mL-1, respectively (Table 1). These
numbers are similar to those found in another tropical zone, near the study area to the north (Gulf of California)
(Hernández-Becerril and Pastén-Miranda, 2015) and to the south (Costa Rica Dome) (Gutiérrez-Rodríguez et
al., 2014), and about exactly the same values (maxima
densities ranging from 4.53 X 10⁴ to 3.2 X 10⁵ cells mL-1
for Prochlorococcus, and 1.19 X 10⁵ to 3.8 X 10⁵ cells mL-1 for Synechococcus) in tropical and subtropical zones
such as East China (Guo et al., 2014), the Gulf of Mexico (Linacre et al., 2015), the Gulf of California (Hernández-Becerril & Pastén-Miranda, 2015), and the South Atlantic (Brazil) (Gérikas-Ribeiro et al., 2016; Bergo et al., 2017).
Although the presence of the prokaryotic
picophytoplankton Prochlorococcus and Synechococcus
populations was registered at all stations sampled (from north to south zones) and through the water column (up
to 110 m depth in some cases), there are differential
distributions which might depend on the distinct gradients
observed. Their signature pigments, divinyl-chlorophyll
α and zeaxanthin, respectively, were also found in
most samples (except from few undetectable values of zeaxanthin), but were less useful in this study to explain distribution tendencies, as they did not usually correspond or follow the patterns observed in their abundances (cell numbers), although few similarities and coincidences
were also found. Values of both abundances (as cell
numbers) and signature pigments of Prochlorococcus
and Synechococcus recorded in this study were similar to those found elsewhere, in more temperate waters (Jiao et
al., 2005; Pan et al., 2005).
We were able to define general patterns in the vertical
distribution of both Prochlorococcus and Synechococcus
abundances: the common increase of Prochlorococcus
densities deeper in the water column (up to 110 m depth), associated in most cases with the second, deep
fluorescence and chlorophyll α maxima in oceanic
stations, and Synechococcus abundances forming maxima
at surface (0-6 m depth), or either at subsurface (around
20 mm depth) or lower than 30 m, usually coinciding with
the subsurface fluorescence and chlorophyll α maxima;
similar vertical distributions were also found in the Gulf
of California, where subsurface (20-30 m) maxima were
detected, and one surface maximum coincident with lower temperatures, probably due to a weak upwelling
(Hernández-Becerril and Pastén-Miranda, 2015).
These general distribution patterns were also
confirmed by the statistical analyses performed (nMDS),
which showed Prochlorococcus more abundant in deeper
layers, in contrast to Synechococcus (Figures 6B, C), and the correlation among various environmental data
(Figure 7). This is a distinctive feature of the study area,
for the high Prochlorococcus densities have been related to the presence of a second, deep chlorophyll α maximum and to the minimum oxygen layer which is shallow close to the coast but becomes deeper towards more oceanic
waters (Goericke et al., 2000). Additionally, in adjacent areas Almazán-Becerril and García-Mendoza (2008) found that divinyl-chlorophyll α constituted approximately 90% of the total chlorophyll α between 80 and 90 m depth.
Similar tendencies on the vertical distribution of
Prochlorococcus and Synechococcus abundances have
been also reported in other geographic areas (Uysal, 2006; Brunet et al., 2007). These patterns indicated a strong latitudinal and vertical effect caused by their environmental gradients, and a differential distribution,
particularly the vertical distribution which leads to the
formation of a multi-layered structure.
However, despite the recognition of the patterns in the vertical distribution, it is still possible to distinguish
different Prochlorococcus populations (ecotypes ?) in
the water column, especially at stations 5, 28 and 37,
where higher abundances were found either at surface or subsurface, but also deeper, coinciding with the second deep
fluorescence maxima. These different Prochlorococcus populations might characterize the relatively well-known ecological condition of light-adapted forms or ecotypes, some adapted to high-light (HL) and others adapted to low-light (LL) (Scanlan and West, 2002; Bibby et al., 2003; Zinser et al., 2006; Biller et al., 2015), may partially
help to explain this behavior. A similar explanation may also apply to the Synechococcus populations, which might
include different clades (Tai and Palenik, 2009), although
Different multi-layered structures have been found
in the vertical distribution of marine phytoplankton all
over the world (Cullen, 2015), and especially regarding picocyanobacterial community, Fuller et al. (2006) have
shown a complex spatial compartmentalization of ecotypes and clades of both Prochlorococcus and Synechococcus, and ecotypes have been also found in the world ocean
(Scanlan and West, 2002; Zinser et al., 2006; Choi et al., 2011). Various physiological characteristics may count
to explain these spatial distributions, particularly the
vertical distribution, including differential adaptations (or
ecotypes) to light intensity (HL and LL), and to uptake
a wide range of Nitrogen compounds (Palenik, 2001; Scanlan and West, 2002; Ting et al., 2002; Bibby et al., 2003; Rocap et al., 2003; Zubkov et al., 1998; Veldhuis et al., 2005). The Prochlorococcus signature pigment,
divinyl-chlorophyll α, is believed to harvest more
efficiently blue light (Ito and Tanaka, 2011).
The particular conditions of the deeper water layers in the study area, with very low (suboxic) dissolved
oxygen concentrations, low-light intensity (with a
spectral blue feature) and high nitrate concentrations
may favor the formation of a second, deep fluorescence
maxima, especially in oceanic areas which are produced by Prochlorococcus populations (Goericke et al., 2000).
Furthermore, some particular Prochlorococcus ecotypes
(or clades) known as LLV and LLVI have only been found
in OMZ (Lavin et al., 2010).
Although there were previous indications of the cells aggregations in the top layer of the OMZ in the
Eastern tropical north Pacific, where the current study
area is situated, Goericke et al. (2000) did provide
sufficient information to asses a poorly-studied niche of Prochlorococcus, under low-light and suboxic conditions in this area. These findings were also followed by later
studies in the same area, one of which was based on both
phytoplankton pigments analysis and use of CHEMTAX
program to estimate Prochlorococcus contributions
to the total phytoplanktonic biomass and allocated its
larger biomass related to the deep fluorescence maxima (Almazán-Becerril and García-Mendoza, 2008), whereas Cepeda-Morales et al. (2009) considered that the deep fluorescence maxima in oceanic locations were produced
by Prochlorococcus populations, although they did not provide any evidence (e.g. information on Prochlorococcus
signature pigments or recognition and enumeration of
cells). Furthermore, these potentially productive layers
have not been usually considered to calculate the whole
productivity in the water column within the study area
(López-Sandoval et al., 2009).
Some of the correlations calculated yielded negative
values between Prochlorococcus abundances and
temperature, Dissolved Oxygen and NH4, and positive
values with depth (Figure 7), thus indicating the preference of its populations for deeper layers, and confirming
again the previous results obtained by Goericke et al.
(2000) about the niche of Prochlorococcus, under
low-light and suboxic conditions in this area. Conversely,
Synechococcus abundances were positively correlated
with fluorescence, Dissolved Oxygen and NH4 (Figure
6), coinciding with its distribution at subsurface layers.
The very low correlations between Prochlorococcus and
Divinyl chlorophyll α, and Synechococcus and zeaxanthin
confirm that their distributions did not match in this study.
In this study, we provide evidence of the formation
of deep fluorescence and chlorophyll maxima, especially
in oceanic stations, due to the abundant populations of
Prochlorococcus (and few cases high concentration of its
signature pigment, divinyl-chlorophyll α), corroborating
that these layers are produced by Prochlorococcus, and
that these formations coincided with suboxic events and high nitrate concentrations, an apparent condition
of the OMZ in the study area (Goericke et al., 2000;
Maske et al., 2010) and other similar areas in the world
(Ulloa et al., 2012). Our results also agree with others
in the world literature about abundance and distribution of Synechococcus, particularly its high cell numbers in more coastal environs and the formation of subsurface abundance maxima along the water column (Scanlan and West, 2002). The environmental gradients detected during this study are important in shaping the structure of these prokaryote picophytoplankters.
ACKNOWLEDGEMENTS
We are grateful to Elva Escobar Briones (ICMyL, UNAM) and Carlos Castellanos Barba (IIBiomédicas, UNAM) for facilities and assistance in using HPLC and flow cytometry, respectively, to Sergio Castillo Sandoval and Vladislav Carnero (ICMyL, UNAM) for guidance in using SURFER, obtaining, analyzing and providing
nutrients samples and data.
Funding
Partial support for this study has been given by
IN296516). Coordinación de la Investigación Científica (CIC, UNAM) approved and supported the use the R/V “El Puma”. ZS-V received a fellowship from CONACYT
for a M. Sc. degree.
REFERENCES
ALMAZÁN-BECERRIL, A. & GARCÍA-MENDOZA, E. 2008. Maximum efficiency of charge separation of photosystem II of the phytoplankton community in the Eastern Tropical North Pacific of Mexico: A nutrient stress diagnostic tool?
Ciencias Marinas, 34, 29-43.
ALMAZÁN-BECERRIL, A., GARCÍA-MENDOZA, E. & RIVAS, D. 2010. Distribución de pigmentos fotosintéticos y grupos de fitoplancton durante octubre de 2003. In:
Gaxiola-CASTRO, G. & DURAZO, R. (eds.) Dinámica del
ecosistema pelágico frente a Baja California 1997-2007.
México: SEMARNAT, INE, CICESE and UABC.
AQUINO-CRUZ, A., HERNÁNDEZ-BECERRIL D. U., SIGNORET-POILLON M., SALAS-DE-LEÓN D. A. & MONREAL-GÓMEZ, M. A. 2013. Studies on picophytoplankton in the southern Gulf of Mexico: recognition of picoprokaryotes and abundances of picophytoplankton during “dry season”. Brazilian Journal of Oceanography, 61, 265-276.
BERGO, N. M., SIGNORI, C. N., AMADO, A. M., BRANDINI, F. P. & PELLIZARI, V. H. 2017. The partitioning of Carbon biomass among the pico- and nano-plankton community in the South Brazilian Bight during a strong summer intrusion of South Atlantic central water. Frontiers in Marine Science,
4, 1- 12.
BERMAN, T. 1975. Size fractionation of natural aquatic populations associated with autotrophic and heterotrophic Carbon uptake. Marine Biology, 33, 215-220.
BIBBY, T. S., MARY, I., NIELD, J., PARTENSKY, F. & BARBER, J. 2003. Low-light-adapted Prochlorococcus
species possess specific antennae for each photosystem.
Nature, 424, 1051-1054.
BILLER, S. J., BERUBE P. M., LINDELL, D. & CHISHOLM, S. W. 2015. Prochlorococcus: the structure and function of collective diversity. Nature Reviews Microbiology, 13, 13-27.
BOUMAN, H. A., ULLOA, O., SCANLAN, D. J., ZWIRGLMAIER K., LI, W. K. W., PLATT, T., STUART, V., BARLOW, R., LETH, O., CLEMENTSON, L., LUTZ, V., FUKASAWA, M., WATANABE, S. & SATHYENDRANATH, S. 2006. Oceanographic Basis of The Global Surface Distribution of Prochlorococcus Ecotypes.
Science, 312, 918-921.
BRUNET, C., CASOTTI, R., VANTREPOTTE, V., CORATO, F. & CONVERSANO, F. 2007. Vertical variability and diel dynamics of picophytoplankton in the Strait of Sicily, Mediterranean Sea, in summer. Marine Ecology Progress Series, 346, 15-26.
BUITENHUIS, E. T., LI, W. K. W., VAULOT, D., LOMAS, M. W., LANDRY, M., PARTENSKY, F., KARL, D. M., ULLOA, O., CAMPBELL, L., JACQUET, S., LANTOINE, F., CHAVEZ, F., MACIAS, D., GOSSELIN, M. & MCMANUS, G. B. 2012. Picophytoplankton biomass distribution in the global ocean. Earth Syst Sci Data, 4, 37-46.
CEPEDA-MORALES, J., BEIER, E., GAXIOLA-CASTRO, G., LAVÍN, M. F. & GODÍNEZ, V. M. 2009. Efecto de la zona del mínimo de oxígeno en el segundo máximo de clorofila a
en el Pacífico Oriental Tropical Mexicano. Ciencias Marinas,
35, 389-403.
CHOI, D. H., NOH, J. H., HAHM, M. S., LEE, C. M. 2011. Picocyanobacterial Abundances and Diversity in Surface Water of the Northwestern Pacific Ocean. Ocean Science
Journal, 46, 265-271.
CLARKE, K. R. 1993. Non-parametric multivariate analyses of changes in community structure. Austral Ecology, 18,
117-143.
CLARKE, K. R. & GORLEY, R. N. 2006. PRIMER v6: User
Manual/Tutorial, Plymouth, PRIMER-E. 192 p.
CLARKE, K. R. & WARWICK, R. M. 2001. Change in Marine Communities: an approach to Statistical analysis and
interpretation, 2nd ed. Plymouth, PRIMER-E. 172 p.
CULLEN, J. J. 2015. Subsurface chlorophyll maximum layers: enduring enigma or mystery solved? Annual Review of
Marine Science, 7, 207-239.
DÍAZ, C. & MASKE, H. 2000. Abundance of coccoid cyanobacteria, hydrographic parameters and the possible underestimation of in situ chlorophyll α in the northern Gulf of California and the Mexican California Current. Ciencias
Marinas, 26, 441-461.
FOGG, G. E. 1986. Review Lecture: Picoplankton. Proceedings of
the Royal Society B: Biological Sciences, 228, 1-30.
FOGG, G. E. 1995. Some comments on picoplankton and its importance in the pelagic ecosystem. Aquatic Microbial Ecology, 9, 33-39.
FULLER, N. J., TARRAN, G. A., YALLOP, M., ORCUTT, K. M. & SCANLAN, D. J. 2006. Molecular analysis of picocyanobacterial community structure along an Arabian Sea transect reveals distinct spatial separation of lineages.
Limnology and Oceanography, 51, 2515-2526.
GALLEGOS, A., RODRÍGUEZ R., MÁRQUEZ, E., LECUANDA, R. & ZAVALA-HIDALGO, J. 2006. Una climatología de la temperatura de la superficie del mar de las aguas adyacentes a las costas de Jalisco, Colima y Michoacán, México: 1996-2003. In: JIMÉNEZ-QUIROZ,
M. C. & Espino-Barr E. (eds.) Los recursos pesqueros
y acuícolas de Jalisco, Colima y Michoacán. México:
Secretaría de Agricultura, Ganadería, Desarrollo Rural, Pesca y Alimentación.
GÉRIKAS-RIBEIRO, C., LOPES DOS SANTOS, A., MARIE, D., PELLIZARI, V. H., PEREIRA BRANDINI, F. & VAULOT, D. 2016. Pico and nanoplankton abundance and Carbon stocks along the Brazilian Bight. Peer J, 4, e2587.
GOERICKE, R., OLSON, R. J. & SHALAPYONOK, A. 2000. A novel niche for Prochlorococcus sp. in low-light suboxic
environments in the Arabian Sea and the Eastern Tropical North Pacific. Deep Sea Research Part I: Oceanographic
Research Papers, 47, 1183-1205.
GRASSHOFF, K., EHRHARDT, M. & KREMLING, K. 1983.
Methods of Seawater Analysis, 2ed. Germany, Verlag Chemie.
419 p.
GUO, C., LIU, H., ZHENG, L., SONG, S., CHEN, B. & HUANG, B. 2014. Seasonal and spatial patterns of picophytoplankton growth, grazing and distribution in the East China Sea.
GUTIÉRREZ-RODRÍGUEZ, A., SLACK, G., DANIELS, E. F., SELPH, K. E., PALENIK, B. & LANDRY, M. R. 2014. Fine spatial structure of genetically distinct picocyanobacterial populations across environmental gradients in the Costa Rica Dome. Limnology and Oceanography, 59, 705-723.
HERNÁNDEZ-BECERRIL, D. U., AQUINO-CRUZ, A., SALAS-DE-LEÓN, D. A., SIGNORET-POILLON, M. & MONREAL-GÓMEZ, M. A. 2012. Studies on picophytoplankton in the southern Gulf of Mexico: pigment analysis and potential importance of the picoeukaryote Prasinophyte Micromonas pusilla. Marine Biology Research,
8, 331-340.
HERNÁNDEZ-BECERRIL, D. U. & PASTÉN-MIRANDA, N. 2015. Abundancia y distribución de la cianobacteria picoplanctónica Synechococcus en Bahía de La Paz y Cuenca
Carmen, Golfo de California (junio, 2001). Hidrobiológica,
25, 357-364.
ITO, H. & TANAKA, A. 2011. Evolution of a divinyl chlorophyll-based photosystem in Prochlorococcus. Proceedings of the National Academy of Sciences of the United States of
America, 108, 18014-18019.
JEFFREY, S. W. & HUMPHREY, G. F. 1975. New spectrophotometric equations for determining chlorophylls α,
b, c1 and c2 in higher plants, algae and natural phytoplankton.
Biochemie und Physiologie der Pflanzen, 167, 191-194. JEFFREY, S. W., MANTOURA, R. F. C. & WRIGHT, S. W.
1997. Phytoplankton pigments in oceanography: guidelines
to modern methods, Paris, UNESCO Publishing.
JIAO, N., YANG, Y., HONG, N., MA, Y., HARADA, S., KOSHIKAWA, H. & WATANABE, M. 2005. Dynamic of autotrophic picoplankton and heterotrophic bacteria in the East China Sea. Continental Shelf Research, 25, 1265-1279.
KASSAMBARA, A. 2016. Correlation Matrix - RSTHDA [online software]. Available from: http://www.sthda.com/english/ rsthda/correlation-matrix.php (last access: 4 Dec 2017). KIRKWOOD, D. S. 1994. Sam Plus segmented flow analyzer and
its applications. Seawater analysis, Breda, Skalar.
LARA-LARA, J. R. & BAZÁN-GUZMÁN, C. 2005. Distribución de clorofila y producción primaria por clases de tamaño en la costa del Pacífico mexicano. Ciencias Marinas, 31, 11-21.
LAVIN, P., GONZÁLEZ, B., SANTIBÁÑEZ, J. F., SCANLAN D. J. & ULLOA, O. 2010 Novel lineages of Prochlorococcus
thrive within the oxygen minimum zone of the eastern tropical South Pacific. Environmental Microbiology Reports,
2, 728-738.
LINACRE, L., LARA-LARA, J. R., CAMACHO-IBAR, V., HERGUERA, J. C., BAZÁN-GUZMÁN, C. & FERREIRA-BARTRINA, V. 2015. Distribution pattern of picoplankton Carbon biomass linked to mesoscale dynamics in the southern Gulf of Mexico during winter conditions. Deep Sea Research
Part I: Oceanographic Research Papers, 106, 55-67.
LÓPEZ-SANDOVAL, D. C., LARA-LARA, J. R., LAVÍN, M. F., ÁLVAREZ-BORREGO, S. & GAXIOLA-CASTRO, G. 2009. Productividad primaria en el Pacífico oriental tropical adyacente a Cabo Corrientes, México. Ciencias Marinas, 35,
169-182.
MARIE, D., BRUSSAARD, C., PARTENSKY, F. & VAULOT, D. 1999. Flow cytometric analysis of phytoplankton, bacteria and viruses. In:Current protocols in cytometry. New York:
John Wiley and Sons.
MASKE, H., MEDRANO, R. C., CASTRO, A. T., MERCADO A. J., JAUREGUI, C. O. A., CASTRO, G. G. & OCHOA, J. 2010. Inorganic carbon and biological oceanography above a shallow oxygen minimum in the entrance to the Gulf of California in the Mexican Pacific. Limnology and
Oceanography, 55, 481-491.
MASSANA, R. & LOGARES, R. 2013. Eukaryotic versus prokaryotic marine picoplankton ecology. Environmental
Microbiology, 15, 1254-1261.
PALENIK, B. 2001. Chromatic adaptation in marine
Synechococcus strains. Applied and Environmental
Microbiology, 67, 991-994.
PAN, L. A., ZHANG, L. H., ZHANG, J., GASOL, J. M. & CHAO, M. 2005. On-board flow cytometric observation of picoplankton community structure in the East China Sea during the fall of different years. FEMS Microbiology
Ecology, 52, 243-253.
PARTENSKY, F., HESS, W. R. & VAULOT, D. 1999.
Prochlorococcus, a marine photosynthetic prokaryote of
global significance. Microbiology and Molecular Biology
Reviews, 63, 106-127.
PAULMIER, A. & RUIZ-PINO, D. 2009. Oxygen minimum zones (OMZs) in the modern ocean. Progress in Oceanography, 80, 113-128.
RAVEN, J. A. 1998. The twelfth Tansley Lecture. Small is beautiful: the picophytoplankton. Functional Ecology, 12, 503-513.
ROCAP, G., LARIMER, F. W., LAMERDIN, J., MALFATTI S., CHAIN, P., AHGREN, N. A., ARELLANO, A., COLEMAN, M., HAUSER, L., HESS, W. R., JOHNSON, Z. I., LAND, M., LINDELL, D., POST, A. F., REGALA, W., SHAH, M., SHAW, S. L., STEGLICH, C., SULLIVAN, M. B., TING, C. S., TOLONEN, A., WEBB, E. A., ZINSER, E. R. & CHISHOLM, S.W. 2003. Genome divergence in two Prochlorococcus ecotypes reflects oceanic niche
differentiation. Nature, 424, 1042-1047.
SCANLAN, D. J. & WEST, J. N. 2002. Molecular ecology of the marine cyanobacterial genera Prochlorococcus and
Synechococcus. FEMS Microbiology Ecology, 40, 1-12.
SCHLITZER, R. 2016. Ocean Data View. Available from: http:// odv.awi.de (last access: 29 May 2018).
TAI, V. & PALENIK, B. 2009. Temporal variation of
Synechococcus clades at a coastal Pacific Ocean monitoring
site. The ISME Journal, 3, 903-915.
TING, C. S., ROCAP, G., KING, J. & CHISHOLM, S. W. 2002. Cyanobacterial photosynthesis in the oceans: the origins and significance of divergent light-harvesting strategies. Trends in
Microbiology, 10, 134-142.
ULLOA, O., CANFIELD, D. E., DELONG, E. F., LETELIER, R. M. & STEWART, F. J. 2012. Microbial oceanography of anoxic oxygen minimum zones. Proceedings of the National
Academy of Sciences of the United States of America, 109,
15996-16003.
UYSAL, Z. 2006. Vertical distribution of marine cyanobacteria
Synechococcus spp. in the Black, Marmara, Aegean, and
eastern Mediterranean seas. Deep Sea Research Part II:
Topical Studies in Oceanography, 53, 1976-1987.
VELDHUIS, M. J. W., TIMMERMANS, K. R., CROOT, P. & WAGT, B. 2005. Picophytoplankton, a comparative study of their biochemical composition and photosynthetic properties.
VIDUSSI, F., CLAUSTRE, H., BUSTILLOS-GUZMÁN, J., CAILLEAU, C. & MARTY, J. C. 1996. Determination of chlorophylls and carotenoids of marine phytoplankton: separation of chlorophyll α from divinylchlorophyll α and zeaxanthin from lutein. Journal of Plankton Research, 18, 2377-2382.
ZINSER, E. R., COE, A., JOHNSON, Z. I., MARTINY, A. C., FULLER, N. J., SCANLAN, D. J. & CHISHOLM, S. W. 2006.
Prochlorococcus ecotype abundances in the North Atlantic
Ocean as revealed by an improved quantitative PCR method.
Applied and Environmental Microbiology, 72, 723-732.
ZUBKOV, M. V., SLEIGH, M. A., TARRAN, G. A., BURKILL, P. H. & LEAKEY, R. J. G. 1998. Picoplanktonic community structure on an Atlantic transect from 50° N to 50 ° S. Deep Sea Research
Figure 1. Flow cytometric signatures of the Prochlorococcus (Proc) and Synechococcus (Syn-I and Syn-II) populations of the station 21 (B6). The 2 µm beads are also indicated.