of Chemical
Engineering
ISSN 0104-6632 Printed in Brazil www.scielo.br/bjce
Vol. 35, No. 02, pp. 403 - 414, April - June, 2018 dx.doi.org/10.1590/0104-6632.20180352s20160329
SIMULATION AND EXPERIMENTAL STUDY OF
METHANE-PROPANE HYDRATE DISSOCIATION
BY HIGH PRESSURE DIFFERENTIAL SCANNING
CALORIMETRY
Davi Éber Sanches de Menezes
1, Thiago Waldowski Ralha
1, Luís
Fernando Mercier Franco
1,2, Pedro de Alcântara Pessôa Filho
1and
Maria Dolores Robustillo Fuentes
1*1Department of Chemical Engineering, Engineering School, University of São Paulo, 05424-970, São Paulo - SP, Brazil.
2School of Chemical Engineering, State University of Campinas, 13083-852, Campinas - SP, Brazil.
(Submitted: May 17, 2016; Revised: May 04, 2017; Accepted: May 15, 2017)
Abstract - Binary and ternary systems composed of methane-water and methane-propane-water, respectively, were studied using high pressure differential scanning calorimetry. The methodology was validated by comparing results for the binary system to experimental data obtained in the literature. The hydrate dissociation temperatures for the ternary system (methane-propane-water) at 21 MPa were experimentally determined for different compositions of the gas mixture and mole fractions of propane higher than 0.1 in the ternary system. Our results are in good agreement with the values predicted by applying the Cubic Plus Association (CPA) equation of state coupled with van der Waals-Platteeuw model for the hydrate phase. Although experimental results are considered satisfactory for both binary and ternary systems, higher deviations between our values and the simulated ones for the ternary system, considering peak temperature instead of the extrapolated onset as the hydrate dissociation temperature, are believed to be a consequence of dynamic effects that promote the formation of a heterogeneous hydrate and are negligible for the binary system.
Keywords: methane, propane, hydrates, high pressure calorimetry, simulation.
INTRODUCTION
The study of gas hydrate formation and dissociation has great importance in the petrochemical industry
to define operational conditions that ensure the flow of oil and gas in pipelines (Sloan et al., 2011).
Furthermore, gas hydrates are considered to be a potential alternative energy source (Sloan and Koh,
2008; Allison and Boswell, 2007). The understanding of the thermodynamic and kinetic behavior of gas hydrates also allows their use in other applications,
such as in water purification and carbon capture
and storage (Linjun et al., 2013; Vorotyntsev and Malyshev, 2011).
Gas hydrates are formed at high pressures and low temperatures. These thermodynamic conditions
*Corresponding author: Maria Dolores Robustillo Fuentes E-mail address: [email protected]
can be found in continental slopes, polar regions and deep water environments (Makogan, 1981; Kvenvolden and Rogers, 2005). The delineation of hydrate chemical equilibrium also depends on the composition of the system that generated it, which may consist of liquid water (often saturated with hydrocarbons), a gas hydrocarbon phase (often saturated with water) and a liquid hydrocarbon phase, for example.
Hydrate crystalline structures are composed of water molecules associated by hydrogen bonds that form a host lattice. The cavities within the network are called host cages and lodge small molecules, such as hydrocarbons. So far, the most common structural families of gas hydrates found in nature are: the cubic structure I (S1), cubic II (S2) and the structure H. The size of the guest molecule determines the type of structure to be formed, e.g., methane tends to form structure I, while propane tends to form structure II. Therefore, the composition of the gas mixture
can influence the thermodynamic equilibrium of the
hydrate (Sloan and Koh, 2008). Lee et al. (2005) studied hydrates formed from gas mixtures (methane with ethane or propane) and water droplets and concluded that the composition of the gaseous phase
also affects gas hydrates morphology and crystal
growth.
Dissociation heat (ΔHdiss) and dissociation temperature are physical properties often used in the development of thermodynamic models involving hydrate phase equilibrium (Kim et al., 1987; Ullerichet al., 1987; Selim and Sloan, 1989). Both properties can be determined accurately by calorimetry (Deschamps and Dalmazzone, 2009; Gupta etal., 2008). The results, found in the literature for gas hydrates at high pressures are, however, generally scarce and obtained by extrapolation or less accurate and more laborious techniques such as visual observation in PVT cells (Setzmann and Wagner, 1991; Ruffine et al., 2010; Xiang et al., 2013).
Many studies in the literature investigate systems based on oil samples (Chen et al., 2012, Dalmazzone et al., 2009; Ivanova et al., 2015; Semenov et al., 2015). Nevertheless, the analysis of phase equilibria of hydrates formed from water and free gas is primal to understand these structures. Moreover, simpler systems can facilitate the reproducibility of
laboratory experiments and the study of other effects
on the formation of hydrates, such as the presence of inhibitors.
Therefore, the aim of this paper is to present new data for dissociation temperatures of methane and propane hydrates formed from liquid water and gases in the supercritical state, employing a methodology based
on high-pressure differential scanning calorimetry.
Recent studies indicate the applicability of high
pressure differential scanning calorimetry to determine
the hydrate phase equilibrium (Cha et al., 2016; Chu et al., 2016; Sabil et al., 2015). The energy transitions coming from phase changes or rearrangements of the crystalline structure of the material, for example, show endothermic or exothermic peaks depending on the characteristic of the transition. The ice melting and the dissociation of hydrates are endothermic processes and can be observed during heating of the sample.
The system composition influences the equilibrium conditions of hydrates and such an influence is also
thoroughly considered in this work.
MATERIALS AND METHODS
Reagents
Milli-Q water was used in all experiments. Methane gas (99.5%) and propane (99.5%) were provided by the companies White Martins and Gama Gases, respectively.
Equipment
The apparatus used in this work was a high pressure
micro calorimeter (μ-DSC7 evo - Setaram), calibrated
from the factory with naphthalene (Setaram standard,
purity ≥ 99.97%) by performing a Joule Effect calibration. A temperature correction coefficient was also generated
in our laboratory based on known melting temperatures of certain standards provided by Sigma Aldrich
(n-decane (≥ 99%), cyclohexane (≥ 99.9%), dodecane (≥ 99%), hexadecane (≥99%) and eicosane (≥ 99%) to
obtain more accurate results at lower temperatures and using a heating rate of 1 K/min. The instrument has two high pressure cells (reference and sample) made of incoloy and inserted into an oven capable of reaching temperatures from 228.15K (aided by an external cooler Julabo F32) to 393.15 K. A high-pressure panel (PMHP 1000 Setaram-V2) and a gas mixer (Gas Panel 200 bar 2723 Top Industrie) were incorporated into the micro
calorimeter. This configuration allows operation with a
Estimation of System Composition
The overall composition of the system was calculated from the amount of water in the cell and the gas pressure. In the case of experiments with both gases (methane and propane), a mixer was used. It was operated according to the following equation:
(1)
ΔP is the pressure difference between the gases and
it is related to the partial pressure of the gas injected after the lowest pressure gas. P1 is the pressure of the lowest pressure gas and x1 and x2 are the mole fractions of lowest and highest pressure gas, respectively.
It is not possible to determine gravimetrically the exact amount of gas inside the cell to determine the global composition. Thus, the total amount of gas was estimated by considering the initial conditions of temperature and pressure (343.15K and 21 MPa) and the cell volume (0.19 mL) using the Peng-Robinson equation of state (EoS). The reliability of this equation was studied by comparing density results with data presented in the literature (Sage et al., 1934; NIST (National Institute of Standards and Technology)). For mixtures of methane and propane, van der Waals mixing rules were used, with a binary interaction parameter, Kij, equal to 0.012 (Gao, 1992).
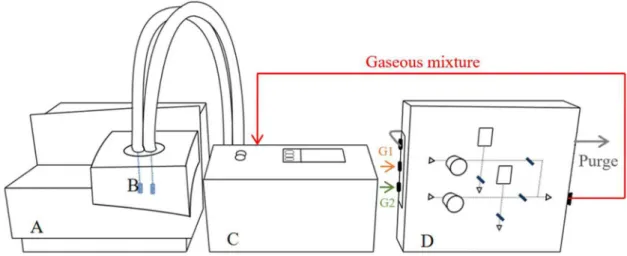
Such a method of estimating the composition, as the one described above, has intrinsic limitations. The volume of the cells is known but the system is not completely closed. The valves are placed in the gas panel that is connected to the cells through two thin tubes, as shown in Figure 1. Although these tubes are insulated, one can admit heat loss in the way. As temperature changes inside the cell, there could be a deviation in
the gas phase density due to expansion to the coolest region. Despite the absence of stirring, it is considered to be a homogeneous gas phase mixture, since methane (higher pressure gas) is injected progressively after propane (lower pressure gas) in the gas panel.
Experimental Procedure
All analyses were carried out using the
high-pressure micro differential scanning calorimeter
(HP-µDSC) at 21 MPa with accuracy of ± 0.2 MPa. The reference cell was kept empty and the calculated amount of water was added in the sample cell. The subsequent thermal cycle is described below:
I Heating the DSC oven to 343.15 K followed by a 10-min equilibration time at this temperature; II Gas injection and compression up to the
established pressure P, followed by a 10-min equilibration time at this condition;
III Cooling down to 228.15 K at 1 K/min, followed by a 10-min equilibration time at this temperature;
IV Heating up to 343.15 K at 1 K/min.
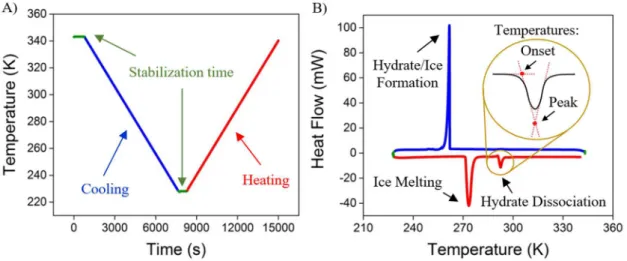
As no stirring is present in the system, hydrate nucleation is limited by the mass transfer process, and sub-cooling is necessary to obtain the crystallization (Daraboina et al., 2013). Therefore, the cooling zone was extended down to 228.15 K. Figure 2 presents the
procedure used in all experiments. The first thermogram (A) exhibits the temperature profile, whereas the second one (B) indicates the difference in the heat flow
between reference and sample cells. The experimental dissociation temperature can be obtained from both the extrapolated onset temperature or the peak of the curve related to hydrate dissociation, as indicated in Figure 2. In fact, there is no agreement that clearly
Figure 1. Experimental setup: A) High pressure µDSC; B) High pressure cells; C) Gas Panel of Compression; D) Gas Mixer.
P
P
1x
x
1 2$
defines the melting or dissociation temperature on the
calorimetric signal (Kouakou et al. 2013). Although it is known that the onset temperature represents the beginning of the thermal event and it should be less
influenced by heating rate or sample mass variations
than peak temperature - which corresponds to complete melting in organic compounds -, the onset temperature
can be very difficult to locate when other transitions, which can be ascribed to kinetic and dynamic effects,
lattice irregularities provoked by empty cavities, polymorphism or simple noise, are extremely close and overlapped peaks are observed. For that reason, depending on the substance or the studied system the use of the peak temperature could be preferred.
Modeling
The experimental results were compared with data obtained by simulations using Multiflash
6.0 (Infochem Computer Services). The program applies the CPA equation of state (Cubic Plus Association) for the liquid and vapor phases (Santos et al., 2015) and the model of Van der Waals and Platteeuw (1959) for the chemical potential of the hydrate phase (nH
~) (Equation 2).
(2)
where νm is the number of cages of type m per water molecule in the structure unit cell and θjm is related to the occupancy of guest j in the hydrate cage. The term g~b represents the free energy of empty
hydrates.
RESULTS AND DISCUSSION
Methane Density
The Peng-Robinson EoS was used to determine the mass of gas and hence the composition of the system, considering the pressure and temperature at the moment the gas was injected and the free volume inside the cell (volume occupied by water subtracted from total volume). To verify the validity of the Peng-Robinson EoS, comparison of the gas density using this equation was made with data obtained in the literature. For the experiments conducted only with water and methane, literature data for methane density were taken from the NIST database. As shown in Figure 3, for temperatures higher than 250 K, Peng-Robinson EoS is a reliable model to calculate the density of methane at 21 MPa. The performance of the PR-EoS improves as the temperature increases. As the gas was injected into the cell at 343.15K, the estimated error at that temperature is 2.5%, which was considered reasonable for applying this equation to calculate the mass of gas inside the cell.
Methane-propane mixture density
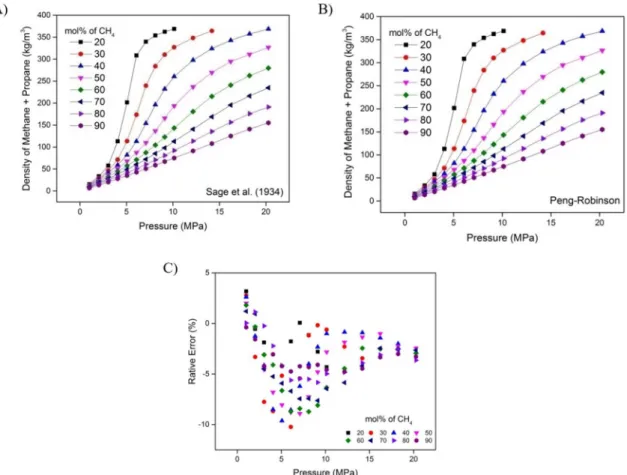
For mixtures of methane and propane, the gaseous mixture density estimated using the Peng-Robinson EoS was compared with the experimental data published by Sage et al. (1934), who measured the density of mixtures at various pressures (from atmospheric to 20 MPa), temperatures (from 293.15 K to 363.15 K) and compositions (from pure methane
Figure 2. Procedure designed to study the hydrate dissociation temperature based on HP-µDSC: A) Thermal profile of all analyses; B) Typical peaks obtained from the analysis at 21MPa.
ln
RT RT g
1
H
m cages
m j
guests jm
n
y i
= +
-~ ~
b
R W
to pure propane). Figure 4 shows the density as a function of pressure and methane mole fraction at 343.15 K. Figure 4A presents the literature data, Figure 4B presents the results from the Peng-Robinson EoS, and Figure 4C shows the deviation between them. The Peng-Robinson EoS provides density values slightly
larger than experimental ones, but this deviation is lower at higher pressures (absolute value lower than 5% at 20 MPa). The hydrate dissociation temperature
remains practically unaffected by deviations of this
order of magnitude. Hence, this equation seems suitable to calculate the amount of gas inside the cell.
Figure 3. Methane density as a function of temperature at 21 MPa: A) Red continuous line, Peng-Robinson EoS calculations. Black continuous line, NIST data; B) Relative error between Peng-Robinson EoS and NIST data.
Methane-water System
The system composed of water and methane was studied mainly to validate the methodology described above with other experimental works comparing the hydrate dissociation temperature. Table 1 compares experimental results to simulations from Multiflash 6.0 (Infochem Computer Services), and shows the absolute deviation between experimental and calculated values and some data reported in the literature. The highest absolute deviation was obtained for the onset value of the mixture formed by 0.82 mole fraction of methane (-1.44 K). Figure 5 shows heating thermograms of the binary system, in which the ice melting and methane
hydrate dissociation processes at 21 MPa and at different
ratios of methane and water are observed at lower and higher temperatures, respectively. For the 0.82 mole fraction of methane overlapped peaks are observed that, as previously mentioned, can be ascribed to kinetic
and dynamic effects, lattice irregularities provoked by
empty cavities, polymorphism or simple noise, which
may influence the onset temperature value.
The value of root-mean square deviation (RMSD) was also obtained through the following equation:
(3)
Predicted values are within the range delimited by the experimental onset and peak temperatures determined in
this work, the RMSD being 0.82 K and 0.80 K for the onset and peak temperatures, respectively. It means that
there is no relevant difference between the use of onset or
peak temperature for the binary system and the agreement observed demonstrates that the methodology is proper to determine the hydrate dissociation temperature. The absolute deviations between experimental data observed in this work and the predicted value using Multiflash are also consistent with those reported by Mohammadi et al. (2005), Jader and Sloan (2001), or Nixdorf and Oellrich (1997),
although they were obtained with different methodologies.
RMSD
N
T
T
.i i SIM
i EXP 2 0 5
R
=
TQ
-
V
YFigure 5. Ice melting (*) and hydrate dissociation (**) peaks in the methane-water system at 21 MPa.
Table 1. Peak temperatures of ice melting and hydrate dissociation of binary system formed by methane and water at 21MPa.
COMPOSITION
(Mole Fraction) EXPERIMENTAL (HP-µDSC) SIMULATION (Multiflash) ABSOLUTE DEVIATION
CH4 H2O
T ICE MELTING (K)
T HYDRATE DISS.
(K) T HYDRATE DISS.
(K) Phases*
(T EXP. - T SIM.)
Onset Peak Onset Peak Onset Peak
0.91 0.09 272.19 274.00 291.49 293.18 292.35 G-W-S1 -0.86 0.83
0.82 0.18 272.30 273.26 290.91 292.64 292.35 G-W-S1 -1.44 0.29
0.71 0.29 272.20 273.95 291.52 292.84 292.35 G-W-S1 -0.83 0.49
0.62 0.38 272.11 273.58 292.35 293.22 292.35 G-W-S1 0.00 0.87
0.53 0.47 272.21 274.15 291.74 293.02 292.35 G-W-S1 -0.61 0.67
0.43 0.57 272.38 274.67 291.56 293.01 292.35 G-W-S1 -0.79 0.66
0.32 0.68 272.20 274.69 291.74 293.46 292.35 G-W-S1 -0.61 1.11
0.22 0.78 272.28 274.88 291.66 293.44 292.35 G-W-S1 -0.69 1.09
REPORTED LITERATURE METHODOLOGY** PRESSURE (MPa) T HYDRATE DISS.
Mohammadi et al. (2005) Isochoric (pressure versus temperature plot) 17.3 (K)
25.9 293.6
Jader and Sloan (2001) Raman spectroscopy 20.2 291.86
22.9 293.08
Nixdorf and Oellrich (1997) Isochoric (pressure versus temperature plot) 21.2 292.25
Considering the Gibbs phase rule, the binary system in a three-phase equilibrium state presents only one degree of freedom. Therefore, only one independent coordinate (pressure, temperature or composition) is
required to define the thermodynamic state of the system.
In this work, all experiments were carried out at the same pressure (21 MPa), hence the temperature and
the composition are already completely defined. Ergo given a specified pressure, the temperature at which the
three phases coexist is also determined, independently of the composition. Nonetheless, the equilibrium of the system, even during a 10-min stabilization time after injecting gases, remains unassured and a gradient of methane concentration through the liquid phase due to the solubility variation with temperature might emerge. Therefore, experiments using the same procedure and
different compositions were carried out to verify whether
or not the hydrate dissociation temperature could vary
significantly due to possible structural irregularities (e.g., empty cavities within the hydrate structure) caused by
dynamic effects, considering a non-equilibrium state. As
one can see in Table 1, our experimental results are very similar for all the studied compositions, which indicates that they correspond most probably to equilibrium states
and the dynamic effects, if any, are negligible. The small
root-mean square deviations observed (0.8 K) regarding simulations may be rather caused by systematic errors in the experiment itself.
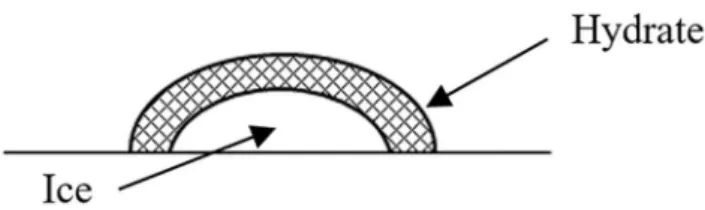
In Figure 5 it is also possible to observe a larger melting ice curve with increasing amount of water inside the cell, which is reasonable since the heat measured by the scanning is an extensive quantity. Meanwhile, considering the low solubility of methane in water, no agitation within the cell and that the same pressure was maintained in all experiments, it was assumed that the formation of hydrate by crystallization in the system is limited by the area of the interface between the gas and the water (Figure 6). This interfacial area can change according to the disposition and size of water droplets and consequently with the amount of water in the system. However, these factors are irrelevant for the thermodynamic properties for the binary system and, consequently, the methodology presented in this work proves to be adequate to determine the hydrate dissociation temperature.
Methane-propane-water System
The ternary system composed of
methane-propane-water was studied for different compositions to extend
the existing experimental data in the literature using a methodology based on HP-µDSC. For the ternary system in a three-phase equilibrium state, the number of degrees of freedom, according to the Gibbs phase rule, is two. Thus, for a given pressure and composition, the thermodynamic state of the system is completely
defined. The hydrate dissociation temperature
represents a transition between two regions in the phase diagram, going through an equilibrium line where three phases coexist: liquid hydrocarbon, liquid water with dissolved gas and hydrate (structure II),
according to the simulations at the specified conditions.
Figure 7A shows the ternary diagram of this system obtained from the simulated data. The contour in the diagram represents the equilibrium temperature as a function of the system composition. The equilibrium temperatures for systems containing 10 % mol of water are shown in Figure 7B. A maximum value for the equilibrium temperature is achieved when the methane mole fraction (excluding water) is about two thirds. This might be a result of the occupancy of cavities in the structure II. Larger guest molecules require bigger cages and typically determine the type of hydrate structure in mixtures (except for the mixture of methane and ethane) (Sloan and Koh, 2008). It is well known that propane tends to form structure II, but
it only fits into large cavities of this structure (51264)
and hence small cavities are only occupied by methane molecules (512). Therefore, a higher temperature
of dissociation is obtained when most of the large cavities are occupied by propane and most of the small ones by methane, which corresponds to the most
thermodynamically stable configuration. In Figure 7B,
this happens when the methane/propane ratio is about 2:1, which is in agreement with the proportion of small to large cavities in structure II (16:8, considering a unit cell). If the methane mole fraction (excluding water) is lower than 2/3, more small cavities of structure II will
be empty (since small cavities are unfit for propane
molecules) and the dissociation of the hydrate is favored. In the opposite direction of the diagram, if the mole fraction of methane is higher, more of the large cavities will be occupied by methane instead of propane and the structure will require less energy to be dissociated (Subramanian et al., 2000).
Figure 8 shows thermograms related to the same ternary system. The onset and peak temperatures of ice melting and hydrate dissociation as well as simulation results by Multiflash 6.0 software and
Figure 7. Ternary diagram of simulated hydrate dissociation temperatures vs composition in the system methane-propane-water at 21 MPa (A) and the temperature profile according to the propane-methane ratio in the section AB (B).
Figure 8. Ice melting (*) and hydrate dissociation (**) peaks in the methane-propane-water system at 21 MPa.
absolute deviations regarding simulated results are shown in Table 2. In most cases, predicted values are also within the range delimited by the experimental onset and peak temperatures determined in this work, the RMSD being 0.51 K and 1.34 K for the onset and peak temperatures, respectively. As can be observed, the RMSD from simulated results is higher for peak temperatures in this case. As previously stated, peak temperatures are more sensitive to mass variations. The higher the amount of sample, the higher the peak temperature. By observing Samples 6 and 7 from
Table 2, it is possible to note the influence of the
amount of water in the system on peak temperature,
the onset temperature being practically unaffected.
Both samples have the same water-free composition of gases, but the global composition indicates that sample 6 has 53% water, while sample 7 has only 7%. Peak temperatures are, in this case, 302.72 K and 301.17 K, respectively. However, onset temperatures are 300.17 K and 300.06 K, respectively. In both cases, simulated results are about 300.4 K, very close to the onset values.
Although for the binary system the dynamic effects
Brazilian Journal of Chemical Engineering V
ol. 35, No. 02, pp. 403 - 414,
April - June, 2018
4
11
al Scanning Calorimetry
Table 2. Peak temperatures of ice melting and hydrate dissociation of the ternary system formed by methane, propane and water at 21MPa.
COMPOSITION (Mole Fraction) COMPOSITION (water
free mole fraction) EXPERIMENTAL (HP-µDSC) SIMULATION (Multiflash) ABSOLUTE DEVIATION
SAMPLE CH4 C3H6 H2O CH4 C3H6
TICE MELTING
(K)
THYDRATE DISS.
(K)
THYDRATE DISS.
(K) Phases* (TEXP.- TSIM.)
Onset Peak Onset Peak Onset Peak
1 0.79 0.10 0.11 0.89 0.11 272.03 272.90 299.54 300.98 299.36 LHC-W-S2 0.18 1.62
2 0.72 0.10 0.18 0.88 0.12 272.48 273.46 298.26 300.27 299.53 LHC-W-S2 -1.27 0.74
3 0.62 0.10 0.28 0.86 0.14 272.36 273.92 299.67 301.03 299.78 LHC-W-S2 -0.11 1.25
4 0.56 0.11 0.33 0.83 0.17 272.28 274.89 299.81 301.81 300.06 LHC-W-S2 -0.25 1.75
5 0.45 0.11 0.44 0.80 0.20 272.53 276.51 300.44 301.61 300.31 LHC-W-S2 0.13 1.30
6 0.37 0.10 0.53 0.78 0.22 272.32 276.65 300.17 302.72 300.42 LHC-W-S2 -0.25 2.30
7 0.72 0.21 0.07 0.78 0.22 272.36 274.48 300.06 301.17 300.46 LHC-W-S2 -0.40 0.71
8 0.62 0.21 0.17 0.74 0.26 272.34 273.96 300.17 301.35 300.56 LHC-W-S2 -0.39 0.79
9 0.53 0.20 0.27 0.72 0.28 272.41 273.45 300.17 301.15 300.62 LHC-W-S2 -0.45 0.53
REPORTED LITERATURE METHODOLOGY** CH4
(% mol; water free)
CH4 (% mol ***)
C3H6 (% mol ***)
H2O (% mol ***)
PRESSURE**
(MPa) TSIM.(K)
McLeod and Campbell (1961) Visual Inspection 96.50 NA NA NA 20.9 NA
Nixdorf and Oellrich (1997) Isochoric (pressure versus temperature plot) 97.07 18.25 0.55 81.20 19.8 295.63 *LHC: Liquid Hydrocarbon; W: Liquid water; S2: Hydrate structure II.
account. Since propane diffusivity in water is higher than methane diffusivity, inner regions of the hydrate film may be richer in propane and poorer in methane.
The structure in this region may present emptier
smaller cavities (512), which should be occupied by
molecules of methane. On the other hand, regions close to the surface could present most of the smaller cavities occupied by methane and hence a hydrate with higher occupation density. Taking this into account, a heterogeneous hydrate structure can be formed
and it could influence the experimental dissociation
temperature. Thermograms shown in Figure 8 presented more overlapped transitions for samples 1, 2, 3, 4, 5, 6, providing evidence of such heterogeneity in the ternary system. The results obtained for samples 7, 8 and 9 presented in Table 2 show lower absolute deviations for peak temperatures. Those samples contain the higher amounts of propane (water free composition) and water content between 7 and 27%. Melting peaks observed for these mixtures in Figure 8 do not show overlapped transitions, which indicates more homogeneity.
Finally, the hydrate dissociation temperatures found in the literature for this ternary system were 296.56 K at 19.8 MPa (Nixdorf and Oellrich, 1997) and 296.6 K at 20.9 MPa (McLeold and Campbell, 1961) using PVT cells by the isochoric method and visual inspection, respectively. However, global composition
was not specified. McLeod and Campbell (1961) used
a methane and propane mixture of 96.50 % methane, while Nixdorf and Oellrich (1997) used 97.07 mol% of methane for the same mixture, both are water-free composition. From the data published by Nixdorf and Oellrich (1997) the composition was recalculated by considering a water volume of 225 ml and reactor
volume of 500 ml, as specified by those authors, as
well as an injection temperature of 294.15 K. the Peng-Robinson EoS was also used to determine the gas density. Recalculated global compositions are shown in Table 2. In this case, the experimental dissociation temperature obtained by Nixdorf and Oellrich (1997) (296.56 K) is in a reasonable agreement with simulated results (295.63 K) provided by Mutiflash 6.0 for the recalculated global composition. The same calculation could not be done for compositions used by McLeod and Campbell (1961) because they did not specify either the amount of water used, or the reactor volume or the injection temperature. However, the experimental temperature obtained by those authors is very similar to the one obtained by Nixdorf and Oellrich (1997), which indicates that the global composition should be also comparable.
CONCLUSIONS
This work presents new experimental data for gas hydrate dissociation temperatures in mixtures of methane, propane and water at high pressure (21 MPa). Such data were obtained using a high pressure
differential scanning micro calorimeter. The
Peng-Robinson EoS, which was proven to be reasonably accurate for the systems and conditions studied here, was used to compute the gas density inside the cell. For the binary system (methane+water), dynamic effects
were found to be insignificant for the determination
of the experimental hydrate dissociation temperature. Au contraire, the experimental results of the ternary system (methane+propane+water) have shown higher absolute deviations for peak temperatures from simulated values than the binary system, probably due to the formation of a heterogeneous hydrate caused
by difference of methane and propane diffusivities in
water. Even so, these results are undoubtedly relevant since, to the best of our knowledge, no experimental data were ever published for this ternary system under the same conditions as the ones investigated in this work.
ACKNOWLEDGEMENTS
The authors thank the financial support of
FAPESP (processes 2014/02140-7, 2014/25740-0 and 2015/23148-9) and CNPq (process 132505/2015). The help of members of the laboratory GenBio (USP) is also gratefully acknowledged.
REFERENCES
Allison, E., Boswell, R., Methane Hydrate, Future energy within our grasp, DOE Overview. (2007). Document http://www.fossil.energy.gov/programs/ oilgas/hydrates/
Cha, M., Hu, Y., Sum, A.K., Methane hydrate phase equilibrium for systems containing NaCl, KCl, and NH4Cl. Fluid Phase Equilibria, 413 2-9 (2016). Chen, J., Sun, C.-Y., Liu, B., Peng, B.-Z., Wang,
X.-L., Chen, G.-J., Zuo, J. Y., Ng, H.-J., Metastable boundary conditions of water-in-oil emulsions in the hydrate formation region. AIChE J., 58: 2216-2225 (2012)
Daraboina, N., Malmos C., Solms, N., Investigation of Kinetic Hydrate Inhibition Using a High Pressure
Micro Differential Scanning Calorimeter. Energy Fuels, 27 5779-5786 (2013)
Deschamps, J., Dalmazzone, D., Dissociation enthalpies and phase equilibrium for TBAB semi-clathrate hydrates of N2, CO2, N2 + CO2 and CH4 + CO2. J Therm Anal Calorim., 98 113-118 (2009) Gao, G., A simple correlation to evaluate binary
interaction parameters of the Peng-Robinson equation of state: binary light hydrocarbon systems. Fluid Phase Equilibria, 74 85-93 (1992).
Gupta, A., Lachance, J., Sloan, E. D., Koh, C.A., Measurements of methane hydrate heat of dissociation
using high pressure differential scanning calorimetry.
Chem. Eng. Sci., 63 5848-5853 (2008).
Ivanova, I.K., Semenov, M.E., Koryakina, V.V., Shits, E.Y., Rozhin, I. I, Investigation of natural gas hydrates formation/decomposition processes in systems consisting of “commercial
asphaltene-resin-paraffin deposits and water”. Russian Journal
of Applied Chemistry, 88 941-948 (2015).
Jager, M., Sloan, E., The effect of pressure on methane
hydration in pure water and sodium chloride solutions. Fluid Phase Equilibria, 185 89-99 (2001). Kim, H.C., Bisnoi, P.R., Heidemann, R.A., Rizvi, S.S.H.,
Kinetics of methane hydrate decomposition. Chemical Engineering Science, 42(7) 1645-1653 (1987).
Kouakou AC, Mapihan KL, Pauly J. Solid-liquid equilibria under high pressure of pure fatty acid methyl esters. Fuel 109 297-302 (2013).
Kvenvolden, K. A., Rogers, B. W., Gaia's breath-global methane exhalations. Mar. Pet. Geol., 22 579-590 (2005).
Lee, J.D., Susilo, R., Englezos, P., Methane-ethane and methane-propane hydrate formation and decomposition on water droplets. Chemical Engineering Science, 60 4203-4212 (2005).
Linjun, W., Xuemin, Z., Honghui, L.I., Shao, L., Zhang, D., Jiao, L., Theory research on desalination of brackish water using gas hydrate method. Advaced Materials Research, 616-618, 1202-1207 (2013). Makogan, Y. F, Hydrates of natural gas. PennWell
Publishing: Tulsa, OK (1981).
McLeod, H. O. J., and Campbell, J. M., Natural Gas Hydrates at Pressures to 10,000 psia, J. Petl Tech, 222 590-594 (1961).
Mohammadi, A.H, Anderson, R., Tohidi, B., Carbon Monoxide Clathrate Hydrates: Equilibrium Data and Thermodynamic Modeling. AIChE Journal, 51 2825-2833 (2005).
Multiflash version 6.0.14, Infochem Computer Services
Ltd / KBC Advanced Technologies, May 2015.
Nixdorf, J., Oellrich, L. R., Experimental determination of hydrate equilibrium conditions for pure gases, binary and ternary mixtures and natural gases. Fluid Phase Equilib., 139 325-333 (1997).
Ruffine, L., Donval, J.P., Charlou, J.L., Cremière, A.,
Zehnder, B.H., Experimental study of gas hydrate formation and destabilisation using a novel high-pressure apparatus. Marine and Petroleum Geology, 27 1157-1165 (2010).
Sabil, K.M., Nashed,O., Lal, B., Ismail, L., Japper-Jaafar, A., Experimental investigation on the dissociation conditions of methane hydrate in the presence of imidazolium-based ionic liquids. The Journal of Chemical Thermodynamics, 84 7-13 (2015).
Sage, B. H., Lacey, W.N., Schaafsma, J. G., Phase Equilibria in Hydrocarbon Systems II. Methane - Propane System. Industrial and Engineering Chemistry, 26, 2 214-217 (1934).
Selim, M.S., Sloan, E.D., Heat and mass-transfer during the dissociation of hydrates in porous media. AIChE Journal, 35(6) 1049-1052 (1989).
Semenov, M.E, Manakov, A.Y., Shitz, E.Y., Stoporev, A.S., Altunina, L.K., Strelets, L.A., Misyura, S.Y., Nakoryakov, V.E., DSC and thermal imaging studies of methane hydrate formation and dissociation in water emulsions in crude oils. Journal of Thermal Analysis and Calorimetry, 119 757-767 (2015). Setzmann, U., Wagner, W., A new equation of state and
table of thermodynamics properties for methane covering the range from the melting line to 625K at pressures up to 1000MPa. The Journal of Physical Chemistry, 20 1061-1155 (1991).
Santos, L.C., Abunahman, S.S., Tavares, F.W., Ahón, V.R.R., Kontogeorgis, G.M., Cubic Plus Association Equation of State for Flow Assurance Projects. Industrial & Engineering Chemistry Research, 54 6812-6824 (2015)
Sloan, E.D, Koh, C., Clathrate hydrates of natural gases, 3th edition, CRC Press, New York (2008). Sloan, E., Koh, C., Sum, A., McMullen, N., Shoup,
G., Ballard, A., Palermo, T., Creek, J., Eaton, M., Lachance, J., Talley, L., Natural gas hydrates in
flow assurance. Elsevier, Burlington, MA (2011).
Subramanian, S., Kini, R.A., Dec, S.F., Sloan, E.D., Evidence of structure II hydrate formation from methane + ethane mixtures. Chemical Engineering Science, 55 1981-1999 (2000).
Van der Waals, J. H., Platteeuw, J.C., Clathrate solutions, Advances in Chemical Physics, 2 1-57 (1959). Vorotyntsev, V. M., Malyshev, V. M., Gas hydrates:
nanosized phases in the separation and purification
of substances by crystallization. Russian Chemical Reviews, 80(10) 971-991 (2011).