Assessing the potential impacts of COVID-19 in Brasil:
Mobility, Morbidity and Impact to the Health System
Fl´avio C Coelhoa,b, Raquel M Lanac,b, Oswaldo G Cruzc,b, Claudia T Code¸coc,b, Daniel Villelac,b, Leonardo S Bastosc,b,d, Ana Pastore y Pionttie,
Jessica T Davise, Alessandro Vespignanie,f, Marcelo F C Gomesc,b,∗
aEscola de Matem´atica Aplicada, Funda¸c˜ao Getulio Vargas, Rio de Janeiro, Brazil bN´ucleo de M´etodos Anal´ıticos para Vigilˆancia em Sa´ude P´ublica, Rio de Janeiro, Brazil
cFiocruz, Scientific Computing Program, Rio de Janeiro, Brazil
dLondon School of Hygiene and Tropical Medicine, London, UK
eLaboratory for the Modeling of Biological and Socio-technical Systems, Northeastern
University, Boston, USA
fISI Foundation, Turin, Italy
Abstract
The two largest Brazilian cities, Rio de Janeiro and S˜ao Paulo, have declared community transmission of COVID-19 on mid March, 2020. In this study we estimated the most vulnerable areas in Brazil for COVID-19, both in terms of risk of introduction and risk of mortality associated with social vulnerabil-ity. We explore the most likely routes of spread through the country, from the already exposed cities, according to human mobility statistics. The resulting maps should help authorities in their efforts to prioritize actions and if resource allocation to mitigate the effects of the pandemic.
Keywords: COVID-19, pandemics, Brazil
1. Introduction
As of 18 March 2020, the pandemic of COVID-19 has reached 166 countries with 191,127 confirmed cases and 7,807 deaths, globally [1]. The first imported case of COVID-19 was confirmed in Brazil on February 26, 2020, in the city of S˜ao Paulo [2], after 2 months of the alert issued by China. All Brazilian states
5
∗Corresponding author
are currently investigating suspected cases of the disease, while 16 states and the Federal District have already confirmed a total of 428 cases (11,278 under investigation) [3].
S˜ao Paulo and Rio de Janeiro have declared community transmission in 2020-03-13 [4, 5, 6]. As of 2020-03-18, the former had registered 240
COVID-10
19 confirmed cases, 4 deaths, and 5,334 remain under investigation [3]. The latter registered 45 confirmed cases, 0 deaths and 1,254 under investigation, according to the Ministry of Health [3]. S˜ao Paulo and Rio de Janeiro are the most populous metropolitan areas of Brazil, with millions of people living in precarious conditions, while being the country’s main transportation hubs for
15
both local and international flow of individuals, through which other pathogens were introduced in the country, such as H1N1 in 2009 and various strains of the dengue virus [7].
This study analyzes the COVID-19 spreading risk within the country start-ing from outbreaks takstart-ing place in Rio de Janeiro and S˜ao Paulo. We assume a
20
scenario with no mobility restrictions. We are aware that such efforts are ongo-ing, but our results stress the importance of intensifying them, since population support and adherence to health authorities recommendations is still an open question.
Brazil presents strong spatial heterogeneity in terms of demography, age
25
distribution, access to public health, and poverty indices. Such heterogeneity should affect the impact of COVID-19 epidemic countrywide, since they are related to transmissibility, letality and vulnerability. In this article we intend to provide quantitative metrics to identify regions that are both vulnerable to the arrival of COVID-19 during the start of country-based spread and which are
30
also vulnerable to health care infrastructure overload. We attempt to determine the most vulnerable regions of the country based on national mobility patterns, demographic characteristics of the population and the capacity of local hospitals and other health units to handle the kinds of services demanded by severe cases of COVID-19.
2. Methods 2.1. Data
The analyses were done at the micro-regional administrative level. Brazil has 558 such regions, with population varying from 13 million in the metropolitan area of S˜ao Paulo to 2, 703 in Fernando de Noronha island, in Pernambuco
40
state. To measure the mobility between micro-regions, we used daily air travel statistics from the Official Airline Guide (OAG) [8] for long-range mobility, and shorter distance pendular travels from the 2010 national census (IBGE) [9].
For each micro-region, demographic data stratified by age were obtained from the 2000 and 2010 national censuses [9] and were used to project the
45
population in 2020 per age group using a geometric growth model.
Infrastructure for COVID-19 hospitalization per micro-region was obtained from DataSUS [10]. We calculated the number of standard hospital beds and complementary beds (Intensive Care Unit and Intermediate Unit) available for each micro-region [10], from the public (SUS) and private (non-SUS) sectors,
50
per 10, 000 inhabitants.
2.2. Effective distance
To assess the probability of COVID-19 spread within the Brazilian terri-tory in the absence of mobility restrictions, we calculated the effective dis-tance (Ef(i, j)) between micro-regions using air travel data. The value of
55
Ef(i, j) is a measure of proximity between two micro-regions i and j created
by the flow of people, which is known to have strong correlation with the time to importation of infectious diseases into new territories from a well-defined origin [11, 12], particularly so for direct transmission diseases. To facilitate comparison between different scenarios, we also calculate a relative effective
60
distance index (ef), dividing Ef by the distance to the nearest destination:
ef(i, j) = Ef(i, j)/ minj{Ef(i, j)}. We computed Ef from S˜ao Paulo and Rio de Janeiro separately in order to assess the potential contribution of each. This information is mapped into micro-region origin-destination pairs by summing
over the corresponding airports serving each micro-region based on its
munici-65
pality of reference.
2.3. Outbreak probability
To calculate the probability of outbreak in each micro-region m, we make use of the reproduction number R0 and the prevalence Im during the infection
period, giving rise to the expression: pepi = 1 − (1/R0)Im. In which Im =
70
kτP
ifi,mIi/Ni, where fi,mis the total number of travellers arriving from micro-regions with reported cases i into micro-region m, and the notified prevalence in the source region i is given by the incidence Ii/Nitimes the infection duration τ
and a scaling parameter k, to account for number of undetected asymptomatic participating in the transmission. The parameter R0 is the basic reproduction
75
number [13]. For the purpose of the results shown, we set R0 = 2.5, which is
compatible with previous studies [14, 15, 16, 17].
We computed the outbreak probability per micro-region using two scenarios: First generation of outbreaks. We assume community transmission taking place only in Rio de Janeiro and S˜ao Paulo, with 100 cases notified in a week at each
80
municipality. Prevalence of infection is calculated by multiplying the notification count by an expansion factor k = 10 to take into account asymptomatic and under reported cases [18]. This number is then multiplied by the infection duration τ = 8 days [19], resulting in 8000 prevalent infections (infected × infection duration) in each of the two cities of origin.
85
Number of travellers per day between micro-regions was computed by adding the air travel data (used to calculate effective distance) and pendular mobility for work and study extracted from the 2010 Census [9]. The inclusion of pendular mobility is important to assess the spreading process between geographically close micro-regions, while still preserving data-driven flow estimates.
90
Second generation of outbreaks. In this scenario, we assume that all micro-regions with pepi≥ 0.5 in the first scenario actually had outbreaks. In each of them, the prevalence is set to the same level stated before for Rio de Janeiro and
S˜ao Paulo. Then we compute pepi again, to compute the micro-regions most
likely to develop outbreaks in this second generation. Those two outbreaks
95
generations should not be confused with the infections process generation time. It should be noted that this is a baseline scenario, that does not take into account the ongoing interventions affecting mobility, nor demographic and envi-ronmental effects that may affect the magnitude of R0. It describes the expected
initial momentum of the spread in Brazil.
100
3. Results
3.1. Effective distance from Rio de Janeiro and S˜ao Paulo in the absence of travel restrictions
Figures 1(a-b) show the relative effective distance of Brazilian micro-regions from S˜ao Paulo and Rio de Janeiro generated by the typical travel movement
105
by air. The majority of state capitals are among the closest areas, together with some important touristic destinations (such as Foz do Igua¸cu/PR and Porto Seguro/BA), as well as important urban and industrial centers outside metropolitan areas such as Itaja´ı/SC and Uberlˆandia/MG. S˜ao Paulo shows a more central role than Rio de Janeiro, evidenced by the larger proportion
110
of closer destinations, which means that it poses a greater risk for earlier and widespread case importation to other states.
3.2. Probability of outbreak
Figure 1(c) shows the probability of outbreak triggered by the increased prevalence of COVID-19 in Rio de Janeiro and S˜ao Paulo, in the absence of
115
travel restrictions. The most likely micro-regions to develop an outbreak are the geographic neighboring regions of S˜ao Paulo and Rio de Janeiro as well as capital cities of Brasilia/DF, Belo Horizonte/MG, Porto Alegre/RS, and Curitiba/PR. For a complete list, see the Supplementary material.
Figure 1(d) shows the probability of outbreak in a secondary wave of
trav-120
highest risk during the first phase. After this secondary wave, the establish-ment of COVID-19 transmission is very likely in all micro-regions along the coast, with an almost contigous range from Porto Alegre/RS (in the south) to Salvador/BA, as well the neighboring areas of Recife/PE and Fortaleza/CE
125
(in the norhteast). To the west, the neighboring areas of Foz do Igua¸cu/PR, Cuiab´a/MT, Brasilia/DF, and Goiˆania/GO are also at high risk.
Health System Overload. Figure 2 shows the availability of hospital beds per micro-region. They indicate the capacity to cope with the increased demand. According to data published by the OECD Health Statistics 2019, the average
130
number of beds per 10,000 people in the OECD countries in 2017 was 47 [20]. Data extracted in 2020 from the Brazilian Ministry of Health database [10] re-ported a total of 435, 258 beds available in the country. Based on projected population for the year 2020, this amounts to about 22 beds per 10, 000 inhabi-tants. When stratified by micro-regions, it becomes clear the great heterogeneity
135
of those resources across the national territory. The median for the 558 micro-regions is of 19 beds per 10,000, with the lower 5% having only 6 and the 95% percentile presenting 41 beds per 10, 000 people. This disparity poses an im-portant challenge for resource allocation in the case of diseases that have the potential to spread over a vast part of the territory as shown.
140
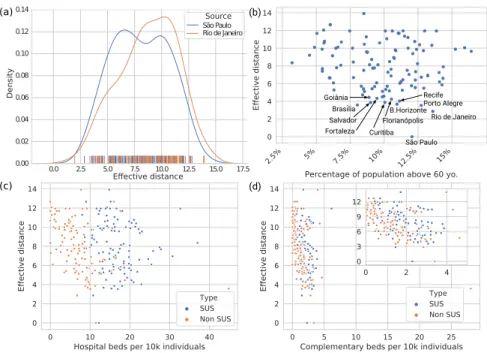
Current data indicates that COVID-19 have an increased case fatality rate (with all the caveats of CFR during the early phase of a novel virus epidemic) for individuals above 60 years of age, with numbers suggesting about 15% CFR for those above 80 years old [21]. Since S˜ao Paulo is currently presenting the highest number of confirmed and suspect cases in Brazil [3] and the effective distance
145
distribution shows that it poses the worst-case scenario of time-to-seeding of other micro-regions (see Figs. 1a-b and Fig. 2a for reference), we focused on that source for analysing the relation between effective distance and percentage of population above 60 years old (Fig. 2b), number of overall hospital beds and complementary beds (ICU and intermediary care) per 10,000 individuals
150
For the micro-regions in the airline mobility network, the median fraction of population above 60 years is 10% (90% CI [5% − 14%]), with median overall and complementary beds rate of 23 [14 − 36] and 3 [0.3 − 5.7], respectively. When we focus on the 20 closest micro-regions to S˜ao Paulo in that network
155
plus the source, the median fraction of population above 60 yo. is 10% (IQ range [8% − 11%]), while the number of overall hospital beds median rate is 26 (IQ range [23 − 28]), and the complementary ones is 4.6 (IQ range [4.1 − 5.6]. We see that, contrary to common belief that metropolitan areas (which comprises the vast majority of those 21 locations) are generally better covered in terms of
160
health care facilities, this seems to be the case only for ICU and intermediate care beds.
According to the National Agency of Supplementary Health (Agˆencia Na-cional de Sa´ude Suplementar, ANS), in January 2020 about 24% of the pop-ulation had some type of health insurance, meaning that around 75% of the
165
Brazilian population rely on the universal public health system (SUS). When stratified by SUS and non SUS overall beds, the median ratio between the two at the micro-regions is 81% [52% − 100%], indicating that most regions have an appropriate ratio based on the population health care access profile average. In terms of complementary beds, the median is incompatible with coverage (65%
170
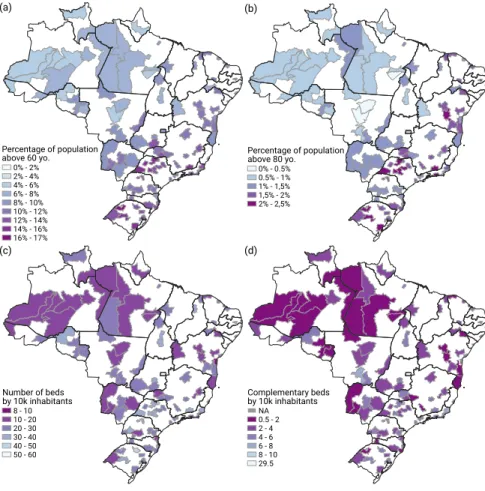
are SUS), and disparity is significant (90% CI [33% − 100%]. For the 20 closest micro-regions from S˜ao Paulo in the airline network plus the source, the scenario is particularly worrisome, since the median is 56% ([34% − 68%]). In Fig. 3 we present the spatial distribution of percentage of population above 60 (a) and 80 (b) years old, as well as the overall (c) and complementary (d) number of beds
175
by 10,000 inhabitants. It is clear that several regions combine relatively high percentage of population at risk and relatively low rate of hospital beds, which is an important indication of vulnerability for overcrowding.
4. Discussion
The probabilistic analysis of the initial spread of COVID-19 presented here
180
has intentionally disregarded the effects of any efforts at social distancing, and mobility restrictions. In this respect, it represents a worst case scenario which is not very far from reality, since the implementation of control measures and the establishment of behavioral changes in the population at large is likely to take more than a couple of weeks and people adherence is uncertain, specially
185
so for workers that do not have payed leave or whose work limits the possibility of work-from-home. On the other hand, we have tried to be conservative with the parameters of the model such as the R0 of 2.5 and the initial number of
reported cases in Rio and S˜ao Paulo, which are already larger than the hundred cases we postulated.
190
We believe that after the two spread waves described here, the effects of the containment efforts by health authorities will begin to influence the transmission dynamics, but by then the country will be managing a considerable number of (potentially serious) cases, leading to a big impact on public and private health services. We have demonstrated that the heterogeneous per-capita distribution
195
of hospital beds is likely to cause an uneven burden distribution which can be minimized by the authorities through preemptive differential investments in the the public health care system (SUS). We hope the analysis presented here can help the governments decision-making regarding optimal course of action and resource allocation. Although these results are specific to Brazil, they can also
200
help guide similar analysis in other countries.
References
[1] World Health Organization . Coronavirus disease (covid-19)
out-break. 2020. URL: https://www.who.int/emergencies/diseases/
novel-coronavirus-2019.
205
[2] Minist´erio da Sa´ude . Linha do tempo coronav´ırus. 2020. URL: http: //coronavirus.saude.gov.br/linha-do-tempo.
[3] Minist´erio da Sa´ude . Notifica¸c˜ao de casos pelo novo coronav´ırus (COVID-19) - Plataforma Integrada de Vigilˆancia em Sa´ude. 2020. URL: http: //plataforma.saude.gov.br/novocoronavirus/.
210
[4] Brasil confirma transmiss˜ao comunit´aria de coronav´ırus;
en-tenda o que ´e. 2020. URL: https://noticias.uol.
com.br/saude/ultimas-noticias/redacao/2020/03/13/
brasil-confirma-transmissao-comunitaria-de-coronavirus-entenda-o-que-e. htm.
215
[5] Capitais de SP e RJ tˆem transmiss˜ao comunit´aria do
coro-nav´ırus. 2020. URL: https://noticias.r7.com/saude/
capitais-de-sp-e-rj-tem-transmissao-comunitaria-do-coronavirus-13032020; library Catalog: noticias.r7.com Section: Sa´ude.
[6] Minist´erio da sa´ude confirma transmiss˜ao comunit´aria no RJ
220
e em SP. 2020. URL: https://veja.abril.com.br/saude/
ministerio-da-saude-confirma-transmissao-comunitaria-no-rj-e-em-sp/; library Catalog: veja.abril.com.br.
[7] Code¸co CT, Cordeiro JdS, Lima AWdS, Colpo RA, Cruz OG,
Coelho FC, et al. The epidemic wave of influenza A (H1N1) in
225
Brazil, 2009. Cadernos de Sa´ude P´ublica 2012;28:1325–36. URL: https://www.scielosp.org/article/csp/2012.v28n7/1325-1336/. doi:10.1590/S0102-311X2012000700011.
[8] Official Airline Guide . OAG. 2020. URL: http://www.oag.com.
[9] IBGE - Instituto Brasileiro de Geografia e Estat´ıstica . Censo demogr´afico
230
2010: Resultados gerais da amostra. 2010. URL: http://www.ibge.gov. br/home/estatistica/populacao/censo2010/resultados_gerais_ amostra/resultados_gerais_amostra_tab_uf_microdados.shtm. [10] Minist´erio da Sa´ude . DATASUS - Informa¸c˜oes de Sa´ude - Rede
Assis-tencial. 2020. URL: http://www2.datasus.gov.br/DATASUS/index.php?
235
area=0204&id=11663.
[11] Gautreau A, Barrat A, Barth´elemy M. Global disease spread: Statis-tics and estimation of arrival times. Journal of Theoretical Biology 2008;251(3):509–22. URL: http://www.sciencedirect.com/science/ article/pii/S002251930700608X. doi:10.1016/j.jtbi.2007.12.001.
240
[12] Brockmann D, Helbing D. The Hidden Geometry of Complex,
Network-Driven Contagion Phenomena. Science 2013;342(6164):1337– 42. URL: https://science.sciencemag.org/content/342/6164/1337. doi:10.1126/science.1245200.
[13] Allen LJ, Brauer F, Van den Driessche P, Wu J. Mathematical
epidemiol-245
ogy; vol. 1945. Springer; 2008.
[14] Wu JT, Leung K, Leung GM. Nowcasting and forecasting the
potential domestic and international spread of the 2019-nCoV
out-break originating in Wuhan, China: a modelling study. The
Lancet 2020;395. URL: https://www.thelancet.com/journals/
250
lancet/article/PIIS0140-6736(20)30260-9/abstract. doi:10.1016/ S0140-6736(20)30260-9.
[15] Li Q, Guan X, Wu P, Wang X, Zhou L, Tong Y, et al. Early trans-mission dynamics in wuhan, china, of novel coronavirus–infected pneu-monia 2020;URL: https://doi.org/10.1056/NEJMoa2001316. doi:10.
255
1056/NEJMoa2001316; publisher: Massachusetts Medical Society eprint: https://doi.org/10.1056/NEJMoa2001316.
[16] Abbott S, Hellewell J, Munday J, CMMID nCoV working group , Funk S. The transmissibility of novel coronavirus in the early stages of the 2019-20 outbreak in wuhan: Exploring initial
point-260
source exposure sizes and durations using scenario analysis ????;5:17. URL: https://wellcomeopenresearch.org/articles/5-17/v1. doi:10. 12688/wellcomeopenres.15718.1.
[17] Chinazzi M, Davis JT, Mu K, Ajelli M, Dean NE, Gioannini C, et al. Esti-mating the risk of sustained community transmission of COVID-19 outside
265
mainland china 2020;:11URL: https://www.mobs-lab.org/uploads/
6/7/8/7/6787877/estimating_the_risk_of_sustained_community_ transmission_of_covid-19_outside_china.pdf.
[18] Li R, Pei S, Chen B, Song Y, Zhang T, Yang W, et al. Substantial undoc-umented infection facilitates the rapid dissemination of novel coronavirus
270
(covid-19). medRxiv 2020;.
[19] Liu T, Hu J, Kang M, Lin L, Zhong H, Xiao J, et al.
Transmis-sion dynamics of 2019 novel coronavirus (2019-nCoV). bioRxiv
2020;:2020.01.25.919787URL: https://www.biorxiv.org/content/
10.1101/2020.01.25.919787v1. doi:10.1101/2020.01.25.919787.
275
[20] Health at a glance 2019: OECD indicators. 2019. URL:
https://www.oecd-ilibrary.org/social-issues-migration-health/ health-at-a-glance-2019_4dd50c09-en; library Catalog: www.oecd-ilibrary.org.
[21] The Novel Coronavirus Pneumonia Emergency Response Epidemiology
280
Team . The epidemiological characteristics of an outbreak of 2019 novel coronavirus diseases (COVID-19) in China. Chinese Journal of Epi-demiology 2020;41(02):145–51. URL: http://rs.yiigle.com/yufabiao/ 1181998.htm. doi:10.3760/cma.j.issn.0254-6450.2020.02.003.
(c) Source: São Paulo Distância efetiva relativa Origem 1 - 1.5 1.5 - 2 2 - 3 3 - 4 4 - 4.87 Relative effective distance Source 1 - 1.5 1.5 - 2 2 - 3 3 - 4 4 - 4.87 (a) (b) Source: Rio de Janeiro Distância efetiva relativa Origem 1 - 1.5 1.5 - 2 2 - 3 3 - 4 4 - 7.1 Relative effective distance Source 1 - 1.5 1.5 - 2 2 - 3 3 - 4 4 - 7.1 0 0.2 0.4 0.6 0.8 1.0 (d)
Figure 1: (a) Relative effective distance (ef) of Brazilian micro-regions from S˜ao Paulo based
on airline network in the absence of travel restrictions; (b) the same from Rio de Janeiro, with blue gradient from closest (dark blue) to farthest (light blue) destinations, limited to those present on the airline network. Bottom panel uses both local and long-range mobility networks to estimate the (c) probability of COVID-19 outbreak per micro-region as Rio de Janeiro and S˜ao Paulo sustain high prevalence of infection; (D) second wave of outbreaks after the micro-regions infected in (d) begin to contribute cases, with a gradient from dark purple (p = 0) to bright yellow (p = 1.0).
2.5% 5% 7.5% 10%
12.5% 15%
Percentage of population above 60 yo. 0 2 4 6 8 10 12 14 Effecti ve d istan ce Rio de Janeiro Porto Alegre São Paulo Brasília B.Horizonte Salvador Curitiba Recife Florianópolis Fortaleza Goiânia 0.0 2.5 5.0 7.5 10.0 12.5 15.0 17.5 Effective distance 0.00 0.02 0.04 0.06 0.08 0.10 0.12 0.14 Density Source São Paulo Rio de Janeiro 0 5 10 15 20 25
Complementary beds per 10k individuals 0 2 4 6 8 10 12 14 Effective distance Type SUS 0 2 4 0 3 6 9 12 Type SUS Non SUS 0 10 20 30 40
Hospital beds per 10k individuals 0 2 4 6 8 10 12 14 Effective distance Type SUS Non SUS (a) (b) (c) (d)
Figure 2: Effective distance and potential impact for micro-regions in the airline network. Distribution of effective distance to each micro-region based on airline network (a) from S˜ao Paulo (blue line) and Rio de Janeiro (orange line). Relationship between effective distance
from S˜ao Paulo and percentage of population above 60 years old (b) for each micro-region,
with the source and 10 closest micro-regions highlighted for reference. Bottom panels (c-d)
show effective distance from S˜ao Paulo by (c) number of hospital beds, and (d) number of
complementary beds (ICU and intermediary care) per 10,000 individuals in each micro-region, by health care category: SUS (blue circles) and non SUS (orange circle).
Percentual da população acima de 80 anos 0% - 2% 2% - 4% 4% - 6% 6% - 8% 8% - 10% 10% - 12% 12% - 14% 14% - 16% 16% - 17% 0% - 2% 2% - 4% 4% - 6% 6% - 8% 8% - 10% 10% - 12% 12% - 14% 14% - 16% 16% - 17% Percentage of population
above 60 yo. Percentual da populaçãoacima de 80 anos
0% - 0.5% 0.5% - 1% 1% - 1,5% 1,5% - 2% 2% - 2,5% Percentage of population above 80 yo. 0% - 0.5% 0.5% - 1% 1% - 1,5% 1,5% - 2% 2% - 2,5% (a) (b) (c) (d) Total de leitos por 10 mil hab.
8 - 10 10 - 20 20 - 30 30 - 40 40 - 50 50 - 60 Number of beds by 10k inhabitants 8 - 10 10 - 20 20 - 30 30 - 40 40 - 50 50 - 60 Leitos complementares por 10 mil hab.
NA 0.5 - 2 2 - 4 4 - 6 6 - 8 8 - 10 29.5 Complementary beds by 10k inhabitants NA 0.5 - 2 2 - 4 4 - 6 6 - 8 8 - 10 29.5
Figure 3: (A) Distribution of population above 60 years of age. (B) Same as (A) for people above 80 years of age. (C) Number of standard hospital beds per 10,000 inhabitants. (D) Number of complementary beds per 10,000 inhabitants. In all maps, only the micro-regions present in the airline network are shown.