SPATIAL ANALYSIS OF STRESS CONDITIONS INSIDE
BROILER HOUSE UNDER TUNNEL VENTILATION
Miwa Yamamoto Miragliotta1; Irenilza de Alencar Nääs1*; Rodrigo Lilla Manzione2; Fernando Ferraz do Nascimento3
1
UNICAMP - Faculdade de Engenharia Agrícola - Campinas - C.P. 1170 - 13083-970 - Campinas, SP - Brasil. 2
INPE - Divisão de Processamento de Imagens - Av. dos Astronautas, 1758 - 12227-010 - São José dos Campos, SP- Brasil.
3
UNICAMP - Instituto de Matemática, Estatística e Computação - C.P. 6065 - 13083-859 Campinas, SP - Brasil. *Corresponding author <[email protected]>
ABSTRACT: Broiler building typology associated with the local characteristics (climate, topography and surrounding vegetation) and handling systems (stocking density, curtains, equipment and nutrition) influence the inside environment. A spatial distribution analysis of these conditions may indicate stress zones in the house. The aim of this research was to apply spatial analysis of thermal, aerial and acoustic environmental conditions inside a tunnel ventilated broiler housing, with a stocking density of 18 birds m-2
. This study was carried out in Rio Claro, SP, Brazil, in a 12 m × 115 m house divided into three equal
sections (East, center and West), East-West oriented, and virtually divided on 132 cells, each one measuring 3.0 m × 3.5 m. At the geometric center of each cell the following variables were monitored: dry
bulb temperature, relative humidity, air velocity, noise level and light intensity. Average broiler mortality was recorded in each of the three sections. Data collection was made systematically from West to East, opposite to the air flow produced by the tunnel ventilation system, during the warmest period of the day. Measurements took place during the sixth week of production. A geostatistics software tool was used to build spatial distribution maps of the recorded variables in order to infer intermediate stress conditions. It was concluded that the stress zones were located at both ends of the house and the highest mortality index was found at the West sector where the exhaust fans were placed.
Key words: broiler production, environment, geostatistics, heat stress, spatial distribution
ANÁLISE ESPACIAL DE CONDIÇÕES DE ESTRESSE EM GALPÃO
DE FRANGO DE CORTE USANDO VENTILAÇÃO TIPO TÚNEL
RESUMO: A tipologia de edificações para abrigo de frangos de corte associada a características do local (clima, topografia e vegetação dos arredores) e os sistemas de manejo (densidade de aves, cortinas, equipamentos e nutrição) influencia as condições internas. A distribuição espacial destas variáveis pode indicar zona de estresse dentro do galpão. O objetivo da pesquisa foi aplicar a análise espacial das condições do ambiente térmico, aéreo e acústico dentro de galpão de produção de frango de corte, usando sistema de ventilação tipo túnel e densidade de 18 aves m-2. O estudo foi conduzido em Rio Claro, SP, em uma edificação com 12 m × 115 m, dividida em três setores (leste, centro e oeste),
orientada leste-oeste, contendo virtualmente 132 células, cada uma medindo 3,0 m × 3,5 m. No centro
geométrico de cada célula as seguintes variáveis foram medidas instantaneamente: temperatura de bulbo seco, umidade relativa, velocidade do ar, nível de ruído e intensidade de luz. Os dados foram coletados sistematicamente a partir do lado oeste para o lado leste, em direção oposta ao fluxo de ar produzido pela ventilação tipo túnel, no período mais crítico do dia. As medidas foram tomadas quando as aves estavam na sexta semana de produção. A mortalidade média dos frangos foi registrada nos três setores. A ferramenta geostatística foi usada para construir mapas de distribuição espacial das variáveis resultantes de maneira a possibilitar a inferência de posições intermediárias. Concluiu-se que as zonas de estresConcluiu-se estão localizadas nos extremos do galpão e o maior índice de mortalidade foi encontrado no setor oeste, onde estavam os exaustores.
Palavras-chave: produção de frango, ambiente, geostatística, estresse térmico, distribuição espacial
INTRODUCTION
Broiler production under hot weather condi-tions is well documented (Macari & Gonzales, 1990;
in-side broiler houses under tropical conditions is mainly achieved by the use of forced ventilation associated to fogging (Pereira, 1991; Bottcher et al., 1991; Gates et al., 1991, Czarick & Lacy, 1999) Controlling the physical micro environment in broiler production houses is an important decision to optimize the pro-duction process (Bottcher et al., 1991; Gates et al., 1998; Hamrita & Mitchell, 1999), however there is no report in the literature indicating where the critical points or areas (according to the concepts of Hazard Analytical and Critical Control Points, HACCP, 2005) are located inside houses.
The concepts of geostatistics (Krige, 1951; Matheron, 1963) have been applied to several knowl-edge fieds (Buxton & Pate, 1993; Hunt, 1996; Seixas et al., 1996; Vieira, 2000), and classical statistical analysis has been replaced by the geostatistics ap-proach when the semi-variogram and other methods of interpolating variables are used (Isaaks & Srivastava, 1989). In order to analyze the critical points in the pro-duction chain as well as to properly evaluate the wel-fare status of broilers, geostatistical models can pro-vide accurate maps of variables including production, handling, health status and behavior. Geostatistical models also explore the variability and the continuity of a group of data with spatial regionalization, assum-ing that spatial uncertainty is controlled by the aver-age statistical properties of the studied environment.
The aim of this research was to generate spa-tial analysis of aerial, thermal and acoustic variables inside a commercial broiler house using tunnel venti-lation to identify critical areas.
MATERIAL AND METHODS
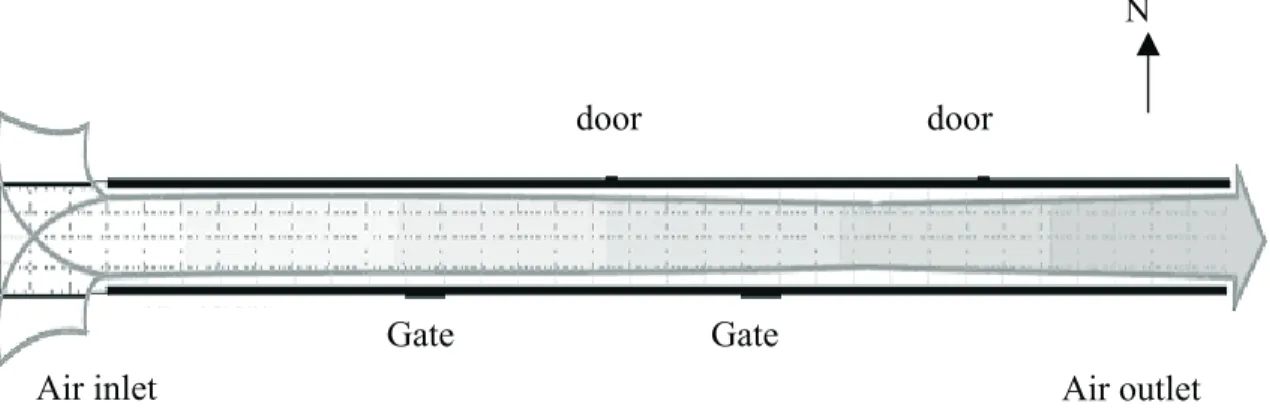
This study was performed during summer, near Rio Claro, SP, Brazil (47°37’52’’ W and 22°24’54’’ S) with prevailing SE winds, in a East-West oriented commercial broiler house 12 m wide (Y) and
115 m long (X) divided in three sections (East, center and West). Air inlet was at the West side (Figure 1) and the exhausting fans placed on the East side had a maximum flow capacity of 10.5 m-3
s-1
. Local aver-age daily summer dry bulb temperature was 22.5°C and 80% relative humidity.
The house was divided in 132 equally sized vir-tual cells, measuring 3.0 m × 3.5 m. At the center of each cell the following variables were monitored: dry bulb temperature, °C (DBT); relative humidity, % (RH); air velocity, m s-1 (AV); noise level (NL), dBA; and light intensity (LI), Lux m-2
. A portable hydro-thermo anemometer (Pacer, USA) was used to collect DBT, RH and AV data while a decibel meter (class II-SVAN 943) was used to record the acoustic pressure level. To measure light intensity a luximeter (Hagner®, USA) was used. Data collection was made systemati-cally from West to East during a hot critical daily pe-riod (14:00 to 17:00 h). The recording of the variables took place with the ventilation system in a steady-state condition. The measurements recorded in each cell took approximately 30-40s.
Data recording was made with a population of 22,000 birds at the sixth week of production, when the heat stress and air quality were considered to be a chal-lenge to the birds. Data were measured simultaneously in each cell for 15s after waiting 10s to stabilize bird movements and their respective noise generated by the presence of the data collector. The instruments were arranged in a small box which allowed the displacement of all equipment at the same collecting height (0.25 m above the floor). Accumulated average mortality dur-ing the trial was calculated by countdur-ing the dead birds in each section (East, center and West) related to the total of birds reared at each specific section.
Geostatistic analysis was used to build the in-dividual spatial distribution maps of the variables, us-ing the concept that the variance between data sam-pling would enhance their spatial dependence as pointed
out by Matheron (1963). It was assumed that the pro-cesses were second order stationary, meaning that the stochastic process can be described by the mean, the variance is constant, and the autocorrelation function exists. The mean (µ) is defined as the expected value of Z(xr):
)] ( [Z x
E r
=
µ (1)
where
∑
= = n i x Z n 1 ) ( 1 ˆ rµ (2)
The variance of a stochastic process Z(xr)is defined by Equation 3 and estimated by Equation 4:
] ) ) (
[( 2
2= −µ
x Z E
SZ r (3)
∑
= − − = n iZ Z x Z x
n S 1 2 2 )) ( ) ( ( 1 1
ˆ r r (4)
where Z(xr)is the average form for estimating the vari-ance Z(xr).
The autocovariance for lag h is defined by:
2 0 )] ) ( ( * ) ) ( [( Z h S h x Z x Z E = − + − = γ µ µ
γ r r r (5)
assuming that for lag 0 the autocovariance equals the variance. Assuming also that the second order station-ary process the variogram is given by Equation 6, and estimated by Equation 7, where N (h) is the number of measured pairs Z(xr) and Z(xr+h) , separated by a vector h.
} {Z(x)-Z(x+h) 2 E
1/2 =
(h) r r
γ (6)
] h) + x Z( -) x [Z( ) N(h 2 1 = (h) 2 N(h) 1 = i r r
∑
γˆ (7)
the graph of γˆ(h)as a function of the vector h can be obtained. It depends on the magnitude and direction of h, illustrating the relation between sample variance and lateral distances.
From a theoretical model adjusted to the ex-perimental data, the variogram will provide informa-tion to the kriging system, in order to attribute differ-ent weights based on modeled range distance of the variogram for spatial interpolation. This system can be written as:
∑
=
= N
i iZ x
x Z
1 0) ( )
(
ˆ r λ r (8)
where: N is the number of measured values Z(xr)
in-volved with the estimates, and λ
i is the associated
weight for each measured value Z(xr) which is a lin-ear estimator, unbiased and with minimum variance (Isaaks & Srivastawa, 1989).
RESULTS AND DISCUSSION
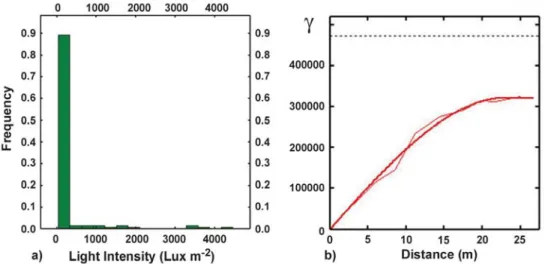
Estimated values of minimum, maximum, mean and variance of each variable (Table 1) show that the light distribution was the most variable as a result of the high intensity of light at the open wall in the West side of the building (air inlet) compared with the rest of the house. On the other hand DBT and AV data presented the lowest variability.
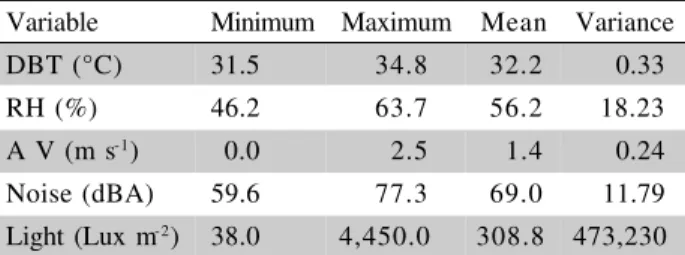
The DBT data distribution was explained based on a Gaussian model among other tested models (Fig-ure 2), where the nugget effect (residual effect) was 0.017, superior limit at 0.22 and range of 31.0 m. This means that up to 0.017 lag the model is only explained by the values of the nugget effect (unexplained vari-ance). Up to the point in the y axis where the curve stabilizes (0.22) the Gaussian model fits and explains the data variation, and the upper limit of the variogram (sill). The range is the limit point where the variables are dependent, and the value of 31 m range reveals that after these distances samples do not have spatial dependence, being independent observations for greater distances.
An estimative map based on DBT ordinary kriging is shown in Figure 3. An area of high tempera-tures (above 33°C) near both air inlet and outlet is clearly defined. At the air inlet, air temperature was the same as the outside air during data recording (16h00). The map shows that air temperature decreased to approxi-mately 31°C along the building due to the effect of the fogging system. Near to the outlet, air temperature pre-sented a sharp increase along the last 20 m, reaching 34°C. This temperature profile indicates critical points where DBT distribution may represent a challenge for bird occupancy of the floor area. However, this dem-onstrates also the importance of reducing temperature by using evaporative cooling (Gates et al., 1991).
Variable Minimum Maximum Mean Variance DBT (°C) 31.5 34.8 32.2 0.33 RH (%) 46.2 63.7 56.2 18.23 A V (m s-1) 0.0 2.5 1.4 0.24 Noise (dBA) 59.6 77.3 69.0 11.79 Light (Lux m-2) 38.0 4,450.0 308.8 473,230 DBT = Dry Bulb Temperature (°C); RH = Relative Humidity (%); Air Vel = Air Velocity (m s-1);
Accumulated mortality (%) was found to be 2.14% in the West sector, 1.61% in the center sector and 0.98% in the East. By overlapping recordings of DBT and accumulated mortality a critical area was found according to the HACCP (2005) concepts, at the West sector close to the air inlet (35°C >DBT>32°C). Macari & Gonzales (1990) and Bottcher & Czarick (1997) attribute high environmental tem-perature as the main factor influencing both produc-tivity and mortality especially in adult birds.
Relative humidity distribution fitted to an ex-ponential model, and the map can be seen in Figure 4. This model was the best choice between all tested models, with the best fit to the experimental variogram and lowest errors. For this variable the nugget effect (residual effect) was zero, upper limit 6.35 and range of 16.6 m. The estimated map obtained from the geostatistics analysis suggested a distinct pattern of that observed in the DBT map, explained by the psychro-metric characteristics of the air.
Figure 2 - Histogram (a) and structural analysis (Variogram) (b) of dry bulb temperature inside the broiler house.
The exploratory analysis of the air velocity dis-tribution along the building showed that this variable did not present a consistent spatial variability, and its variogram showed a residual effect meaning that the values are independent and randomic. The low value obtained for the variance indicated that the use of tun-nel ventilation led to equalization of wind speed inside the housing, as it should if properly designed and op-erated.
According to Czarick & Lacy (1999) birds ex-posed to environmental temperatures around 33°C and 1.0 m s-1
wind speed tend to feel thermal comfort as if the temperature would be around 26.6°C. However, the house temperatures were still excessive at both ends, and cooling was insufficient to maintain the bird’s thermal comfort. Both air inlet and outlet sec-tions can be classified within the stress zone as pro-posed by Gates et al. (1991) and Deaton et al. (1997). An exploratory analysis of the noise level (NL) indicated a normal distribution of the values and was fitted by an exponential model with residual effect of 4.54, upper limit 13.54 and range 33.1 m. The esti-mated map generated by ordinary kriging is presented
in Figure 5. Highest values of noise levels were re-corded near both ends of the building (greater than 75 dBA) and lower levels in the middle (values lower than 64 dBA). There is an explanation for the high level of noise at the air outlet due to the exhaust fans, how-ever the reason for higher values in the inlet was not identified.
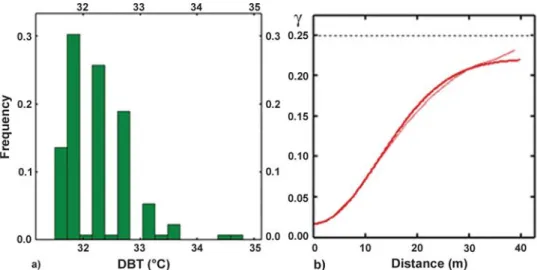
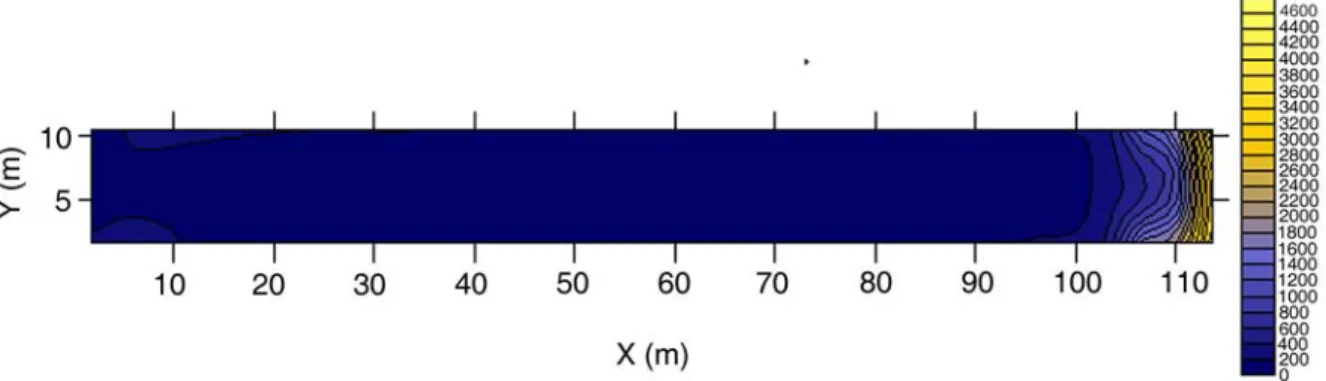
Light intensity exploratory analysis showed a considerable asymmetric distribution of the data as a result of large amount of lower values and some higher values at the air inlet. This distribution presented a log-normal common and rare event; consequently the vari-ance (steady calculated as 473.2 103) of this type of data usually presents higher values as observed in this study. Figure 6 shows that data was fitted by a spheri-cal model without nugget effect, upper limit 320.8 103
and range 23.0 m. The estimated map obtained by or-dinary kriging did not show clearly the variability of these results, nevertheless the differences obtained in this preliminary evaluation reflected the distribution in the building (Figures 7 a, b).
Light intensity results obtained from cells near the curtain along the building presented higher values
Figure 5 - Noise level distribution estimated map (NL, dBA). Contour interval 1 dBA.
than cells in the middle. However, this pattern was im-perceptible from this first geospatial analysis. The re-moval of outliers from the West side cells position can be suggested for future evaluations, eliminating ex-tremely high values, in order to determine a more de-tailed map of the light variation of the tunnel.
Like for DBT, high values of noise level from bird vocalization, and light intensity (LI) from the out-side environment were found at both ends of the build-ing. High light exposure inside poultry housing may in-duce aggressive behavior to the birds at high stocking density (Bottcher & Czarick, 1997), and dark blue cur-tains are used to reduce sunlight incidence. In this spe-cific study it was not clear if high light exposure in-duced bird’s high vocalization, since birds tend to pros-trate under high temperature associated to high solar incidence.
Critical housing conditions of the aerial, ther-mal and acoustic environment were found in the West sector which also presented higher mortality (2.14%). In recent years new approaches for food safety and food quality have been developed facing the search for technology in order to meet consumer de-mand. Today both control and inspection are performed using check-lists, ranking systems, assessment of sup-pliers, the monitoring of environmental conditions and flock health, to reveal risk elements in each produc-tion stage. Using geostatistics concepts of data inter-polation the picture of risk points could be determined assuring the mapping of variables associated to pro-duction, handling, health and behavior. Furthermore, associating to traceability tools as well as flock identi-fication the results may meet the needs and require-ments of future international meat commerce.
CONCLUSIONS
Geostatistics analysis offers a tool for under-standing some relations between aerial, thermal and acoustic environmental variables and their spatial
vari-ability. Both air inlet and outlet sectors of the analyzed broiler house presented the less favorable environment conditions with high values of dry bulb temperature and light intensity occurring simultaneously with high vocalization of the birds expressed by high noise level. The association of these results to highest mortality in the West sector indicated stressful conditions for reared broilers.
ACKNOWLEDGEMENTS
To FAPESP for financial support as well as to CNPq for a scholarship.
REFERENCES
ARADAS, M.E.C.; NÄÄS, I.A.; SALGADO, D.D. Comparing the thermal environment in broiler houses using two bird densities under tropical conditions. CIGR E-Journal,v.7, p.1-12, 2005. BOTTCHER, R.W.; BAUGHMAN, G.R.; GATES, R.S.; TIMMONS, M.B. Characterizing efficiency of misting systems for poultry.
Transactions of the ASAE, v.34, p.586-590, 1991. BOTTCHER, R.W.; CZARICK, M. Tunnel ventilation and
evaporative cooling for poultry. North Carolina: Cooperative Extension Service, 1997. 11p. (AG-554).
BUXTON, B.E.; PATE, A.D. Joint temporal-spatial modeling of concentrations of hazardous pollutants in urban air. In: DIMITRAKOPOULOS, R. (Ed.) Geostatistics for the next century. Dordrecht: Kluwer Academic Publishers, 1993. p.75-87.
CZARICK, M.; LACY, P.M. Importance of air movement vs. bird age. Athens: University of Georgia of Agriculture, 1999. 16p. (Technical Bulletin).
DEATON, J.W.; REECE, F.N.; MCNAUGHTON, N. The effect of temperature during the growing period on broiler performance.
Poultry Science, v.57, p.1070–1074, 1997.
GATES, R.S.; URSY, J.L.; NIENABER, J.A.; TURNER, L.W.; BRIDGES, T.C. Optimal misting method for cooling livestock housing. Transactions of the ASAE, v.35, p. 2199-2206, 1991. GATES, R.S.; ZHANG, H.; COLLIVER, D.G.; OVERHULTS, D.G. Regional variation in temperature humidity index for poultry housing. Transactions of the ASAE, v.38 p.197-205, 1998. HAMRITA, T.K.; MITCHELL, B. Poultry housing control: A
summary of where we are and where we want to go. Transactions of the ASAE, v.42, p.479-483, 1999.
HUNT, L.E. Geostatistical modeling of species distributions. Implications for ecological and biogeographical studies. In: GEOENV I – EUROPEAN CONFERENCE ON GEOSTATISTICS FOR ENVIRONMENTAL APPLICATIONS, 1., Lisboa, 1996.
Proceedings. Dordrecht: Kluwer Academic Publishers, 1996. p.427-438.
ISSAKS, E.H.; SRIVASTAVA, M. An introduction to applied geoestatistics. New York: Oxford University Press, 1989. 560p. KRIGE, D.G. A statistical approach to some basic mine evaluation problems on the witwatersrand. Journal of Chemical Metallurgical and Minning Society of South African, v.52, p.119-139, 1951.
MACARI, M.; GONZALES, E. Fisiopatogenia da síndrome da morte súbita em frangos de corte. In: CONFERÊNCIA APINCO DE CIÊNCIA E TECNOLOGIA AVÍCOLAS, Campinas, 1990.
Proceedings. Campinas: APINCO, 1990. p.65-73.
MATHERON, G. Principles of geostatistics. Economic Geology, v.58, p.1246-1266, 1963.
Received June 20, 2005 Accepted July 27, 2006
PEREIRA, A.M. Estresse calórico em poedeiras comerciais. In: SEMINÁRIO DE POSTURA COMERCIAL, Guabi, 1991.
Anais. Guabi, 1991. p.135-145
SEIXAS, J.; FERREIRA, F.; NUNES, C.; SILVA, J.P. Space-time analysis of air pollution in Lisbon. In: GEOENV I – EUROPEAN CONFERENCE ON GEOSTATISTICS FOR ENVIRONMENTAL APPLICATIONS, 1., Lisboa, 1996. Proceedings. Dordrecht: Kluwer Academic Publishers, 1996. p.401-414.