ISSN: 1809-4430 (on-line) www.engenhariaagricola.org.br
1 Universidade de Brasília, Faculdade de Agronomia e Medicina Veterinária/ Brasília – DF.
Received in: 8-31-2017 Accepted in: 4-24-2018
Doi: http://dx.doi.org/10.1590/1809-4430-Eng.Agric.v38n4p546-552/2018
RETENTION CURVES AND AVAILABLE WATER CAPACITY IN LATOSOLS
Felipe C. de O. Maia
1, Vinicius B. Bufon
2*, Tairone P. Leão
12*Corresponding author. Empresa Brasileira de Pesquisa Agropecuária, Embrapa Cerrados/ Planaltina - DF. E-mail: [email protected]
KEYWORDS
field capacity,
permanent wilting
point, van Genuchten,
tropical soils.
ABSTRACT
Water stored in the soil between field capacity and the permanent wilting point, is known
as the available water capacity. Its availability to be effectively used by plants depends on
the type of soil and its water retention characteristics. The aim of this work was to
compile information about water retention curves in Latosols, and to provide a first
approximation of values and most likely amplitudes for water storage and available water
capacity of these soils. The database was constituted from information collected from
articles, theses, dissertations and other publications. Soil water retention curves, as well as
available water, were estimated for the order Latosols, and for the suborders Red Latosol
(RL), Red-Yellow Latosol (RYL) and Yellow Latosol (YL). RL presented the lowest
amplitude of water storage between field capacity and permanent wilting point, resulting
in lower available water capacity compared to Yellow and Red-Yellow Latosols. YL
presented the highest available water capacity among analyzed soils.
INTRODUCTION
Latosols cover approximately 32% of Brazilian territory (EMBRAPA, 2013) and encompass about 50% of areas used for agriculture in the Southeast and Center-West regions, being an important type of soil for Brazilian agriculture (Ferreira, 2010; Medrado & Lima, 2014). Knowledge of the textural composition and structure of these soils has been useful for a better understanding and evaluation of their retention properties, and the availability and transportation of water, gases and nutrients, which directly affect plant growth (Leão, 2016; Zhao et al., 2016).
Adequate determination of the soil's physical characteristics and water retention processes is crucial to understanding the availability of water to plants (Teixeira et al., 2005), since they contain indispensable information about the soil's condition and physical behavior over time (Cresswell & Lilly, 2015), and allows for the correct implementation of hydrological models to optimize water use (Lima et al., 2011).
The variability of soil physical properties, such as density and porosity, and sand, silt and clay content, result in changes in retention characteristics and available water capacity (AWC) of soils (Abel et al., 2013). AWC is defined as the water content retained between field capacity (FC) and permanent wilting point (PWP), being
an important tool in the monitoring and calculation of soil water balance (Horne & Scotter, 2016).
Studies that aim at data mining from "big data" have strategic importance as an alternative to generate knowledge, especially for the modeling of production systems, to promote resource savings and greater ease of access to users interested in such information. Therefore, since the information on retention curves and water storage in Latosols is scattered in the literature, the objective of this work is to bring it together. Through its organization and reanalysis (meta-analysis), we intend to provide a first approximation of values and amplitudes of water storage more likely to be found in these soils, because there is a natural variability of this parameter for the same order or suborder.
MATERIAL AND METHODS
and Soil Science Society of America Journal (https://dl.sciencesocieties.org/publications/sssaj).
The search procedure was performed using the following terms: "Latosol", "water retention curve in soil", "van Genuchten equation parameters", "available water capacity", "soil moisture" and " water available in Latosols". The variables of interest were: order and suborder (EMBRAPA, 2013), sampling depth, texture classification, density of soil (Ds), total porosity (Pt), adjustment parameters of soil water retention curve (van Genuchten, 1980) and the method used to determine soil water retention curves. Data were duly referenced and systematized in an MS Excel® spreadsheet.
Data were classified and filtered to eliminate discrepancies and values that did not represent the characteristic behavior of water retention curves for the soils in question. This procedure was performed by inserting the values of retention curve parameters and generating graphs to detect parameter sets in which there was no convergence, in the non-linear regression adjustment procedure. The descriptive statistics, normality test (Shapiro & Wilk, 1965), correlation matrix and Pearson coefficient of the dataset, including its respective significance (p), was performed using R statistical analysis software (R Development Core Team, 2014).
Water retention curves representing the Latosol order and the Red Latosol (RL), Red Yellow Latosol (RYL) and Yellow Latosol (YL) suborders, were generated based on the analysis of the parameters of the van Genuchten equation (Equation 1) included in the database. The restriction of Mualem (1976) was used for the calculation of the "m" parameter. In order to obtain information that represents both the most representative value and the range of AWC variation, the median, the first and the third quartile of parameter distribution were used.
𝜃 = 𝜃𝑟+[1+(𝛼𝜓)(𝜃𝑠−𝜃𝑟𝑛)]𝑚 (1)
Where,
θ - volumetric water content (m3 m-3); θs - saturated water content in soil (m3 m-3); θr - residual water content in soil (m3 m-3);
𝜓 - absolute value of matric potential (kPa); α - inverse of air entry value (kPa-1), n, m - empirical parameters of curve shape.
Based on this, three water retention curves representative of the Latosol order were generated. One of the curves was generated from the median parameters (Med), and the other two from the parameters obtained by the first quartile (Q1) and by the third quartile of distribution (Q3). The same methodology was used to generate the three retention curves for Red Latosol (RL), Red-Yellow Latosol (RYL) and Yellow Latosol (YL) suborders.
AWC was estimated from the retention curves generated in this work. For the calculation of AWC, we assumed a water content retained between 10 kPa (Reichardt, 1988) and 1,500 kPa (Kirkham, 2004), which correspond to the water tensions at field capacity and at permanent wilting point respectively.
RESULTS AND DISCUSSION
Database characterization and statistical analysis
A total of 235 pieces of data of water retention curves in Latosols were collected from 23 published works, and descriptive statistics results are presented in Table 1. Data for "Bruno" (Yellow-Reddish) Latosols were not mentioned in the works of interest and therefore were not included in the database. This absence reflects the lesser territorial coverage of these soils and, consequently, the low number of references in the literature.
None of the variables presented a normal distribution when submitted to the Shapiro-Wilk test for normality (Table 1). In every case, probability values calculated using the test were much lower than the critical value of p = 0.05 adopted in this work, indicating that the null hypothesis that the data are from a normally distributed population should be rejected. According to Leão (2016), the absence of normality may occur for studies in which different datasets are grouped to compose metadata. The correlation matrix and Pearson coefficient for the main attributes of the soil are shown in Table 2.
Attributes Mean Median Standard deviation Minimum Maximum Shapiro-Wilk (p < W) Sand (g kg-1) 400. 46 345.00 225.96 33.00 878.00 5.29x10⁻¹⁰ Silt (g kg-1) 131.71 110.00 85.96 0.00 440.00 5.46x10-09 Clay (g kg-1) 469.25 504.00 184.23 76.00 900.00 2.05x10-05 Ds (kg m-³) 1264.52 1240.00 219.17 790.00 1751.00 9.48x10-04 Pt (m³ m-³) 0.52 0.53 0.08 0.34 0.70 8.74x10-04
θs (m³ m-³) 0.49 0.52 0.14 0.15 0.73 8.03x10-09
θr (m³ m-³) 0.20 0.20 0.07 0.03 0.32 1.30x10-07
n 1.89 1.60 0.86 1.14 6.18 4.50x10⁻²² mcalc 0.41 0.37 0.15 0.12 0.84 2.17x10-08
α (kPa) 1.43 0.49 3.57 0.00 39.63 9.27x10⁻²⁸
FC (m³ m-³) 0.33 0.35 0.09 0.10 0.57 6.14x10-04 PWP (m³ m-³) 0.21 0.23 0.07 0.03 0.32 4.98x10-08 AWC (m³ m-³) 0.12 0.10 0.07 0.01 0.34 8.28x10⁻¹⁵
Ds - Soil Density; Pt - Total porosity; mcalc - "m" calculated as 1-1 /n; FC - Field Capacity; PWP- Permanent Wilting Point; AWC - Available Water Capacity.
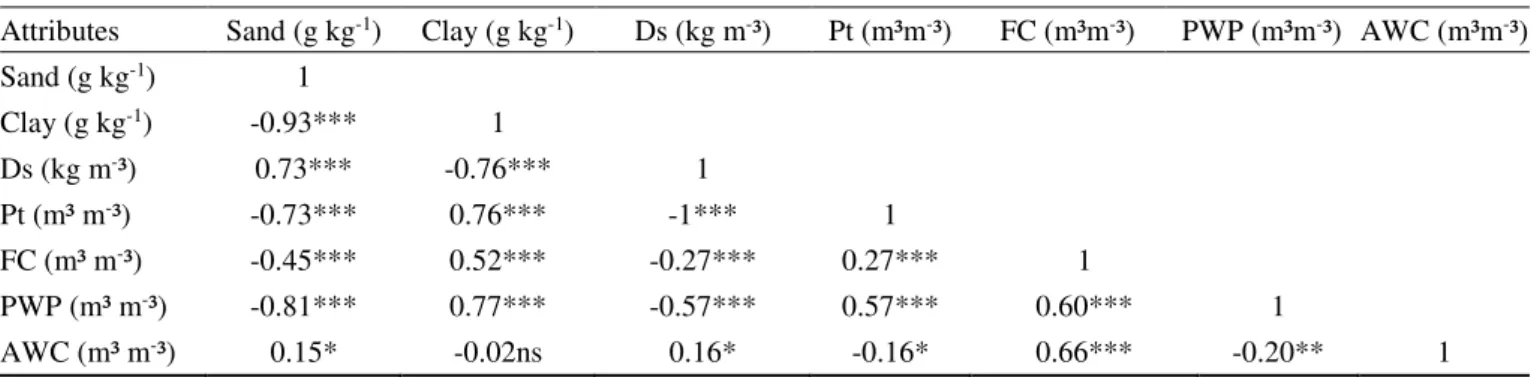
TABLE 2. Pearson correlation for main soil attributes
Attributes Sand (g kg-1) Clay (g kg-1) Ds (kg m-³) Pt (m³m-³) FC (m³m-³) PWP (m³m-³) AWC (m³m-³) Sand (g kg-1) 1
Clay (g kg-1) -0.93*** 1
Ds (kg m-³) 0.73*** -0.76*** 1
Pt (m³ m-³) -0.73*** 0.76*** -1*** 1
FC (m³ m-³) -0.45*** 0.52*** -0.27*** 0.27*** 1
PWP (m³ m-³) -0.81*** 0.77*** -0.57*** 0.57*** 0.60*** 1
AWC (m³ m-³) 0.15* -0.02ns 0.16* -0.16* 0.66*** -0.20** 1 nsnonsignificant; * significant at 0.05; ** significant at 0.01; *** significant at 0.001
Attainment of Retention Curves and Available Water Capacity
Mean and median are measures of central tendency, and in a set of normally distributed data, both will be close to each other. The main restriction to the use of the arithmetic mean is because it is very sensitive to extreme values, and should be avoided in the analysis of data with an asymmetric distribution. When the distribution is asymmetrical, the median should preferably be used (Ott & Longnecker, 2016). Since the analyzed dataset was not normally distributed (Table 1), the median was adopted for comparison and discussion of results.
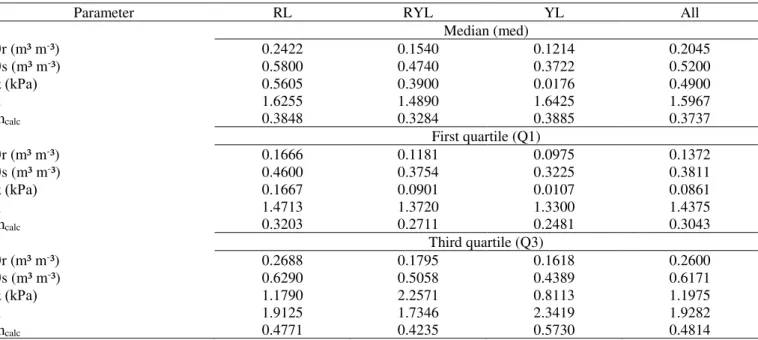
TABLE 3. Parameters of the van Genuchten equation generated from the database for the suborders Red Latosol (RL) Red-Yellow Latosol (RYL), Red-Yellow Latosol (YL) and for grouped data (All).
Parameter RL RYL YL All
Median (med)
θr (m³ m-³) 0.2422 0.1540 0.1214 0.2045
θs (m³ m-³) 0.5800 0.4740 0.3722 0.5200
α (kPa) 0.5605 0.3900 0.0176 0.4900
n 1.6255 1.4890 1.6425 1.5967
mcalc 0.3848 0.3284 0.3885 0.3737
First quartile (Q1)
θr (m³ m-³) 0.1666 0.1181 0.0975 0.1372
θs (m³ m-³) 0.4600 0.3754 0.3225 0.3811
α (kPa) 0.1667 0.0901 0.0107 0.0861
n 1.4713 1.3720 1.3300 1.4375
mcalc 0.3203 0.2711 0.2481 0.3043
Third quartile (Q3)
θr (m³ m-³) 0.2688 0.1795 0.1618 0.2600
θs (m³ m-³) 0.6290 0.5058 0.4389 0.6171
α (kPa) 1.1790 2.2571 0.8113 1.1975
n 1.9125 1.7346 2.3419 1.9282
mcalc 0.4771 0.4235 0.5730 0.4814
mcalc - "m" calculated as 1-1/n
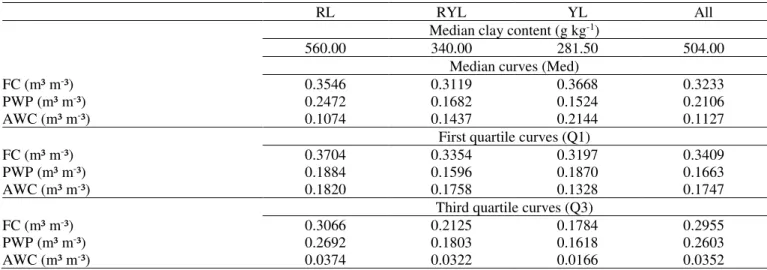
Although the YL presented the highest water content at FC (Table 4), it also presented the lowest water content retained at PWP, contributing to the fact that this soil presents the highest AWC among Latosol suborders. The RL presented high values of water content retained at FC, but also presented the highest water contents at PWP and, consequently, the lowest AWC. This finding is in line with the results found by Beutler et al. (2002), and demonstrates that high water retention in the RL matrix does not necessarily result in higher AWC, since water retention at higher tensions, such as PWP, is proportionally higher, reducing total water availability (AWC) to plants.
TABLE 4. Clay content, field capacity (FC), permanent wilt point (PWP) and available water capacity (AWC) for the suborders RL, RYL, YL and grouped data.
RL RYL YL All
Median clay content (g kg-1)
560.00 340.00 281.50 504.00 Median curves (Med)
FC (m³ m-³) 0.3546 0.3119 0.3668 0.3233 PWP (m³ m-³) 0.2472 0.1682 0.1524 0.2106 AWC (m³ m-³) 0.1074 0.1437 0.2144 0.1127
First quartile curves (Q1)
FC (m³ m-³) 0.3704 0.3354 0.3197 0.3409 PWP (m³ m-³) 0.1884 0.1596 0.1870 0.1663 AWC (m³ m-³) 0.1820 0.1758 0.1328 0.1747
Third quartile curves (Q3)
FC (m³ m-³) 0.3066 0.2125 0.1784 0.2955 PWP (m³ m-³) 0.2692 0.1803 0.1618 0.2603 AWC (m³ m-³) 0.0374 0.0322 0.0166 0.0352
Silva et al. (1998) observed that the higher content of Al oxides in RL's clay fraction, such as gibbsite, favors greater aggregation and preservation of microgranular structure in these soils, causing retention and, consequently, making water absorption more difficult for the plant in energetic terms. According to Dumig et al. (2012) and Heister (2016), clay minerals and pedogenetic oxides and hydroxides provide substantial surface area for these soils, significantly contributing to a higher solution sorption capacity in a porous medium. RYL and YL tend to have higher contents of goethite and kaolinite than hematite, due to the higher humidity conditions in which these soils are found, interfering with the degree of weathering of the minerals, which justifies the higher sand contents found in these soils (Kampf et al., 2012, Leão et al., 2013).
Fe oxyhydroxides (goethite, responsible for a yellowish soil color and hematite, responsible for a reddish color) and Al oxyhydroxides (gibbsite) are mostly dispersed in soil mass, with several degrees of crystallinity and in the form of organic complexes (Ker, 2003). Characteristic Latosol horizons are usually composed of a strong structure of microaggregates, associated with the interaction between Fe and Al oxyhydroxides, clay minerals and organic matter. Clay content is usually high in these soils, while sand and silt content is often low. However, when Latosol suborders are compared, RLs are located in better-drained areas, and display higher clay content and hematite predominance, indicating the existence of aerobic conditions and higher weathering degrees (Silva et al., 1998). RYLs and YLs, in turn, present higher contents of goethite and kaolinite than
hematite, due to the higher hydromorphic conditions in which these soils are found, interfering with the degree of weathering of the minerals, which corroborates the higher sand content found in these soils (Kampf et al., 2012; Leão et al., 2013).
Another important factor in Latosol mineralogy and its relations with water content is the isomorphic substitution of Fe by Al in goethite and hematite structures. This substitution leads to a decrease in unit cell size, due to the smaller atomic radius of Al (0.053mm) compared to Fe (0.065), causing these aluminized iron oxides to display larger specific area and higher reactivity. In general, there is a lower tendency for isomorphic substitution in goethite under hydromorphic conditions (RYL, YL). Under better drainage conditions, higher substitution values are observed, probably due to higher acidity and Al activity in the solution, particularly in the case of RLs, which have a higher degree of weathering (Ker, 2003).
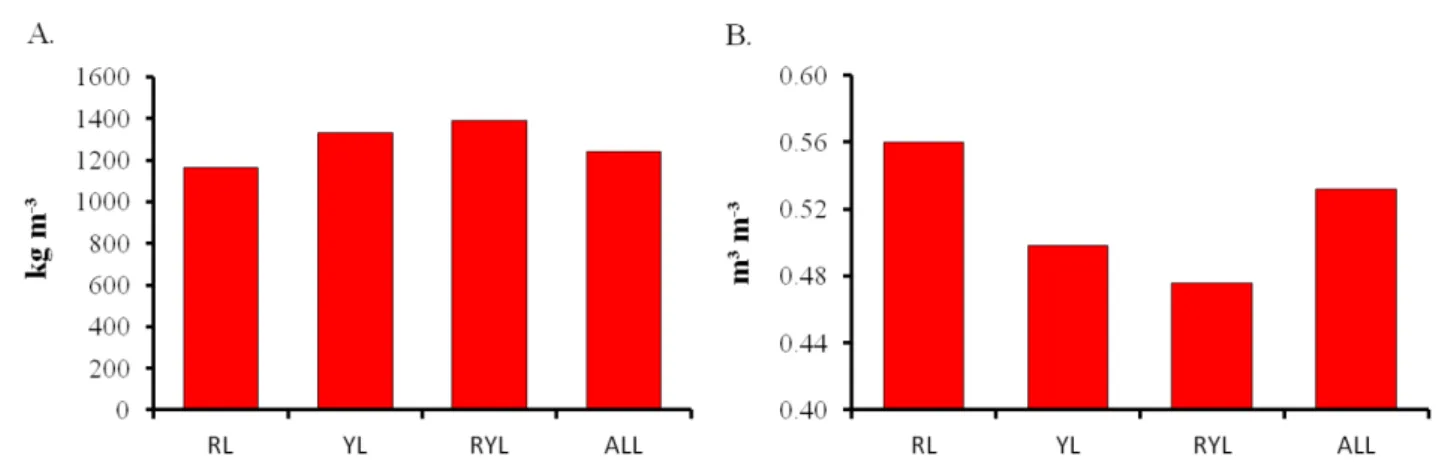
FIGURE 2. Mean soil density (A) and total porosity (B) values, generated from the database for RL, RYL, and YL suborders, and for grouped data
As it can be seen in Figure 2B, the YL presented a lower total porosity compared to the RL, which corroborates the findings of Ferreira et al. (1999), who attributed the lower values of porosity in YLs to their genesis, mineralogy and macrostructure, which consists predominantly of subangular blocks, and to higher porosity in predominantly gibbsite Latosols (RLs) as a result of their small, or very small, predominantly granular structure (Ribeiro et al., 2012).
Latosols with high gibbsite levels display higher water content retained in their structure, due to the greater number of micropores inside aggregates. This characteristic increases retention at PWP (Table 4), which partially explains the lower available water content in these soils compared to RYLs and YLs. Higher water retention in the RL can also be attributed to the greater specific surface area (SSA) of its mineralogical constituents (Tuller, 2005), which according to Resurreccion et al. (2011) is strongly related to clay content and water retention in the soil at 1,500 kPa, also determining the amount and state of water adsorption in the mineral fraction of the soil (Heister, 2016).
The results presented in this work reinforce the importance of new studies and further development in the field of soil physics and agricultural engineering. Large databases - "big data" - should be used in order to improve the knowledge regarding morphological and physio-hydrological characteristics of soil. A second estimate of AWC in Latosols could be made possible through an extensive collection of primary data (samples), submitting all samples to the same methodologies and laboratory analysis criteria, thus reducing the variability caused by methodological differences. Sample size enlargement can also be sought through "big data" platforms such as SoilGrids (https // soilgrids.org), which provides free granulometry and soil classification data for different regions on the planet.
We would like to highlight the importance of knowing the most probable values of water storage in Latosols, since it can be widely used in agriculture; in environmental and production systems modeling; in crop forecasting, technological feasibility analysis, and investments in agriculture. Solid parameters for modeling
CONCLUSIONS
1. The Red Latosol presents the highest water content at permanent wilting point (0.2472 m³ m-³), when compared to Red-Yellow (0.1682 m³-³) and Yellow Latosols (0.1524 m³-³);
2. The Red Latosol presents the lowest values of available water capacity (0.1074 m³-³) when compared to the Red-Yellow Latosol (0.1437 m³-³) and Yellow Latosol (0.2144 m³-³);
3. The highest clay content was found in the Red Latosol (560.00 g kg-1), compared with Red-Yellow (340.00 g kg-1) and Yellow Latosols (281.50 g kg-1);
4. The highest values of soil density were found in the Yellow Latosol (1,390 kg m-³) and Yellow-Red Latosol (1,330 kg m-³), and the lowest in the Red Latosol (1,165.5 kg m-³);
5. The Yellow Latosol showed the lowest value of total porosity (0.4744 m³ m-³), when compared to Red (0.5602 m³ m-³) and Red-Yellow Latosols (0.4981 m³ m-³).
REFERENCES
Abel S, Peters A, Trinks S, Schonsky H, Facklam M, Wessolek G (2013) Impact of biochar and hydrochar addition on water retention and water repellency of sandy soil. Geoderma 202-203:183-191.
Beutler AN, Centurion JF, Souza ZM, Andrioli I, Roque CG (2002) Retenção de água em dois tipos de Latossolos sob diferentes usos. Revista Brasileira de Ciência do Solo 26(1):829-834.
Cresswell HP, Lilly A (2015) A two-point method for determining the soil water characteristic of typical northern temperate boreal soils. Geoderma Regional 5:71-76.
Dumig A, Hausler M, Steffens M, Kogel-Knabner I (2012) Clay fractions from a soil chronosequence after glacier retreat reveal the initial evolution of organomineral associations. Geochimica et Cosmochimica Acta 85:1-18.
EMBRAPA - Empresa Brasileira de Pesquisa
Ferreira MM, Fernandes B, Curi N (1999) Mineralogia da fração argila e estrutura de Latossolos da região sudeste do Brasil. Revista Brasileira de Ciência do Solo 23:507-514.
Heister K (2016) How accessible is the specific surface area of minerals? A comparative study with Al-containing minerals as model substances. Geoderma 263:8-15.
Horne DJ, Scotter DR (2016) The available water holding capacity of soils under pasture. Agricultural Water Management 177:165-171.
Kampf N, Marques JJ, Curi N (2012) Mineralogia de solos brasileiros: principais aspectos. In: Pedologia:
fundamentos. Sociedade Brasileira de Ciência do Solo p82-145.
Ker JC (2003) Latossolos do Brasil: Uma revisão. Genomos 5(1):17-40.
Kirkham MB (2004) Principles of soil and plant water relations. Kansas, Dreibelbis, 2 ed. 500p.
Leão TP (2016) Particle size distribution of Oxisols in Brazil. Geoderma Regional 7(2):216-222.
Leão TP, Guimarães TLB, Figueiredo CC, Busato JB, Breyer HS (2013) On critical coagulation concentration theory and grain size analysis of Oxisols. Soil Science Society of America Journal 77:1955-1964.
Lima JEFW, Silva EM, Strauch M, Lorz C (2011)
Development of a soil database for applying SWAT model in a catchment of the Brazilian Savanna. Soil e Water Assessment Tool, 10p.
Medrado E, Lima JEFW (2014) Development of
pedotransfer functions for estimating water retention curve for tropical soils of the Brazilian savanna. Geoderma Regional 1:59-66.
Mualem Y (1976) A new model for predicting the
hydraulic conductivity of unsaturated porous media. Water Resources Research 12:513-522.
Ott RL, Longnecker M (2016) An introduction to statistical methods and data analysis. Brooks Cole, 7ed. 1273p.
Ottoni Filho TB, Ottoni MV, Oliveira MB, Macedo JR, Reichardt K (2014) Revisiting Field Capacity (FC): variation of definition of FC and its estimation from pedotransfer functions. Revista Brasileira de Ciência do Solo 38(1):1750-1764.
R Development Core Team (2014) R: A language and environment for statistical computing. Vienna, R Foundation for Statistical Computing. Available in: http://www.R-project.org
Reichardt K (1988) Capacidade de campo. Revista Brasileira de Ciência do Solo 12:221-216.
Resurreccion AC, Moldrup P, Tuller M, Ferré TPA, Kawamoto K, Komatsu T, Jonge LW (2011) Relationship between specific surface area and the dry end of the water retention curve for soils with varying clay and organic carbon contents. Water Resources Research 47:1-12.
Ribeiro MR, Oliveira LB, Filho JCA (2012) Caracterização morfológica do solo. In: Ker JC (ed). Pedologia: fundamentos. Sociedade Brasileira de Ciência do Solo, p48-79.
Shapiro SS, Wilk MB (1965) An analysis of variance test for normality. Biometrika 52:591-611.
Silva MLN, Blancaneaux P, Curi N, Lima JM, Marques JGSM, Carvalho AM (1998) Estabilidade e resistência de agregados de Latossolo Vermelho-Escuro cultivado com sucessão milho-adubo verde. Pesquisa Agropecuária Brasileira 33:97-103.
Teixeira CFA, Moraes SO, Simonete MA (2005)
Desempenho do tensiômetro, TDR e sonda de nêutrons na determinação da umidade e condutividade hidráulica do solo. Revista Brasileira de Ciência do Solo 29(2):161-168.
Tuller M (2005) Water films and scaling of soil characteristic curves at low water contents. Water Resources Research 41:1-6.
van Genuchten MT (1980) A Closed-form Equation for Predicting the Hydraulic Conductivity of Unsaturated Soils. Soil Science Society of America Journal 44:892-898.