Engineering
ISSN: 1809-4430 (on-line)
_________________________
2 Universidade Federal de Santa Maria/ Santa Maria - RS, Brasil.
PERFORMANCE OF ANALYSIS METHODS OF SLOPE STABILITY FOR DIFFERENT GEOTECHNICAL CLASSES SOIL ON EARTH DAMS
Doi:http://dx.doi.org/10.1590/1809-4430-Eng.Agric.v36n6p1027-1036/2016
TONISMAR DOS S. PEREIRA1*, ADROALDO D. ROBAINA2, MARCIA X. PEITER2,
FABIANO DE V. A. BRAGA2, RICARDO B. ROSSO3
1*Corresponding author. Universidade Federal do Pampa/ Alegrete - RS, Brasil. E-mail: [email protected]
ABSTRACT: The aim of this study was to evaluate the performance of less accurate analysis methods of slope stability, in order to reduce the number of operations used by the most accurate methods available in the literature. The study evaluated four methods for calculating slope stability. Fellenius (FELLENIUS, 1936), Bishop (BISHOP, 1955), Simplified Bishop (BISHOP & MORGENSTERN, 1960) and Simplified Janbu (JANBU, 1973) were compared with the Spencer method (SPENCER, 1967), which is considered an accurate method for calculating the factor of safety (FS). The procedure was performed in scenarios with different soil groups according to the Unified Soil Classification System (USCS) (ASTM 2011), heights and slope inclinations, and under conditions of reservoir subject to fast and slow emptying. Thus, comparative analyses were made using the correlation index "r", the accuracy index "d" (WILLMOTT et al, 1985) and the performance index "c" (CAMARGO & SENTELHAS, 1997). The methods that had optimal performance for the analyzed conditions were the Simplified Bishop, the Simplified Janbu and the Bishop methods; the Simplified Bishop method obtained a correlation coefficient of 99%. Thus, they can be used as alternative methods to replace the Spencer method in the analysis of slope stability on earth dams.
KEYWORDS: Fellenius, Bishop, Simplified Bishop, Simplified Janbu, Spencer.
INTRODUCTION
Water is a resource widely used for human consumption and in industry, agriculture, power generation, transportation, leisure, assimilation, and the transportation of effluent (MEDEIROS et al., 2010), thus the use of surface freshwater resources and the need to store them during periods of reduced availability highlight the need to build dams in order to optimize water availability in each watershed (LIRA et al., 2014).
Although earth dams are historically described as some of the oldest human endeavors, the application of rational engineering processes to the study and design of earth dams began only in the mid-1930s, with the development of Soil Mechanics (ESTEVES, 1964). According to the USCS (ASTM 2011) geotechnical classes that best fit the implementation of dams, according to the proportion of fine particles are inorganic clays of high plasticity (CH); bit plastic clays (CL); clayey sand (SC), which are mostly lateritic soils with predominance of hematite and goethite and high levels of oxides, hydroxides and oxyhydroxides of iron and aluminum; Silt elastic (MH) usually micaceous or diatomaceous; silty materials (ML) mostly with macrocrystals kaolinite; and silty sand (SM), where with the fine portion also saprolite source when it comes to tropical soils.
(SILVA & BARROS FILHO, 2003).
As in most technological systems, the absolute safety of dams cannot be guaranteed; therefore, design and sizing criteria are adopted. They correspond to guarantees of strength and functionality with "safety" margins considered "comfortable" by the technical-scientific community (ALMEIDA, 2009).
The ABNT standard NBR 13029/2006 states that the minimum factor of safety (FS) against slope rupture should be equal to 1.50. The factor of safety can be defined as the ratio between stabilizing efforts (resistant) and destabilizing efforts (active) (VANMARCKE, 2011). Several methods have been proposed for calculating the factor of safety, whose accuracy varies as a function of the assumptions made by their authors to solve the static equilibrium of a massif (HORST, 2007).
According to STEWARD (2011), a significant development has been brought about by the limit equilibrium methods introduced by FELLENIUS (1936). It divides the sliding soil mass contained within the circular arc into slices, and analyzes its equilibrium by equalizing the forces and moments to zero, based on the assumption that resistance follows Coulomb's equation along the sliding line. Similar methods that have also been developed include Janbu (JANBU, 1954), Bishop (BISHOP, 1955), Morgenstern and Price (MORGENSTERN & PRICE, 1965), Spencer (SPENCER, 1967), Simplified Janbu (JANBU, 1973) and Simplified Bishop (BISHOP & MORGENSTERN, 1960). Among these methods, the most rigorous ones are Spencer's and Morgenstern and Price's, which include all the forces between slices and satisfy all the equations for static equilibrium (forces and moments) (GEO-SLOPE, 2008) so as to be also used for more sophisticated analysis.
Based on the above, the objective of this study was to evaluate the performance of four different methods for the calculation of slope stability in six different groups of soil individually, in order to find out which one is the most accurate. Thus, a methodology that can be effective and concise is sought for projects where knowledge of the factor of safety is required.
MATERIAL AND METHODS
The study was based on the need to match the main analysis methods of slope stability for circular rupture surfaces on earth dams, with the main purpose to seek the most suitable and easy-resolution method. The methods evaluated were Fellenius (Equation 1) this being a simple and conservative model, but it presents considerable errors, particularly in cases of deep circles and high pore pressures; Bishop (Equation 2) based on the method of slices that takes into consideration the reactions between the adjacent slices being able to analyze break in cohesive soils; Simplified Bishop (Equation 3) which simplifies the previous method considering that the forces of interaction between the slices are horizontal, with the disadvantages of being an interactive method and not be accurate in stratified soils; and Simplified Janbu (Equation 4) the same manner as that Simplified Bishop disregards the vertical and tangential components of the slices, however, differs from all the above, it can be used on slipping surfaces not necessarily circular.
(1)
(3)
(4)
where,
c – soil cohesion, kg cm-2;
ø– internal soil friction angle, °;
P, b, l, , – respectively: weight of soil slice, Mg; width of soil slice, m; arc length on slice base, m; pore pressure of slice, mca; and inclination of slice base, °;
U– neutral force;
Vn-1- Vn+1– vertical forces of adjacent slices to the analyzed slice,
f0 – correction factor relative to sliding surface geometry.
These were compared to the Spencer method (SPENCER, 1967) (Equation 5), because this is considered a more accurate and/or rigorous method, as it considers the equilibrium of forces and moments. The problem is solved graphically at the point of intersection of the two functions, FSm (based on the moment equilibrium equation) and FSh (based on the hypothesis of constant θ value).
(5) where,
Q - Resultant of pair of interslice forces;
h – Height at the center of the slice, m,
– Slope of the resultant (Q) of the pair of interslice forces, °.
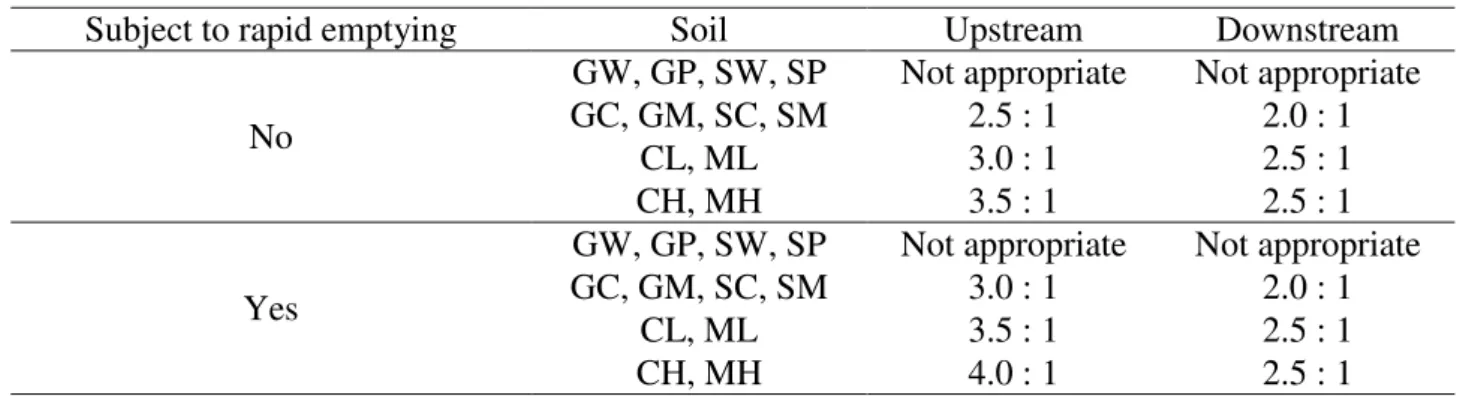
No
GW, GP, SW, SP Not appropriate Not appropriate
GC, GM, SC, SM 2.5 : 1 2.0 : 1
CL, ML 3.0 : 1 2.5 : 1
CH, MH 3.5 : 1 2.5 : 1
Yes
GW, GP, SW, SP Not appropriate Not appropriate
GC, GM, SC, SM 3.0 : 1 2.0 : 1
CL, ML 3.5 : 1 2.5 : 1
CH, MH 4.0 : 1 2.5 : 1
Data on cohesion, density, internal friction angle, porosity, neutral pressure or pore pressure and effective stress in different groups of soils were used for the calculation of the factor of safety (FS), according to the instruction of the National Department of Works Against Drought (DNOCS, 1977) (Table 2). Different inclinations were also used, which are also given in terms of soil groups, heights and slope geometries. In all cases, the accepted value of particle density was 2.65 g/cm³, since this value is common for most soils. Thus the values used are characteristic and representative of different soil types.
TABLE 2. Physical parameters of various groups of soil.
Soil group
Proctor compaction
Shear strength
max. hoptimal C' C'sat
g/cm³ % kg/cm² kg/cm²
SM 1.82 ± 0.02 14.5 ± 0.4 0.48 ± 0.02 0.52 ± 0.06 0.20 ± 0.07 33.8 ± 1.2 SC 1.84 ± 0.02 14.7 ± 0.4 0.48 ± 0.01 0.76 ± 0.02 0.11 ± 0.06 31,0 ± 4.0 ML 1.65 ± 0.02 19.2 ± 0.7 0.63 ± 0.02 0.68 ± 0.01 0.09 ± (x) 31.8 ± 2.3 CL 1.73 ± 0.03 17.3 ± 0.3 0.56 ± 0.01 0.88 ± 0.01 0.13 ± 0.02 28.4 ± 2.3 MH 1.31 ± 0.06 36.3 ± 3.2 1.15 ± 0.12 0.73 ± 0.03 0.20 ± 0.09 25.2 ± 2.9 CH 1.50 ± 0.03 25.5 ± 1.2 0.80 ± 0.04 1.04 ± 0.03 0.11 ± 0.06 19.3 ± 5.1
For purposes of calculating the safety edge and free board for all scenarios, the maximum longitudinal length of 1 km was adopted for the hydraulic basin at the maximum level, measured perpendicularly to the dam, and super elevation of 0.40 m was considered.
Based on the calculated values of FS, linear regression equations were corrected, where the dependent variable was FS, obtained by the Spencer equation, and the independent variable was the
FS values estimated by the other methods. Then, comparative analyses were performed using the correlation coefficient “r”, the accuracy coefficient “d” (WILLMOTT et al., 1985) and the
performance or reliability coefficient “c” suggested by CAMARGO & SENTELHAS (1997) where
, with performance classes: Excellent, Very good, Good, Average, Poor, Bad and Terrible for the c values greater than 0.85, 0.76 - 0.85, 0.66 - 0.75, 0.61 - 0.65, 0.51 - 0.60, 0.41 - 0.50 and less than 0.41, respectively.
The correlation coefficient r (Equation 6) may range between 0 a +1 and 0 a -1, and it was classified according to SILVA & BARROS FILHO (2003).
P - average of estimated values;
Oi - observed value, and
O - average of observed values.
The accuracy coefficient d varies from zero for no correlation, to 1 for perfect concordance (Equation 7).
(7)
where,
Pi - estimated value;
Oi - observed value, and
O - average of observed values.
RESULTS AND DISCUSSION
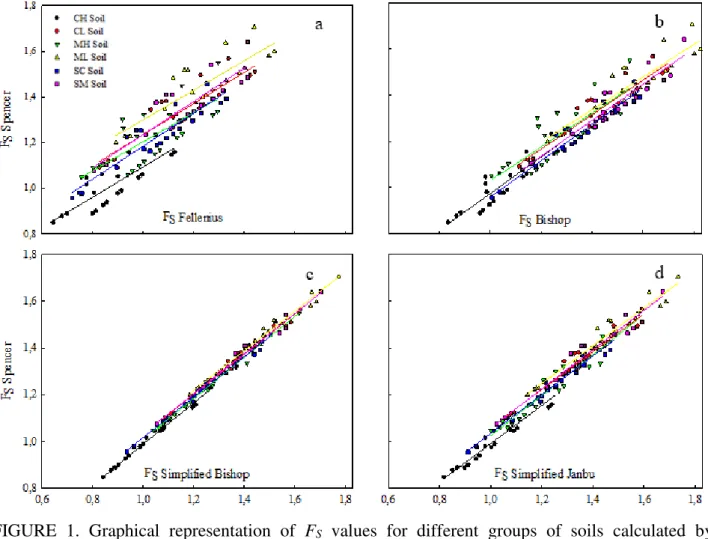
The results were grouped into comparative tables allowing assessments of the application of different methods. After the procedures were performed, there was a total of 120 values of factors of safety FS for each method evaluated. Figures 1a, 1b, 1c and 1d show the graphical relationship between the values of factors of safety FS by the Spencer method and the Fellenius, Bishop, Simplified Bishop and Simplified Janbu methods, respectively.
By analyzing the values of FS and relating them to soil group (Figure 1), it can be seen that for all the studied methods and all conditions for height, profiles and reservoir emptying rate, the soils that had respectively smaller and higher factors of safety were CH (high plasticity, fat clays) and ML (silty material of low-plasticity).
The soil group CH has the lowest values, because it has the least internal friction angle; in addition, according to the standard ABNT/NBR 6502/95, for consistency, the plastic state characterizes soft, medium and stiff clays, and these have difficulty in drying, as cracks can occur; they are subject to large deformations, and have low shear strength.
FIGURE 1. Graphical representation of FS values for different groups of soils calculated by different methods of slope stability compared with the Spencer method. The line represents the linear regression fitted to the data, where y = Fs obtained by the Spencer method, x = Fs obtained by the other methods.
However, VILLIBOR et al. (2009), addressing bases for roads, draws attention to soil with a high percentage of macrocrystals kaolinite (ML) and mica (MH), because they were linked to low support values and resilient modulus. Moreover, many laterite soils (CL, SC) that do not meet traditional criteria of particle size and index properties may be suitable, because they have high CBR, low expansion and a high modulus of resilience, among other properties.
Visually, it can be noticed that the Simplified Bishop method has greater approximation of points in different groups of soils, and it has the equations with the best fit for them (Table 3). The Simplified Janbu method also showed good coefficients of determination R². XUE & GAVIN (2007), when modeling the simultaneous determination of the critical sliding surface and reliability index for slopes, considered soil properties as random variables analyzed with probability theory, because of the differences generated by their nonlinearity.
TABLE 3. Values of the angular a, linear b and determination R² coefficients for the different methods of calculating slope stability vs the Spencer method in different soil groups.
Method Fellenius Bishop Simplified Bishop Simplified Janbu
soil a b R² a b R² a b R² a b R²
When all the data were used, so as not to discriminate soil group or slope geometry, it was observed that performance, as indicated by the high values of the confidence index, was not rated as Excellent only by the Fellenius method, which rated performance as Average. However, the analysis of performance focused on slope geometry and on the difference in water profiles in upstream and downstream slopes, a change in the performance of the methods can be observed.
Table 4 show that when each group of soil is analyzed separately in downstream slopes, the Fellenius and Bishop methods performed considerably worse when compared with the analysis done with all data gathered.
The Simplified Bishop and Simplified Janbu methods kept Excellent performance even under these conditions.
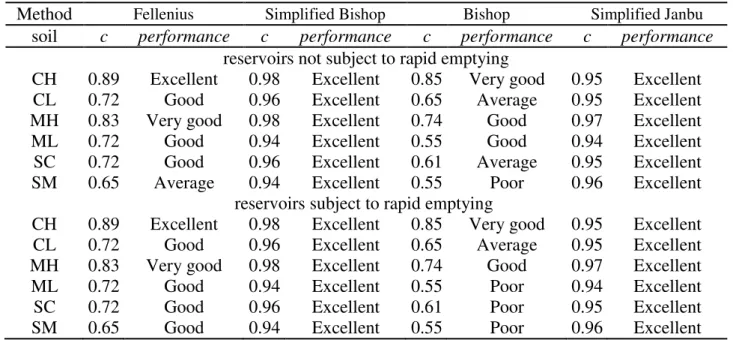
TABLE 4. Values for reliability index or performance index c and quality performance class for downstream slopes in reservoirs not subject to rapid emptying and reservoirs subject to rapid emptying.
Method Fellenius Simplified Bishop Bishop Simplified Janbu
soil c performance c performance c performance c performance
reservoirs not subject to rapid emptying
CH 0.89 Excellent 0.98 Excellent 0.85 Very good 0.95 Excellent
CL 0.72 Good 0.96 Excellent 0.65 Average 0.95 Excellent
MH 0.83 Very good 0.98 Excellent 0.74 Good 0.97 Excellent
ML 0.72 Good 0.94 Excellent 0.55 Good 0.94 Excellent
SC 0.72 Good 0.96 Excellent 0.61 Average 0.95 Excellent
SM 0.65 Average 0.94 Excellent 0.55 Poor 0.96 Excellent
reservoirs subject to rapid emptying
CH 0.89 Excellent 0.98 Excellent 0.85 Very good 0.95 Excellent
CL 0.72 Good 0.96 Excellent 0.65 Average 0.95 Excellent
MH 0.83 Very good 0.98 Excellent 0.74 Good 0.97 Excellent
ML 0.72 Good 0.94 Excellent 0.55 Poor 0.94 Excellent
SC 0.72 Good 0.96 Excellent 0.61 Poor 0.95 Excellent
SM 0.65 Good 0.94 Excellent 0.55 Poor 0.96 Excellent
The Simplified Bishop and Simplified Janbu methods maintained excellent performance even under these conditions.
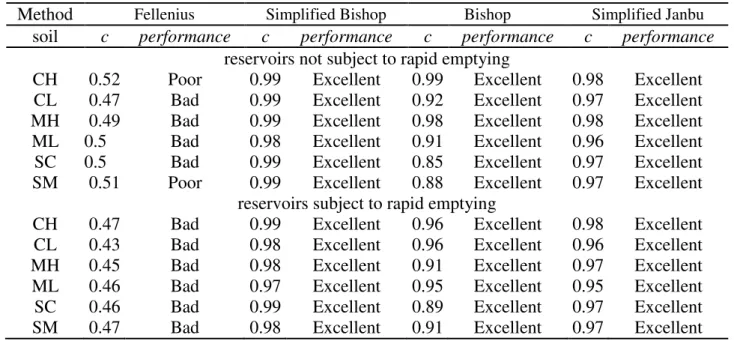
rapid emptying.
Method Fellenius Simplified Bishop Bishop Simplified Janbu
soil c performance c performance c performance c performance
reservoirs not subject to rapid emptying
CH 0.52 Poor 0.99 Excellent 0.99 Excellent 0.98 Excellent
CL 0.47 Bad 0.99 Excellent 0.92 Excellent 0.97 Excellent
MH 0.49 Bad 0.99 Excellent 0.98 Excellent 0.98 Excellent
ML 0.5 Bad 0.98 Excellent 0.91 Excellent 0.96 Excellent
SC 0.5 Bad 0.99 Excellent 0.85 Excellent 0.97 Excellent
SM 0.51 Poor 0.99 Excellent 0.88 Excellent 0.97 Excellent
reservoirs subject to rapid emptying
CH 0.47 Bad 0.99 Excellent 0.96 Excellent 0.98 Excellent
CL 0.43 Bad 0.98 Excellent 0.96 Excellent 0.96 Excellent
MH 0.45 Bad 0.98 Excellent 0.91 Excellent 0.97 Excellent
ML 0.46 Bad 0.97 Excellent 0.95 Excellent 0.95 Excellent
SC 0.46 Bad 0.99 Excellent 0.89 Excellent 0.97 Excellent
SM 0.47 Bad 0.98 Excellent 0.91 Excellent 0.97 Excellent
Table 5 shows that for upstream slopes subject to rapid emptying, the performance of the Fellenius method is even worse than for the other conditions; it has bad performance in all groups of analyzed soil.
CONCLUSIONS
According to the methodology and the conditions under which this study was conducted, it was concluded that the methods that had excellent performance for all conditions with the highest reliability levels were, respectively, the Simplified Bishop and the Simplified Janbu methods; however, the Simplified Bishop method obtained the highest coefficients of determination for all groups of soils.
Soil groups with the lowest and the highest factors of safety FS were respectively CH (medium or high plasticity fat clays) and ML (silty material and very fine sand, powder-stone, silty or clayey fine sands or low-plasticity clayey silts); CH had the largest profile, which implies larger movements of the soil and hence higher construction costs for earth dams.
ACKNOWLEDGEMENTS
The authors would like to thank the Coordination for Improvement of Higher Education Personnel (CAPES) and the National Council for Scientific and Technological Development (CNPq).
REFERENCES
ABNT. Rochas e solos – Terminologia. NBR 6502. Rio de Janeiro: Associação Brasileira de
Normas Técnicas, 1995. 18p.
ABNT. Mineração – Elaboração e apresentação de projeto de disposição de estéril em pilha. NBR
13029. Rio de Janeiro: Associação Brasileira de Normas Técnicas, 2006. 5p.
BISHOP, A. W. “The Use of the Slip Circle in the Stability Analysis of Slopes” Géotechnique, London, v.5, n.1, p.7-17, 1955.
BISHOP, A. W.; MORGENSTERN, N. Stability coefficients for Earth Slopes. Géotechnique, London, v.10, n. 4, p.164-169, 1960.
CAMARGO, A. P.; SENTELHAS, P. C. Avaliação do desempenho de diferentes métodos de estimativa da evapotrasnpiração potencial no estado de São Paulo. Revista Brasileira de Agrometeorologia, Santa Maria, v. 5, n.1, p. 89-97, 1997.
COSTA, T.; LANÇA, R. Faro: Universidade do Algarve, Barragens. Núcleo de hidráulica e ambiente. 2001.
DNOCS. Instruções gerais a serem observadas na construção das barragens de terra. 2. ed. Fortaleza, 1977. 151 p.
ESTEVES, V. P. Barragens de terra. João Pessoa: Escola Politécnica de Campina Grande, Universidade Federal da Paraíba, 1964.
FELLENIUS, W. Calculation of stability of earth dams. In: TRANS. 2nd CONGRESSO ON LARGE DAMS, 4; 1936, Washington, v.4, 445p.
GEO-SLOPE International. Stability Modeling with SLOPE/W 2007 Version – An Engineering Methodology. 4th ed. Calgary: GEO-SLOPE, 2008, Calgary, Alberta, Canada, v.3, 367p.
HORST, R. Avaliação dos métodos para cálculo de estabilidade de taludes em maciço terroso. 129 f. Monografia (Trabalho de Conclusão de Curso Engenharia Civil) – Universidade Regional do Noroeste do Estado do Rio Grande do Sul, Ijuí, 2007.
JANBU, N. Applications of composite slip surfaces for stabilityanalysis. In: EUROPEAN
CONFERENCEON THE STABILITY OF EARTH SLOPES, 3., 1954, Stockholm. Procedings…
p.43.
JANBU, N. Slope stability computations. Embankment dam - engineering. In: HIRSCH FIELD, E.; POULOS, S. (Ed.) Casa grande memorial, New York: Wiley, 1973. v.E, p.47– 86.
LIRA, D.; TOLEDO, C.; MAMEDE, G. Silting in the dense reservoir network of the Pereira de Miranda catchment. Engenharia Agrícola, Jaboticabal, v.34, n.4, p.671-682, jul./ago. 2014.
MEDEIROS, S.S.; GHEYI, H.R.; SOARES, F.A.L. Cultivo de flores com o uso de água residuária e suplementação mineral. Engenharia Agrícola, Jaboticabal, v.30, n.6, p.1071-1080, nov./dez. 2010.
MORGENSTERN, N. R.; PRICE, V. E. The analysis of the stability of general slip surfaces.
Geotechnique, London, v.15, n.1, p.79 – 93, 1965.
PINTO, C. S. Curso básico de mecânica dos solos. São Paulo: Oficina de Textos, 2000. 247p.
ROCHA, W.W.; DIAS JUNIOR, M.S.; LIMA,J.M.; MIRANDA, E.E.V.; SILVA, A.R. Resistência ao cisalhamento e grau de intemperismo de cinco solos na região de Lavras (MG). Revista Brasileira de Ciência do Solo, Viçosa, MG, v.26, p.297-303, 2002.
SILVA, D. da; BARROS FILHO, A. F. B. Estatística. São Paulo: USP, 2003.
SPENCER, E. E. A method of the analysis of the stability of em-bankments assuming parallel inter-slice forces. Géotechnique, London, v.17, p.11–26, 1967.
STEWARD, T.; SIVAKUGAN, M.; SHUKLA, S. K.; DAS, B. M. Taylor’s slope stability charts revisited. International Journal of Geomechanics, Boca Raton, v.11, n.4, ago. 2011. doi: 10.106 1/(ASCE)G M.1943-56 22.00000 93
WILLMOTT, C. J.; CKLESON, S. G.; DAVIS, R. E. Statistics for evaluation and comparisons of models. Journal of Geophysical Research, Ottawa, v.90, n.C5. p.8995-9005, 1985.